
 Overview of Where We Are
I’ve spent a lot of time thinking about all the assets I cover and how they’re all moving to a synchronized turn. Here are my thoughts.
Last week, it looked like currency pairs were going to turn early. They seemed to be topping with everything else. In other words, it seemed like EURUSD would not make its 38% retrace target at 1.24. However, with Friday’s spike to new highs, that may not in fact, be the case.
The US dollar also had not bottomed, which seemed a bit odd. On Friday, however, it dropped to a new low and is flirting with a double bottom. I have for a very long time called for this to happen and said that the US market would top at the same time. Well, here we are …
In any event, I’ve seen this show before, where currencies shoot up to get to a pre-determined target at the last minute. That seems to be what’s happening. So a BIG CAUTION is in order here in terms of the US indices.
This is a 500 year top. The US indices are at a top. However, I’d be really surprised if they go easily; if we don’t get a double top. I’ll be looking very intently at the first wave down from here in the US market to see whether it’s corrective or impulsive.
There will be tons of time to react; after all, this bear market will last years. So, while I expect the US market to start down this week, I would not be at all surprised to see a test of the current highs before heading down in earnest.
Most everything is at an inflection point, or very close to a turn. Tuesday will be critical, I think, but patience is warranted still. This week should finally see a turn, but all our ducks need to be in order.
______________________________
Oops! Tesla
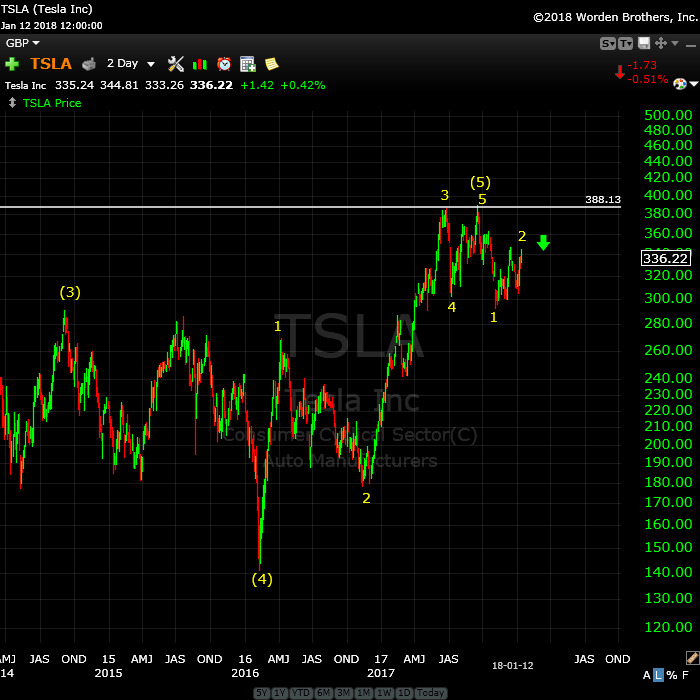
Above is the 2 day chart of Tesla.
Time to think about bidding “adieu” to Elon. Things have not been going well lately, and they’re about to get a whole lost worse.
Last week, I suggested we’d head up in a “double-pronged” second wave, which is exactly what we’ve done. We’re getting ready for a turn down into a third wave.
__________________________
And then there’s APPL
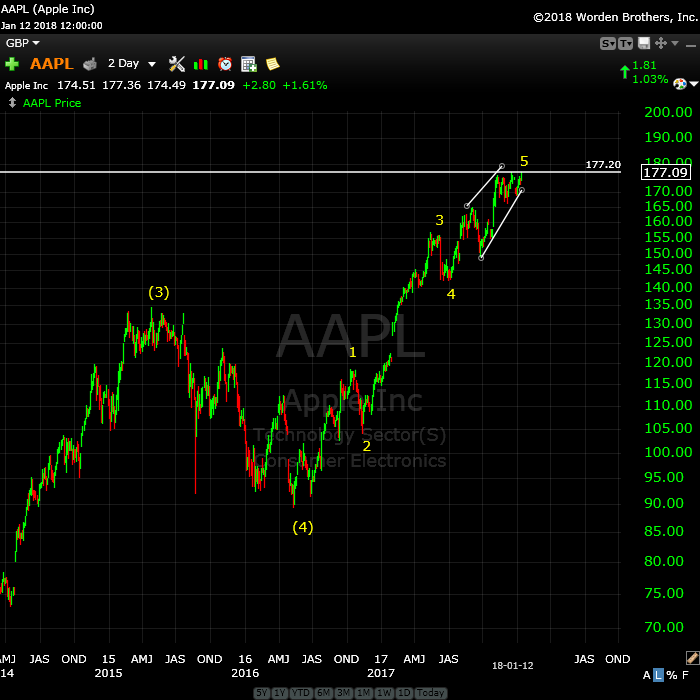
Above is the 2 day chart of Apple (AAPL). I’ve been expecting a double top here and a possible turn down from that level. We may get a small spike about this level, but the count is full. Also take a look at NFLX and FB, which are finishing ending diagonals.
Looking for a turn in AAPL.
__________________________
Changes to the Free Blog
I’m still on the fence as to the direction I’m going to take on this. In the meantime, this weekend, I’m fiddling with the website plugin that lets you sign up for emails every time a comment is logged. You may or may not see odd things happening as we try to nail this bug.
This past week, I had the developer of the underlying framework do a complete review of the site, which has led to quite a few changes “under the hood,” most of which you won’t notice. If something seems odd, first just empty your browser’s cache, which may alleviate the issue.
One thing that you might notice is that the site is very much faster in loading. Pages load much faster than they did before and overall, is just “snappier.” A lot of work went into it, so I hope you see the results.
______________________________
Problem receiving blog comment emails? Try whitelisting the address. More info.
______________________________
A true expert in Elliott Wave FL 2
A true expert in Elliott Wave …You are a true expert in EW analysis. What you provide is not available anywhere and is priceless. Subscription on your services is the best thing I have ever done. Many thanks for your effort to make me a better investor. I now have more trust in my investment decisions. I hope you will continue the excellent work! —FL |
Rise above the rest … SM 2
Rise above the rest …I have only ever met a few people who, in their chosen fields (astrology, medicine, music, martial arts, technical analysis), rise above all the rest and you are one of them…you have ‘the gift’…and that’s why I’m a Trader’s Gold member. —SM |
Tops in your field DZ 2
Tops in your field …You are tops in your field. Tried to follow Elliot Wave international for years. They were always behind the market. After discovering you, I perceive that you are an expert in reading the waves, which puts you way ahead of the rest of your peers. And you can read the Waves like you are reading tomorrow’s financial section. I pray you stay healthy. —DZ |
Get an upper hand … JC 2
Get an upper hand in trading …Seeing all the different currency pairs and the wave structures and hearing you explain why this has to do that on a nightly bases gives one a upper hand when trading. Elliott Wave applies to all stock and indices and can be applied to any candlestick chart. If someone ask what you want for Christmas – Tell them a membership to Peter’s “Traders Gold!”—JC |
the real deal SM 2
The real deal …‘Educational, insightful and thorough market analysis for all levels of traders. It’s Elliott Wave at its best….Peter Temple is the real deal’ —SM |
Couldn’t be happier … KK 2
Couldn’t be happier …The analysis and insight you provide is simply amazing! I’ve been trading the futures and equity markets for well over thirty years and usually average around 5% monthly. Since joining your Traders Gold Service two months ago, that number has better than doubled. I couldn’t be happier.—KK |
Have not had a losing week RW 2
Have not had a losing week …I have been with Peter almost a year. The only thing that matters is have I made money with his service. I think I have finally turned the corner using Peter’s EW. I have not had a losing week in the last 5 months. Thanks Peter, for your amazing amount of hard work. —RW |
The best of them JL 2
The best of them …Last couple of years, I subscribed to several ‘market traders’. You are by far the best of them and the personal contact is awesome. Daily and daily updates are very well written! Besides your expertise in EW, I also like your cycles analysis. Best investment I ever made! —JL |
The Market This Week
Here's the latest daily chart of ES (emini futures)
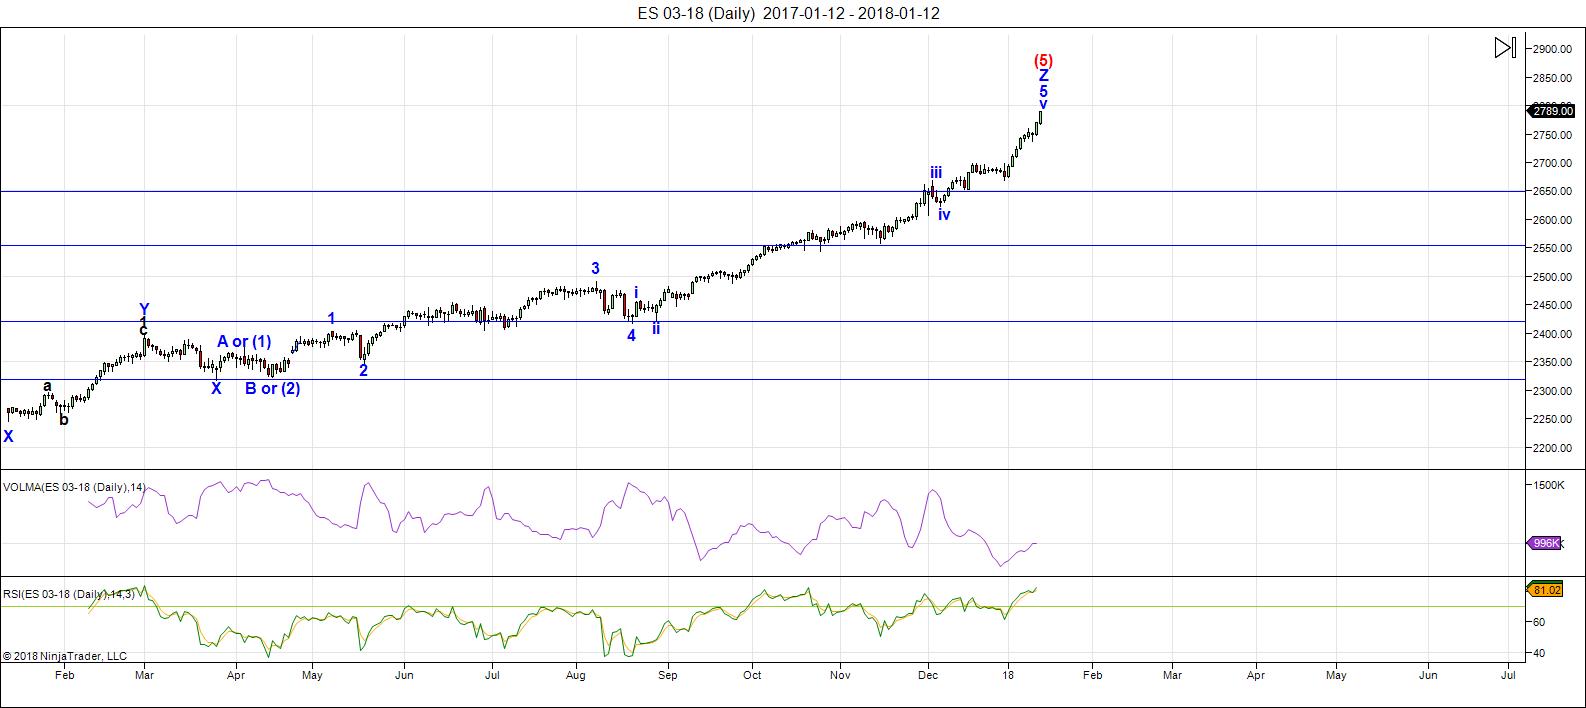
Above is the daily chart of ES (click to enlarge, as with any of my charts).
There have been no material changes to my prognosis. We are at the high. I expect this final wave to turn down this week. But, we may end up with a double top, so the first turn might not be the final one.
On Friday, ES completed an ending diagonal (5 min chart). Ending diagonals can have double tops, so best to wait for the first wave down and then the second wave up to the 62% level before going short.
If the final pattern is truly an ED, ES, should not rise about 2790. However, with currencies and others not quite at targets, the US indices warrant a fair amount of caution.
Volume: It's dismal. Its the purple line, the top indicator at the bottom of the chart.
Summary: The count is full for the US market in general, so we're looking for a turn this week, once everything lines up. This is a major turn and will require all US indices, related currency pairs and of course, the US dollar, to turn at the same time. Be cautious and watch for the turn, which will change the trend and end the 500 year bull market.
___________________________
Trader's Gold Subscribers get a comprehensive view of the market, including hourly (and even smaller timeframes, when appropriate) on a daily basis. They also receive updates through the comments area. I provide only the daily timeframe for the free blog, as a "snapshot" of where the market currently trades and the next move on a weekly basis.
______________________________________
Sign up for: The Chart Show
Next Date: Thursday, January 25 at 1:00 pm EST (US market time)

The Chart Show is a one hour webinar in which Peter Temple provides the Elliott Wave analysis in real time for the US market, gold, silver, oil, major USD currency pairs, and more. You won't find a more accurate or comprehensive market prediction anywhere for this price.
Get caught up on the market from an Elliott Wave perspective. You’ll also get Andy Pancholi cycle turn dates for the SP500 for the balance of the current month. There’ll be a Q&A session during and at the end of the webinar and the possibility (depending on time) of taking requests.
All registrants will receive the video playback of the webinar, so even if you miss it, you’ll be sent the full video replay within about an hour of its conclusion. For more information and to sign up, click here.


wow…thanks for sharing!
Hi Peter, is the count already invalidated? We’re already well above 2790. Thanks
The count is not. The ending diagonal is, the way I’ve identified it. That’s why I was urging caution.
Harvey,
It simply might be part of a larger ending diagonal, which seems to be what’s forming. These things morph into bigger ones sometimes.
Thank-you Peter for being “the Petra” the strong foundation on which this site is built on. Without this page many here will no longer have a voice. Keep up the good work brother!
Thanks for all….nick
NOT AN ENDORSEMENT
“My S&P Target Is 2800… And I’m Predicting A Bear Market. Yes, I’m Sane.” – Lee Adler | November 30, 2017
https://suremoneyinvestor.com/2017/11/my-sp-target-is-2800-and-im-predicting-a-bear-market-yes-im-sane/
“Let Me Take You Behind The Scenes in My “SPX Prediction Machine”…” – Lee Adler | December 6, 2017
https://suremoneyinvestor.com/2017/12/let-me-take-you-behind-the-scenes-in-my-spx-prediction-machine/
Anyone with a strong belief in the coming bear would be 90-95% cash so i guess Lee Adler is mildly confident of a bear.
“I am still looking to reach 60-70% cash by the end of January, or the end of the first quarter at the latest” – Lee Adler | December 6, 2018
Yep so not so bearish as he is prepared to destroy 30% of his money
Now, Peter may be wrong. Bears may be 110% wrong. But. With the whole web, literally terabytes and terabytes of forums, blogs, tweets, articles projecting the sudden demise of natural cycles, economic rules, physics laws, in favor of a straight line to the moon that will make everyone rich and happy – now, with that, can you explain to me what’s the hidden satisfaction of taunting bears on the only byte they have left in the whole Internet. Seriously, I’m curious from a psychiatric standpoint.
I’m a bear overall. I don’t get what you are saying. Yes I hold long’s in ES and Dow for now but I will have plenty of notice when to get out.
Hi Peter, the ending diagonal I was searching for. Youre 500 years top is also confirming the big picture. Thanks :-). If we are at 4 of the ending diagonal bear market? the european market are going to decline 50%. The one who predicts it have done it in 2000 and 2007.
So watch the next weeks. My indicators are stil giving a lowest low at the end of march. Be careful
Willem
Sweet lake city
Holland
if you haven’t already read it, you may want to purchase the UNIVERSAL CYCLE THEORY FINANCIAL NEWSLETTER by Steve Puetz dated January 15, 2018.
Puetz has been fairly unreliable. Not every crash window works, many don’t. I knew someone who subscribed to his newsletter, he stopped after a year.
Per Peutz, for a crash window to become a live candidate, you must have rampant speculation, which in itself is rare, and is why those who look for a crash every time a window opens are disappointed. I have found that there tends to be significant weakness for at least some part of the market, even if marquee indices move higher. I actually think he is a reasonable writer. He has been on the wrong side of the market for some time given his bearish mindset (which stems from long term cycles) but I for one see the current price action as part of an ongoing secular bear market (based on wave structure, bond markets, funding markets) so I am more apt to be forgiving than others.
https://www.timeanddate.com/eclipse/2018
Total Lunar Eclipses during 2018: January 31 & July 27
Jan 16th energy chart attached
looks like it tops out around 11:30 am tomorrow
then a big bounce back up around 2:30 pm
https://ibb.co/gfmpU6
ES update w/ final subwaves of subwaves…..https://invst.ly/6cls7
and a pullback look of w5………………………https://invst.ly/6clqg
I gather most of you are aware of the TOY [ TURN/Trend Of Year ] Barometer ?
tweeted to myself in one of my locked twitter accounts awhile back ::
TOY Period = $SPX % Change from Nov 19-Jan 19
TOY Year = $SPX % Change from Jan 19-Jan 19
Note:TOY period is last 2 months of the TOY year.
A Red Ryder TOY Signal occurs when a Negative TOY year (Jan19-Jan19) concludes w/a positive TOY Period (Nov19-Jan19)
http://www.naaim.org/wp-content/uploads/2013/10/00J_A-Red-Ryder-Christmas-Wayne_Whaley-1.pdf …
Wayne Whaley “TOY Barometer”
http://www.futuresmag.com/author/wayne-whaley …
The Turn Of The Year (TOY) Stock Market Barometer
https://www.linkedin.com/pulse/turn-year-toy-stock-market-barometer-alessandro-nilo
Maximizing Returns With Wayne Whaley’s TOY Barometer
https://www.seeitmarket.com/maximizing-returns-with-wayne-whaleys-toy-barometer-14996/
re Astrology ::
“ If the Moon is fast, there’s lots of activity in the market, or if its slow, change is predicted.”
Jack Gillen.
Perigee: Moon closest to the Earth [ FASTER ]
Apogee: Moon farthest from the Earth [ slower ]
TOY test:
11/17/00 136.64 Close
01/19/01 134.02 Close -2.62 -1.92%
12/31/01 114.3 Close
01/31/01 2001 High
09/21/01 2001 low
11/19/93 46.31 Close
01/19/94 47.34 Close 1.03 2.23%
12/30/94 45.56 Close
01/31/94 1994 Hi
1994 lows:
04/04/94
04/19/94
05/11/94
06/24/94
LizH
this might also be of some interest ?
https://twitter.com/search?f=tweets&vertical=default&q=%40SJD10304%20TOY&src=typd
whereby Steve Deppe states:
30 Nov 2017
If you’re following Wayne Whaley’s TOY Barometer, the start close for 2018 is 2578.85.
A close > 2656.21 on 1/19/2018 triggers another Whaley “Bullish” TOY barometer. #spx
27 Dec 2017
We’re also on track for a Whaley Bullish TOY, which continues to be as powerful of an “all-clear” sign i’ve ever seen – for reasons completely unknown to me.
1/19 close the key.
29 Dec 2017
other factors to watch in January, where are we on 1/19’s close? Whaley Bullish Toy Signals are remarkably successful, as good as any longer term timing signal i’ve seen. > 2656.21 and you should strongly consider leaving your Bear suit to collect dust in the closet.
Jan 10 2018
unless “this time is different” – which is always possible. But a good omen nonetheless, especially when assuming we get another Whaley Bullish TOY on 1/19.
Jan 11 2018
6 days left in Whaley’s TOY season, and it will take the biggest pullback we’ve seen since god knows when to erase a “Bullish TOY” signal. Ironic. #spx
When the FED calculates inflation based on the price of milk, bread and eggs but ignores the massive inflation created by cheap money chasing overpriced stocks you get the mother of all bubbles.
https://ibb.co/nPY9gm
Absolutely. The incorrect model of inflation can be fixed by adding a weighting of house prices and S&P P/E ratio. If this had been implemented the FED may have tightened long ago preventing a bubble as large as this forming.
TOY test:
11/17/00 136.64 Close
01/19/01 134.02 Close -2.62 -1.92%
12/31/01 114.3 Close
01/31/01 2001 High
09/21/01 2001 low
11/19/93 46.31 Close
01/19/94 47.34 Close 1.03 2.23%
12/30/94 45.56 Close
01/31/94 1994 Hi
1994 lows:
04/04/94
04/19/94
05/11/94
06/24/94
Moon Phases — Star Gazing Events for 2018
https://www.pinterest.com.au/pin/113434484347441283/
reminder:
BUY the FULL moon + 4 Trading Days
SELL the NEW moon + 4 Trading Days
so yea..see a sell-off this week (NEW moon Jan 17) .. but not the 10-15% most are predicting. think more like 3% – 3.5% IF $SPX hits 2810 — one’s looking around the 2715 area [ Jan 3, 2018 ]
BULL Market 2018
Kerry’s pretty good . he also introduced me to Puetz Theory. https://twitter.com/17_6YrStockCyc/status/944139420038549504
“In 2013 I wrote that the secular bull market would begin in 2018 & that 2013 was a good time to start accumulating stocks in anticipation of this. Jan 2017 is when I think we started the new secular bull market. As I wrote in my book, my target is for Dow 100k & FTSE 50k by 2035”
Emily, thank you. Can you look at October 2014 wherein lunar eclipse came before solar eclipse? The high was approximatey 3 TDs before new moon not 4 TDs after.
LizH — for a “crash” to occur — HAS TO BE SOLAR B4 the Lunar eclipse. wasn’t so in 2014 — but in 2015 — YES.
https://www.timeanddate.com/eclipse/list.html?starty=2010
I was able to crudely predict a “crash” 1st week of Aug — was premature by one week. lol https://twitter.com/Eternity100000/status/595957461464420352
tweeted ad nauseam re Puetz Theory :: https://twitter.com/search?f=tweets&vertical=default&q=Puetz%20Theory%20%40eternity100000&src=typd
Have to agree w/Kerry — Puetz Theory doesn’t always work. One guy I discovered way back was at this site …he no longer blogs, unfortunately 🙁 ..he did a study on Puetz Theory ::
http://www.tradersaffiliates.com/CRASH%20OF%202008.htm
hope this helps.
That is probably why Joe called it a false puetz crash but the fade from 9/19/2014 to 10/15/14 was still notable. And….
7/13/2018 solar eclipse
7/27/2018 lunar eclipse
Full moon:
6/28/2018
7/27/2018
Mamma Mia 2 scheduled to be released 7/20/2018. Original movie released 7/18/2008 which was the start of sideways, complacent market action for 2 months before the purge of buyers occurred.
Per Puetz, the order of eclipses does not matter for a crash window, although the general pattern for the crashes is LE after the SE.
Taz
Thanks Liz & Taz … I take screen shots of some posts here & tweet them to my locked accounts for future reference.
As to Puetz Theory ? I already gave the link to his site…but noticed I tweeted in one of my public accounts on Dec 2013 ::
“Steve Puetz discovered that almost all of the largest stock market crashes in history have occurred around the time of a full moon within six weeks before or after a solar eclipse.”
ALSO in Dec 2013 — I RT’d this :
RT @apanalis From 2017 to 2023 Us markets will make a huge spike, european will make only big rebounds, like Nikkei since 1990. ”
…and then comes Luis B Vega whom I discovered in 2011-2012. he’s been on target @ times and many times not BUTTTT he does very interesting stuff. his site now is ::
http://www.postscripts.org
click on BOTH “Triad Essay” + “Triad Chart”
the Blood Moon Triad of 2018-19
http://nebula.wsimg.com/11aa4c9cafa5cbb162b6622f106740dc?AccessKeyId=D40106E1331C24ABD7C3&disposition=0&alloworigin=1
(Essay)
Joe,
You have mentioned the name Arch Crawford…and that he had influenced you in the past. He recommended going 200% short on January 15th. Market was closed Monday so I guess today January 16th is the day. That is in the same window that you have been mentioning. Just wanted you to know.
I do not want to say more but would be interested in any comments you might have. He elaborates on…or at least list all the planetary influences that are occurring chronologically.
Would have worked well for Cryptos that 200% short!
New new endless new high again
so is there a …..:”limit”………….. to how many times a wave can “subdivide”, or is it like numbers, that can theoretically be subdivided to “infinity”………………
https://invst.ly/6cuvp
and 2018 so far in the ES…………https://invst.ly/6cuzb
yes, the equity markets ARE the new bitcoin…………….over 100 ES points in 2 weeks…….
are traders (particularly volatility traders) paying careful attention? searched the web this weekend looking for comments relative to a potentially significant matter that HAS NOT occurred…no one seems to have noticed! will bookmark this post for future reference…?
https://worldcyclesinstitute.com/new-years-resolution/comment-page-2/#comment-25927
https://worldcyclesinstitute.com/new-years-resolution/comment-page-2/#comment-25972
https://worldcyclesinstitute.com/a-pending-top/comment-page-2/#comment-26228
peter,
my posts and charts seem to be disappearing?? ………… did i forget to wear deodorant again??
peter,
ignore that last post…… i saw my previous posts………… just say no to “drugs” people!!!…….
ES update……. down to squiggles…….truly…………
https://invst.ly/6cwnf
smile…………….we have a “close up”………..https://invst.ly/6cwoj
Going long USD via June expiration UUP 23 strike calls for entry price of 0.92 per contract.
Initial tranche of 500 contracts. Buy stop on additional 500 at 1.00, stop loss at 0.75.
This will be my only market position with availabe trading funds. Profit target is 1.25 per contract.
market / vol converge, then diverge
….over???? …………is that a “fork” i seeth?? https://invst.ly/6cwvv
and …..”just” …..like that – presto magic -…..we start counting in the “opposite” direction……………………https://invst.ly/6cxcf
let’s see how it does with this 2795-2790 “support” …
yes, look to the 4’s……………..it is the way……………https://invst.ly/6cxxn
yes Luri, that first layer looks torn or stretched… we’ll see…
interesting, luri — you nailed it in that wave 4
2776-77 area (so far). congrats ! 🙂
https://tvc-invdn-com.akamaized.net/data/tvc_54931bdc7966fecd5e047ce402e073d7.png
#ES_F
Watching VIX with great interest. B bands should expand if we do have a turn. The lemmings of the short volatility cohort will probably all pile on as usual and spike it lower during a second wave bounce. IF we have at the very least some kind of interim top, the risk parity trade will see a spectacular unwind. A new low in VIX and this matket is going higher.
verne,
its much akin to the human life cycle………….eventually one day – will be the “last” day……. ergo, my esteemed “grasshopper”……….one “top” ….. will be the LAST top – that much is certain…….
That indeed is my take. Try as I might, I see no path to an orderly unwind of the freaky short vol debacle. Even a ” normal” correction will force the issue, and the quants are completely delusional talking about only 100 million in exposure. Nevertheless, some very good analysts are counting a third wave top.
……g(l)asshopper……………..
the unwind will be exactly how it will be…………………..if one dam’s up the mountain river………….does not the river, take part of the mountain with it upon the “breaking” of said dam??????
advice – in such times, it is best wear to wading boots………………..
In the case of this particular dam, wise one, my suspicion is that the mountain will be taken not merely in “part”….
Verne,
Me too. Interesting how VIX AND VXX stayed flat last 8 days as market rocketed higher, then rose this am as market up again. I sold my winners of the last week or two this morning, and kept VXX hedge with finger on the trigger.
Verne — I’ve been told by a twitter fellow, FedJeans — to ONLY hyperventilate when $VIX : $VXV > 0.91 — otherwise a non-show. just fibs doing their work.
I ALSO look @ $VVIX b4 I look @ $VIX cause that one always gives clues first b4 $VIX does. hard to explain.
ALSO $VXO ===>> VOLATILITY for $OEX ..it has yet to make a NEW 52wk Low indicating MORE UPSIDE room for $OEX and also $SPX
Much more dispersion, both in sectors and national global markets than we have seen in a while. Will they line up and move higher again… or …
Steve Deppe tweeted re $SPXTR being “overbought” — but then stated:
“The last time $SPXTR was this “overbought” on the monthly chart – it was absolutely “underbought” since it ripped higher over the forward ~4 years.”
I DM’d him mentioning ’96 as being the START of TECH BOOM — and he agreed & DM’d a chart cause it was from my locked account & couldn’t publicly tweet to him.
anyhow — $SPXTR went up until late 2000. I was lucky enough to get into the stock market in mid ’99 but what a surprise come 2000. brutal reality.
anyhow — I would keep that INDICATOR ( $SPXTR ) in mind.
…and speaking of the TECH BOOM ?? from 1996 – 2000 ? didn’t realize $NDX Futures started trading 04-10-99 ( http://www.magiastrology.com/index.php – go to “First trade dates… :: http://www.magiastrology.com/firsttradedate/freefirsttradedates.php } … did a “Search Twitter” w/one of my public accounts & added “1996” …take a look also at the Atkinson tweets I did re GOLD prices. when tech boom started — gold prices retreated. seems familiar ? cause nowadays seems GOLD prices being replaced by BITCOIN / CRIPTO currencies … that’s MY take. wished I wasn’t so damn obsessed w/MINING (#clue way back then that GOLD taken down while CRYPTO taken up ) — “mining” being the OPERATIVE WORD for Bitcoin. should have just bought the darn thing instead in 2010/11. 🙁
https://twitter.com/search?q=%40eternity100000%201996&src=typd
https://twitter.com/search?q=%40eternity100000%201996&src=typd
LUNAR PHASES ( Here are the listings of lunar phases including the dates, times and astrological positions.)
http://www.sarahsastrology.com/lunar-phases
ok.. posted enough.
Emily,
If you include more than two links, you’re going to get tagged by the system and then I have to step in and manually OK the comment, which may take awhile. Just a head’s up.
lol… ok, Peter ! thanks ! 🙂
Gap area so far providing support. In keeping with my personal view of the nature of the coming reversal, what I am seeing does not fit the bill. This is probably a fourth wave of some kind…
The reversal will announce itself with with stentorian authority.
In my humble opinion, failure to immediately fill the open gap on the initial move down was a huge tell…we are not quite done…
I think “correct” for a few reasons. Not the right look, too many waves, wanna see a double top (he whined). This was a really good shot across the bow, though.
I may have spoken too soon. This latest drop changes things.
perhaps i should call in the “expectations police”???
i think your expectations of a a hard price reversal is unrealistic. I think the initial moves off the top will be “exactly” as we are seeing…………..that is, business a usual and a “walk down” look……………………………….
only an “EVENT” will rip this market clear of manipulations – so we should expect just that over the next few days to a week – ………………we should expect an “event”………………………..then, and only then…………..will prices behave in a manner in which you are suggesting………………….
[cough]…………………………………………..ahem…………………..and you say???
SQQQ such a pretty hammer on the daily chart.
verne –
we are “blind” as to the sheer size of the FED’s ……..”short volatility” portfolio. They are price agnostic…………………….thus we need ………………..’an event’……..
Absolutely. I really do have to smile when folk quote this or that FED public or published report, as if one can trust anything these international criminals tell us.
RUT putting in a bearish engulfing candle above the upper B band.
There was a time when this would have been the mother of all reversal signals but with this market one never knows.
I have recently seen price completely ignore a huge bearish engulfing candle and storm to new highs the very next session. We shall see…!
verne,
have you failed to see my short term ES charts ……………….i counted the “squiggles” verne……………………………………………. “THE SQUIGGLES”……
:-)) which means those subwave 4 levels i mentioned should be magnet points for the market….this will be a subtle “tell”…………..
…………..aaaand…………….https://invst.ly/6c-1i
I’ve been noting Luri, thanxxx for pointing it out! VIX 12 should be noticed… or sold down…
I never thought they would ever let VIX get anywhere near the 12.00 pivot. Even more strange, it does not look as if they are even attempting to smash it….
mighty kind of you to mention mike…………. thanks……………
and that vix thingy…………………….. cat’s out of the “bag” as to the FED’S illegal and massive “short vix” portfolio – thanks to the next fed chairman “powell”………………….
any move to hammer that vix back down – now focuses all the attention towards the fed’s portfolio…………….an unwelcomed spotlight that they will ‘avoid’ moving forward…………………..
I almost wish we would see some attempt to beat it down. I have to say the absence of even the feeblest attempt I find somewhat suspicious. This has been the predictable pattern for years so what’s different???!!!
It depends on one’s thesis on the denoument of this market’s ultimate demise.
Some contend that it will be bankster engineered, in which case while they might execute it in some kind of stealth fashion, I am inclined to think they will “pull the rug” so to speak, if that is the way it unfolds.
The other is of course the “Black Swan”, as per the Nassim Taleb postulate, and that will be definitely sudden and fit with your “event” theory.
Bottom line? Even if you think the one scenario in which the crack-up will come, viz. courtesy of bankster shenanigans, there is STILL a chance it could happen with suddeness, whether forcibly or voluntarily…just because they attempt to sneak out the back door does not necessarily mean their departure will go un-noticed!
think there will be some selling when the Asian and Australian stock markets open? how about the European stock markets? they went home on Tuesday, January 16, 2018, feeling warm and fuzzy…just a thought!
https://www.worldtimezone.com/markets24.php
Australia (EWA), Germany (EWD), plus GXC, PIN, RSX, XLK, XLE, XLI, XLB reacting….
https://www.investing.com/indices/indices-futures
rotrot — thanks for sharing that link w/us. interesting one. haven’t seen that one b4.
https://www.worldtimezone.com/markets24.php
I also previously mentioned the rarity of synchronous VIX and market gaps up at the open, similar to the three white soldiers reversal pattern we saw in VIX several weeks ago. The problem is while these are clearly red flags, none of us have any idea regarding the time frame when we should expect to see the warnings actually affect market price. The kind of talk I have been hearing lately about where the market is going, as well as the reasons being cited for the certitude of these viewpoints, is nothing short of breath-taking. I must confess I sometimes find myself wondering out loud: “Am I the lunatic??!!” 🙂
………………..you are pure …………………batsh*t crazy………….verne……………..welcome to the club! …………today happens to be our “potluck” lunch………… did you bring the pot??/………………………..or are your bringing the luck??………… :-))
Not only am I prepared to bring the pot, luri, I’ve got my apron and am all set to tackle the cooking! 🙂
I am prepared to modify my expectation per the point luri made (see? I can be flexible!)
If price takes out the gap from the close on Jan eleven I will take back that caveat with a smile. That price level is 2767.56.
you mean that “subwave” 4 level i had marked on that ES chart…… waaahooo!!
be prepared to “alter” your universe …………………….you brilliant “julia childs” you!!!
Oooh! Now you’ve done it! ( in my best Julia voice!) 😀
https://invst.ly/6c-fu
Funny! I hate Oprah’s resistance….. to dounuts 😉
Speaking of resistance, here comes the VIX short cohort. The 12.50 pivot seems to be their new line in the sand. If we go above that, and CLOSE, there is going to be PAIN…! That would in my view be YUGE.
One of the zero hedge articles talk about that initial failure to beat price down being a sing that the worm had possibly turned..
Price finding support just above Jan 11 gap at 2768.64
The next move down needs to demolish that gap to make me a believer, and preferably BEFORE the close…
Market volume hinting at massive distribution today. Wow!
Odds are very high that a top is in place. EW methodology requires a second wave and then a new low before I can call a top,
This all looks textbook to me, except that first waves (like this one) aren’t covered in “the book,” as I wrote last week.
Peter have you considered actually publishing your compendium of errors that you have discovered in the “book” ?
I carefully wrote down that article and have been spending some time studying it.
I suspect few traders realize how valuable that kind of information, learned in the trenches, actually is. It is extremely generous of you to offer it freely imho…
I’ve been working on a course and could very easily turn that into a book. I think I would need to go the full nine yards, as just this info on it’s own would only find an extremely small audience. And there’s much more to share in terms of fib relationships. What I shared last week was only the major errors in the book. There’s a lot more that I’ve learned along the way. Tks.
If you offer the course as a webinar please be sure to post the event…thks.
No, the course is much bigger than a webinar. It has multiple chapters and is layered by complexity. In other words, the basics first and then there are advanced modules, because it’s a lot to take in. It’s also organized so that you can use it as a reference over time. Now that the tide has turned, I should get the time to finish it. The analysis of this market over the past several months has been extremely time consuming. Weekend updates have been taking most of my weekends.
I have been to a few week long events! 🙂
100% Agree.
we are now 1 month before the solar eclipse
This is a prime time for a high .
If we did indeed top we should see a choppy down
Market into the solar eclipse
Waning Crescent Moon
The moon is currently in Sagittarius
The moon is 27 days old
Why choppy and not impulsive?
I would have interpreted choppy as probably corrective.
We can see a strep retrace yet the preferred direction as I see it is down
What I would like to see is either a slight poke below last week’s low or just a test
Of last week’s low ( calling it blind since I’m away from home )
I can except an inside weekly bar yet next week would need to break down.
Calling this in trading days with out dates .
5 days down ( this week should be down each day with lower lows ) a gap up next Monday
And more choppy range bound moves yet lower lows .
15 trade days including Monday should be a counter swing high .Jan 31-Feb 2 is textbook for a swing high
Before a very strong define . I’ll give it Jan 26- Feb 2 .
From now till then essentially a sideways movement yet a sloppy downtrend .
The next 20-25 trade days a sloppy downtrend .
I would not rule out a new all time high if it happened Tuesday .
Yet after Tuesday ( tomorrow ) I would not want to see that happen.
54-62% retrace is my spot to get short . I would expect price to hang around
And tease , leaving traders hesitant to get short ( would be perfect )
Yet 10 trade days down. 5 trade days up and 5 trade days down then 10 trade days up
Is also textbook in this cycle ( 20 trade days down over all with 10 trade days up )
The 30 trade day mark should surround a full moon . Short that full moon and hold
For roughly 14 trade days into the new moon .
Counts begin from and include Monday’s bar.
39-41 trade days from Monday should be a swing low and surround the new moon .
I’ll need to update my chart to align it yet that is the textbook set up if we topped .
Additionally : you create a range by using the print high and the print low of the first
10 trade days ( if we topped I include Monday’s print high and next week’s print low )
Bottom line : the door is open and all I need to see is 10 trading days to define the range .
Breaking out of the range is where the big move comes .
If this sounds confusing , sorry it’s the best I can do.
We are most likely topped but I would be careful Tuesday .
The big move down won’t come for a few weeks .
It takes time for people’s mindsets to change from euphoria to paranoia
To slight fear and then panic .
Expect sideways to down but keep in mind it’s going to be choppy .
I won’t be back home until Saturday so I can’t explain it any better than I did .
Joe,
If the top is in, it definitely won’t be choppy.
Peter T – is it possible that what Joe is referring to could be a series of 1s and 2s and hence look choppy before finally moving lower in a 3rd wave down ? And on that suggestion from Verne about writing a book – Please do it. Existing books are not water tight when it comes to implementing rules – and that can lead to incorrect conclusion about the method itself.
I don’t know what Joe is referring to, and I don’t want to put words in his mouth. The book … so much to do. Once we get this bear market established, I won’t be around much during the day.
🙂
Thks, Vik
Thanks for the detailed update Joe
From what i can understand i think you are intimating exactly what happened in 2015 with the nasdaq when it fell for the first time in July and declined circa 16-17%
The first 7-8 trading days were down around 4% then a near perfect retrace of 62% in the next 7-8 trading days before a lower low followed by some choppy action sideways for around another 7-8 trading days before we flushed heavily lower for yes you guessed it 7 trading days to the bottom
Thew total decline was 30 trading days(futures trading days included so this includes Sundays pre market)
Am i correct this is roughly what you see Joe?
Thanks in advance
On a side not Thank you peter for keeping the blog open to chat/discussions i think it has real value and we all appreciate your hard work running this!
Verne
It’s the nature of the cycle we are in.
It tends to begin choppy and sloppy and range bound .
I’ll stick to my above post until the market proves me wrong .
I have followed this cycle twice a year for over a decade if it
Decides to do something different I’ll post I am wrong otherwise
I’ll stick with the typical .
Thanks Joe. A choppy price action would certainly be misdirection for a lot of traders.
I have been trying to keep and open mind to all the analysts insisting that we are topping a third wave of some sort, but I have to say, the kind of foaming at the mouth bullish talk I am seeing everywhere does give one pause. We now have someone over at zero hedge who is wondering of the dip yesterday was the last opportunity to go long. This is due, you see, to all the banks and sovereign wealth funds who are relentlessly buying the market, and who it seems will continue to do so in perpetuity. He opines that this fact alone is far more powerful than Q.E., ergo we are going to the moon! etc. etc.
Nothing new under the Sun…
I have done further research on this cycle going back
90 years. It’s one of my favs
Peter
I certainly hope the wave count is clean yet for many
I’d expect them to consider this a wave 4 of sorts just as prechter once did . 🙂
Short the Aussie SPI. See how we go tonight. Off to bed.
Call me old fashioned. I was taught that gaps at the open represent folk buying the market at the open AT THE ASK!!
I understand the charts are bullish.
I understand we do not yet have meaningful market divergence.
Still, I do have to ask what kind of mentality jumps in to buy the market at the ask with VIX heading straight up??
Has the level of arrogance of market participants now reached the point where the perception of market risk is that it does not exist?
There is an article on zero hedge musing about whether the decline yesterday was the last opportunity to get long. They are contending that with all the banks and sovereign wealth fund buying, like SNB and the Norway SWF,( and they are right about those two!), the effect will be even more powerful than Q.E.
Makes you wonder does it not? ?
of some interest ? came across it in 2013 ::
http://www.cycleprooutlook.com/Charts/SP500/uct1950-2050.jpg
also if you haven’t followed him so far… suggest you do so..he does follow moon phases (for those who are interested):
Francis Bussiere
@AstroCycle_Net
Following Following @AstroCycle_Net
More
Sorry, my brain is coming off a nasty cold, IT WAS #SPX 2793 and 2810, ignore my tweet about 1793 and 1810. The New Moon high came in at 2807 vs the ideal 2810, next date and level to watch are Jan 19-22nd and 2730, then Jan 29-31st for the VIX 3.5 week cycle and Full Moon.
2:37 PM – 16 Jan 2018
Am watching my 3 amigos –>> $FVX $TNX $TYX (only $TYX is sporting rouge colour) along w/ $BPSPX which is up .20 @ 82.00 still in uptrend, along w/ $TRIN which hit earlier > 1.60 to the 2.37 — opened @ 2.26 — indicating RALLY ( at times same day / next day/2 — depending where it closes IF @/> 1.60 )
$SPLV which I used for last couple of years to DAILY guide me re $SPX — but beginning of this year — decoupled itself…but am still watching it. I use DeMark calculator — the S1 = sell trigger & R1 = BUY trigger. kinda archaic to most — but it has kept me out of trouble on daily basis. https://www.tradeviewforex.com/demarks-pivots.php
so far today — SPLV has the BUY trigger of R1 = 47.995 — butttt $SPX 2791.98 hasn’t triggered yet…don’t know if it will today/tomorrow (?) cause SPLV as I stated b4 decoupled earlier this year from SPX..so just watching. but the other indicators still working (so far).
guess MY $SPLV is back in the saddle again. lol… along w/ $TRIN
SPX now > DeMark R1 of 2791.98 @ 2,793.62 +17.20 +0.62%
could be wrong …but methinks $SPX headed for yesterday’s Open of 2798.96 area or as the Cheat Sheet states :: 2,798.89 3-10 Day MACD Oscillator Stalls
https://www.barchart.com/stocks/quotes/$SPX/cheat-sheet
could also go w/Advanced Camarilla calculator :: http://www.pivottrading.co.in/pages/advancedCamarilla.php
the..
Go Short was @ 2787.12
Long B/O ‘s @ 2797.82
Tgt 1@ 2806.63
Tgt 2 @ 2815.43
we shalll see. so far SPX @ 2796.88
If my math is right this looks to be an ideal place to finish wave 2 and turn into a wave 3 on SPX. I think were at that .618 retracement…
top of 1/14-15 resistance now…
throw over?
could be wrong …but methinks $SPX headed for yesterday’s Open of 2798.96 area or as the Cheat Sheet states :: 2,798.89 3-10 Day MACD Oscillator Stalls
https://www.barchart.com/stocks/quotes/$SPX/cheat-sheet
could also go w/Advanced Camarilla calculator :: http://www.pivottrading.co.in/pages/advancedCamarilla.php
the..
Go Short was @ 2787.12
Long B/O ‘s @ 2797.82
Tgt 1@ 2806.63
Tgt 2 @ 2815.43
we shalll see. so far SPX @ 2796.88
ok.. bingo — $SPX did hit 2798 area @ 2,798.62 & $SPLV is damn strong. the spike in $TRIN > 1.60 OVER 2.00 indicates to me, at least — that RALLY still not over.
I follow BOND guy Fitzstock2004 where in Dec 2016 he mentioned SPX 2700 — so then I did some crude math & came up w/
1810.11 x 1.50 )= 2715.165 which didn’t pan out by end of 2017 — but did 1st week of January + some.
now he has 2900 for February. possible cause if Steve Deppe has 3100 by January 19, 2019 of next year. why not 2900 ? but methinks most likely by March 21 #GANN New Year. could be wrong & its around Feb 5 / 19th ?
on another note. don’t know if anyone of you know that your Twitter DMs are NOT private at all…not that its a surprise. anything in cyberspace can be hacked. I got hacked by the DNC in 2003 …so am sore as hell. lol anyhow — this dude I’ve just followed him this week: https://twitter.com/JamesOKeefeIII – he went undercover & exposed Twitter employees & management. the MSM (mainstream media) as usual don’t do any investigative work…so not covered by them at all.
I could be incorrect, but I do not believe this bear market will begin until and unless we get an initial impulse down that is of sufficient magnitude to force unwind of leveraged longs and an initial short vol capitulation. I expect it will fill several open gaps, and will leave no doubt in any but the dullest minds that something has changed. I still expect the futures market to be the place it begins so patiently await evidence of same…
Yep, I don’t see any reason to front run anything right now.
VXX went right up to 1/2 resistance yesterday, tested it again first thing today, then dropped to 1/10 support. Watching for SPX breakout or VXX rebound.
Peter, every time I get out I have to log back in and send a comment so I can see current chat. Am I missing something ?
I’m not sure what you’re describing. Try emptying your cache.
refresh on toolbar
Same here. VIX printing an interesting looking candle. Monster upper wick but price holding above upper B band.
Here are some interesting mental fib signposts I have been contemplating:
From the 2009 low, I get 3037 for 2.618, and from the 2016 low 2991.
I wanted to consider what might be driving some of the more outlandish targets I have been reading about and in a spirit of open-mindedness, even though I disagree: 2009 low to July 2011 high is 689.69 points .
Multiply that by 2.618 = 1805.61 and add that to the Feb 2016 low of 1810.10=3615.71
These were targets shared by two individuals I know who have quite differing views on how high we can go.
We are almost already past my highest target of 2810, so I am going to have to do some serious re-tooling if keep going much higher
Verne ? do you follow wave genius dude on Twitter ? he does Elliott wave
just caught one of his tweets & went to his site where he touts 2900 coming now.
http://wavegenius.com/208pm-spx-and-compq-both-broke-786-retracements/
“SPX just broke .786 of the C wave and NASDAQ is there or within a couple points of breaking it…this move sets up a W3 to as high as 2900 for SPX”
Test
came across this one in 2015 .. all Fibonacci & Astro predictions:
DOW, 2018, 2021, the year of the Ox
May 4, 2013 Posted in Articles
http://web.archive.org/web/20170313020555/http://www.thedailytick.com/dow-2018-2021-the-year-of-the-ox/
had to go thru waybackmachine.org site to get the above
on this Pivot Point calculator you get to see where some are touting 2900 coming ..soon 😉
$SPX
https://www.pivotpointcalculator.com
use yesterday’s data & you’ll see 2900.90 on R4
The Metonic Cycle is 6939Cd’s or 235 synodic months.
https://en.wikipedia.org/wiki/Metonic_cycle
Back on January 1999, the full moon was on 31/1/99, a Sunday. So the closest trading date in January was Friday 29/1/99. That Friday’s high was 1288.5.
17 squares higher is 2797.9 and 18 is 2904.
6939CD’s from this start date is 28/1/2018. However, the full moon and the total lunar eclipse are on 31/1..
Taking the high on 19/5/2015 to the low on 11/2/2016 gives me a TD square CIT date of 27/1/2018. Target prices are either 2795 and 2903, which is where Uranus sits and very close to the Sun x 2 angle from the 9/11/16 low. Given the previous squaring merely stalled the rally for a day I’m looking at higher prices.
No emily I don’t. To be honest, I don’t even have a twitter account!
Thanks for that daily tick link on the fib and Benner targets for DJI – a fascinating read. A 2021 low suggests some huge time (and probably distance) impulsive waves if we get a turn here in 2018. Of course, we course, a possible third wave down could complete prior with a fourth and fifth wave going into 2021.
This website is for educational purposes relating to Elliott Wave and natural cycles. I welcome questions or input about Elliott Wave, cycles analysis, or astrological input relating to any market. Due to a heavy schedule, I may not have the time to answer questions that relate to my area of expertise.
I reserve the right to remove any comment that is deemed negative, disparages the Elliott Wave Principle, is otherwise not helpful to blog members, or is off-topic. Posting trade specifics does NOT serve an educational purpose, is stongly discouraged, and such comments may be removed.
Want to comment? You need to be logged in to comment. You can register here.