
This week, we should see the top of the 500 year bull rally. Sentiment is at 93% bulls, which is rivalling the top of the dotcom bubble. All the assets I cover are at major inflection points. The dollar is about to turn or has turned. Oil is about the top. Gold is headed down.
Oops! Tesla
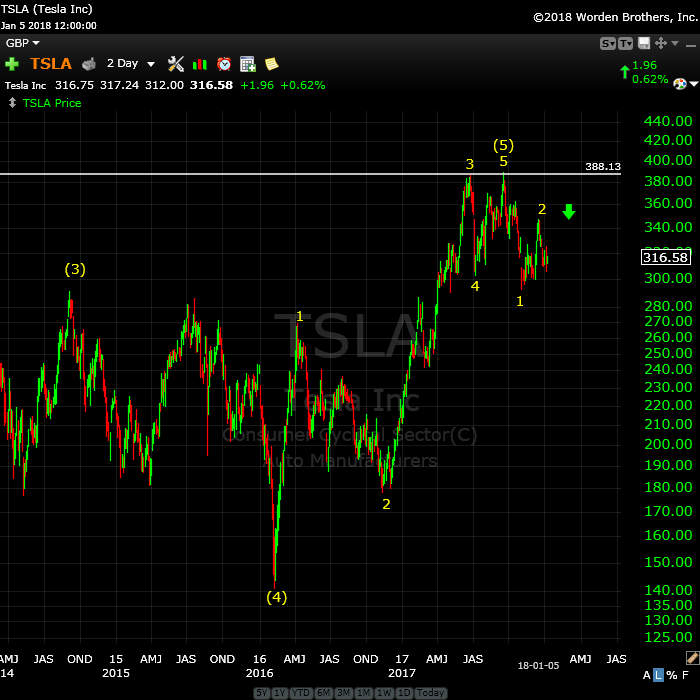
Above is the 2 day chart of Tesla.
Time to think about bidding “adieu” to Elon. Things have not been going well lately, and they’re about to get a whole lost worse.
Tesla has topped. It’s completed one wave down, along with a second wave. It’s now arguably in a third wave (arguably, because often in bear markets, you get a double-pronged second wave. So we may head about up to 347.44 for a final kiss good-bye!!
__________________________
My Original Intent in Starting This Blog
When I began this free blog, it was for the purpose of helping people understand the power of Elliott Wave Theory to lower risk in trading any market, based up its ability to predict market movement to a higher degree than any other tool that I’ve been able to find. I believe that Ralph Elliott discovered the secret to the market that it takes an astute analyst to unlock.
I believe it should be classified as a science because in the tens of thousands of hours that I’ve spent studying it, I haven’t found it to fail. The analyst can fail in interpreting the signals, but the science remains accurate, churning out wave after wave, day after day, to a specific set of rules.
In all my writing over the past two years, the hours I spend on analysis each weekend, and my attention to detail in explaining these charts and market direction each and every week, I have failed to make a dent in the perception of Elliott’s very important work.
I’ve tried very hard and failed. So, I’ll shut down the comments area next weekend, unless someone can come up with a benefit to keeping it alive from an educational perspective. I’ll explain my position in more depth below.
I’m also providing a list an explanation of some of the inadequacies and errors I’ve discovered in the “Elliott Wave Principle” book, by Prechter and Frost.
Other People’s Kids
In my endeavour to create a constructive environment to discuss EW and cycles, I’ve had to act a policeman for internal fights, spreading of proprietary information, and spreading of misinformation about Elliott Wave. It’s this last aspect that I vehemently object to. Mr. Elliott has been slammed enough and it’s kinda hard for him to defend himself in his current condition.
So, this week, we have Dan charging on here believing he has the right to command the audience I’ve built with his predictions that are neither possible, nor backed up by any evidence whatsoever. While I’ve written extensively about this wave up from 2009 being corrective, and the fact that one has to look at the market as a whole to determine its direction, he’s stolen the narrative with one single, completely unsupported comment.
Others have decided that this opinion is worthy of consideration, if fact, perhaps the operative scenario. It flies in the face of everything I’ve posted to the contrary over the past couple of years.
The inference is that I’m either stupid, incompetent, or have little to no understanding of the finer aspects of Mr. Elliott’s work. Maybe that’s true. But at the very least, it’s extremely rude. It shows no regard for me and my work, and without a shred of evidence to back up these statements, or even the a suggestion that these little morsels may be opinion only, borders on maliciousness.
I’ve had enough.
The challenge I’ve had in spreading the EW “word,” of course, is the accessibility of the knowledge, which has been helped and hindered, both at the same time, by the book, “The Elliott Wave Principle.” Unfortunately, it contains a number of errors that have led to the discounting of the scienfitic aspects of Elliott’s work. Chart examples in the book are invalid, for example. The most obvious example is a chart of an ending diagonal that is not an ending diagonal at all, because it breaks the most important rule in determining one. I expose this example below.
The error in this chart was so obvious when I read the book, that it led me to research all the other chart examples (charts pulled right from the market). What I discovered was that most of the examples were invalid.
Two charts in the book that are to provide evidence of a truncation are invalid. Neither one is a truncation. You’ll also find this example below.
So I’m fighting an uphill battle. Thanks to Dan and others, this challenge has become insurmountable, in my humble opinion. There’s simply too much erroneous information about Elliott Wave for me to overcome. I do not have the time nor desire to combat this uneducated blather any longer.
And now we have a final wave up from 2009, engineered by central banks, that’s clearly a B wave. That’s a problem for the integrity of the book, because Mr. Elliott was adamant that B waves at the top of a market exist (an irregular top). Bob Prechter decided to change this aspect of Elliott’s theory.
Mr. Prechter has solved this problem in recent charting by ignoring certain waves. Of course, you can’t do that, but ironically enough, that’s a trait of this cycle top (based upon the work on Dr. Raymond Wheeler, whose work I’ve cited over and over again). It’s an age of terrible grammar, and fake news. This extends to science, of course; we have global warming and the ozone scam as great examples of this phenomenon.
Sloppiness is normal at the top of this cycle (where we are right now), so I can’t expect anything different, I suppose. But that doesn’t mean I have to accept it.
The B Wave (that others are trying to make into an implusive wave)
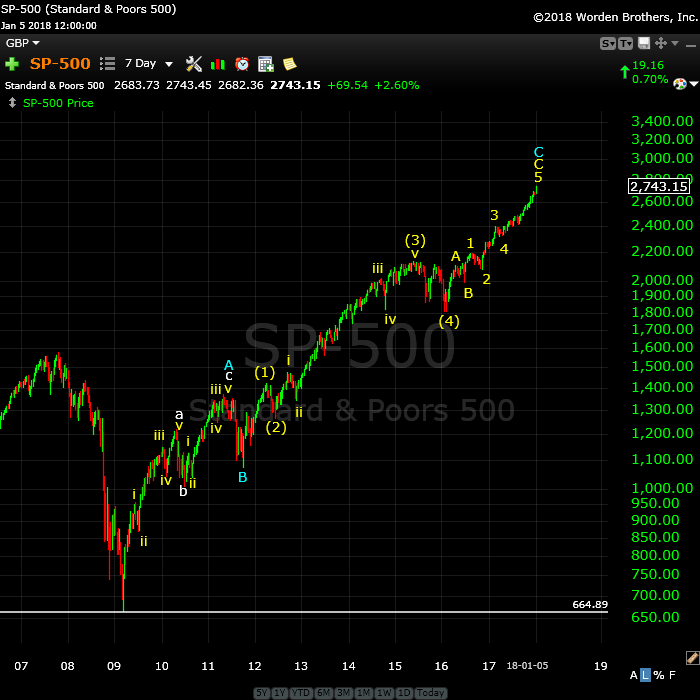
Above is a 7 day chart of the SP500 showing the final wave up from 2009, which I have referred to in previous posts as a B wave, contrary to Prechter’s assertion (which was contrary to Elliott’s original work) that a market top cannot end in a B wave. Oops!
However, to alleviate that problem, Bob has posted a chart in the most recent version of his publication, The Theorist, that ignores some waves, which of course, you’re not supposed to do. Thanks, Bob! That really helps the cause.
Unfortunately, based upon Mr. Elliott’s hard rules, I can find no other explanation for the above wave sequence other than it’s a B wave, because it breaks many of the rules and guidelines of impulsive waves.
However, for all those who disagree, here’s a test:
The Motive Wave Quiz
This little test is primarily for our guru, Dan, who believes this wave up is impulsive. He obviously knows better than me. But I’ll open it up to anyone. I’ve posited a short set of questions, but can certainly provide more.
- An impulsive sequence requires a valid second wave that retraces 62%. Please identify it.
- An impulsive squence requires a valid fourth wave that retraces 38% of waves 1, 2, and 3 of that sequence. Please identify it.
- The most important element that both Prechter and Elliott noted is that an impulsive wave must have “the right look.” How does this wave up, which has a corrective look to me, fall under the category of “impulsive, based upon its “look?”
- How is it that none of the waves in this sequence fit the required fibonacci wave relationships, but is still considered “impulsive.”
- How is it that this wave up, if considered to be impulsive, has more waves than a normal impulsive sequence? If you have an explanation for this impulsive anomaly, please provide your count in a posted chart somewhere.
_________________________
The Elliott Wave Principle Book (the errors)
 In the process of building on the work of Ralph Nelson Elliott and the interpretation of his work provided by Robert Prechter and A.J. Frost, my research has uncovered a lot of errors and omissions in “The Elliott Wave Principle” book. I would assume that any good EW analyst has done much of the same work. Or do they believe everything they read?
I’ve decided to provide my findings as a lead-in to a comprehensive course I’m developing. I’m providing it here as an example of the erroneous information that’s out there, to support my comments that the tools many EW analysts are rather “dull” and this is the reason for all the EW misinformation and counts that are simply incorrect.
I came to Elliott Wave Theory through Robert Prechter and his EWI site. After over a year as a subscriber, I became so dismayed with the continual errors of his analysts, that I determined to take a few years, devote myself to the market and the EW principle, with a goal of eventually excelling in its use. I discovered so much more in the process than has been written by either Prechter or Elliott (and several gross errors in the Prechter/Frost publication).
But I’m only expanding on their work; I’m not doing anything extraordinarily ground-breaking. My belief it that the work I’m done solidifies the principle and maybe, just maybe, it will help others in their analysis.
I’m convinced that Elliott’s description of the movement of the market should be considered a science. The reason the Elliotticians waver in their analysis is because of the errors in the Elliott Wave Principle, most of them due to the additions, or changes to Elliott’s original work, done without proper research.
Here are a few examples (all the charts expand when you click on them):
Ending Diagonals
There are two examples of ending diagonals in the book, one totally invalid.
The first example (p.39, fig 1-18) isn’t even an ending diagonal, and it’s glaringly obvious as to why. One of the key determinants of ending diagonals is that the fourth wave must intersect the area of the first wave; they must overlap.
In this example, they don’t. End of story.
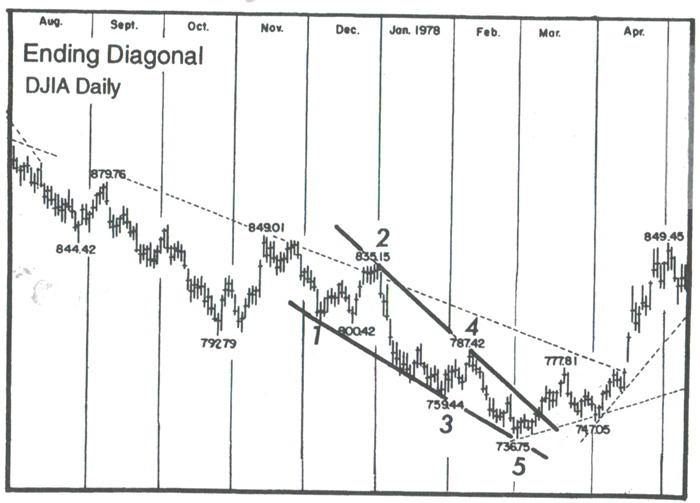
The second example (p. 38, fig. 1-17) is a valid example of an ending diagonal. However, one of the defining tests is that it must be in a fifth wave, in this case above the fourth wave. However, the trendlines drawn suggest that the fourth wave is part of the ending diagonal. It cannot be, based upon very definition of an ending diagonal.
A fourth wave triangle has the fourth wave as part of the triangle (it forms the A wave, in fact)—an ending diagonal does not.
An ending diagonal starts with the first wave of the diagonal. The lower trendline should begin on wave ii and contain wave iv.
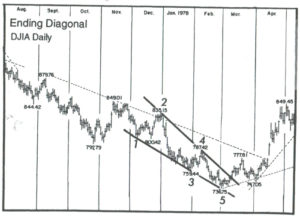
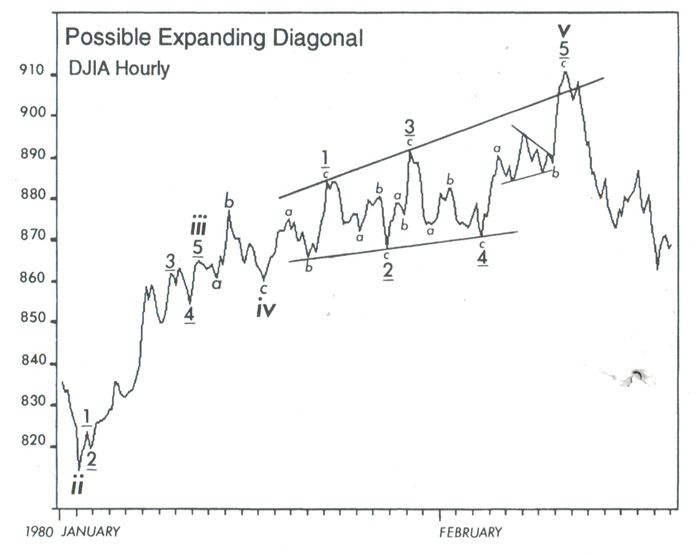 An expanding ending diagonal is a Robert Prechter invention (added to Elliott’s work). However, nobody has ever seen one. All we have is a line drawing in the book and it’s shown to the left (p. 39, fig. 39)
When I went to the original source, which is a DJIA hourly chart from early 1980, I found that the position of this pattern within the larger structure didn’t support the supposition that this existence of this pattern is remarkable, important in any way, or even repeatable.
It’s at the top of a B wave in a continuing corrective pattern. Ending diagonals are supposed to be in C waves, or most importantly, fifth waves of an otherwise impulsive pattern. This one is not.
Below is a chart pulled from the DJIA showing the above example in its original habitat.
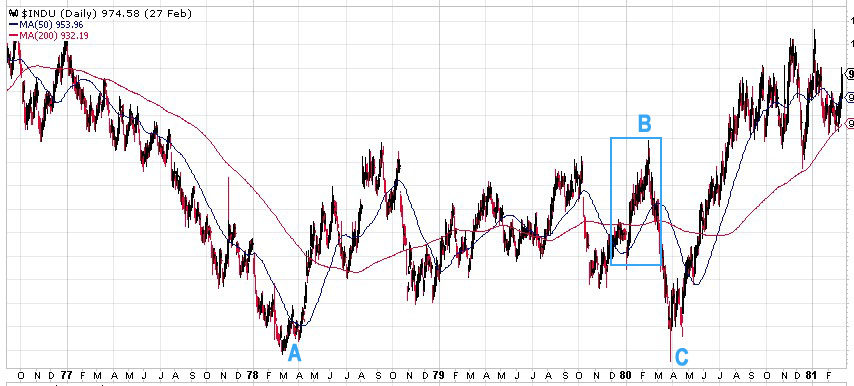
Above is a daily chart of DJIA showing the position of the supposed ending expanding diagonal. It’s at the top of a B wave in a large bearish correction. What value this has is completely beyond me. It’s not even interesting.
_______________________
Leading diagonals
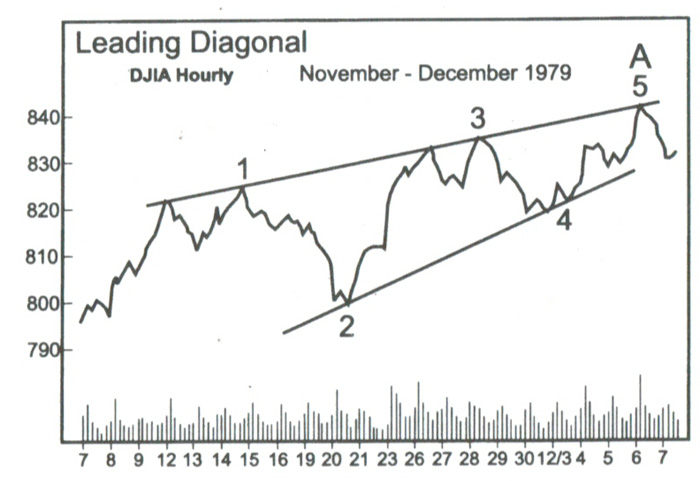
Here’s another “ghost of charts past.” There has not been a valid chart presented to support this pattern anywhere that I can find. It was a Prechter addition to Elliott’s work.
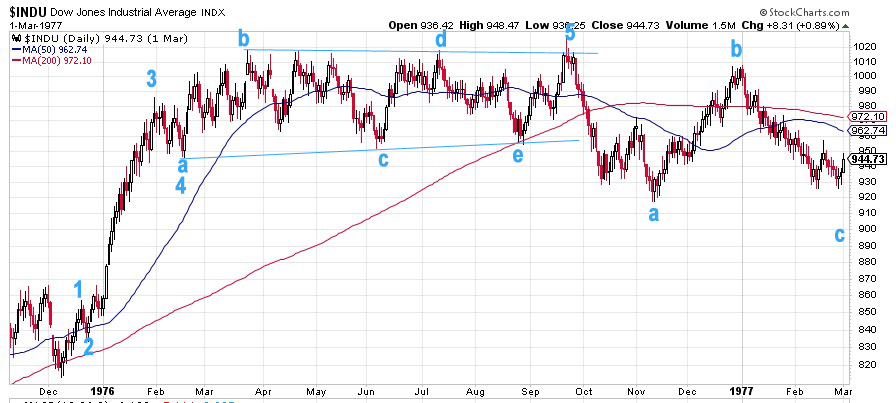
The only example we have is in the book and it comes from the DJIA hourly chart in 1979 (p. 40, fig. 40)
Let’s look at where this leading diagonal originally existed, by taking a look at the original chart, but over a longer period of time.
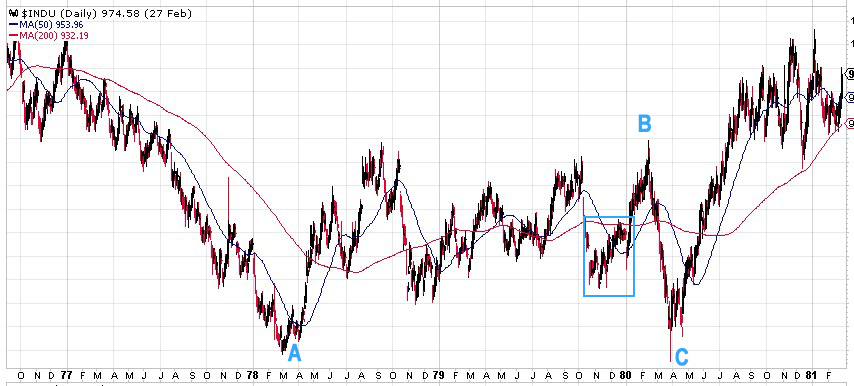
Above is a daily chart of DJIA. It’s actually the same chart from the ending expanding diagonal idea described above. So, what we have is an example of a leading diagonal and an ending expanding diagonal in the same corrective B wave. That’s quite a wave, just chocked full of diagonals! And it’s a B wave, a place where diagonals are very unlikely to appear.
Even if this was a repeatable pattern, providing an example in a corrective B wave is hardly an example that is likely to have any effect on the count. It certainly doesn’t here. It’s at most an odd pattern that’s not particularly interesting, and is of little practical value, imho.
Outside of this questionable example, nobody else has ever seen one.
__________________________
Truncations
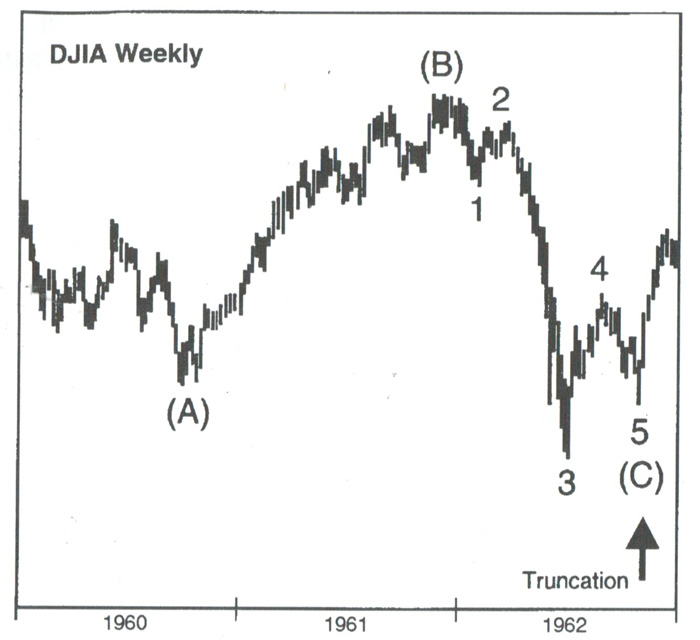
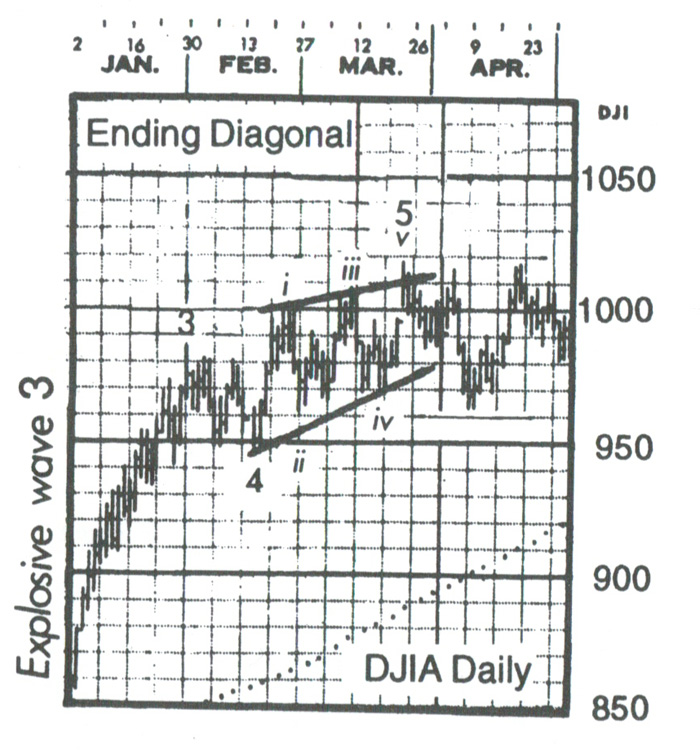
Nobody has ever seen one. The example charts in the book on this subject are invalid. The example on the left is a three-wave, fourth wave of a sequence, mislabelled in the chart to the left (p. 36, fig. 1-13).
It looks good here, but if you look at the bigger picture, it makes no sense. The chart below tells the real story.
It’s really an odd example, because it’s an ABC structure, which is a corrective wave. The C wave down already has a small fifth wave within it, and the overall look is consistent with a normal C wave.
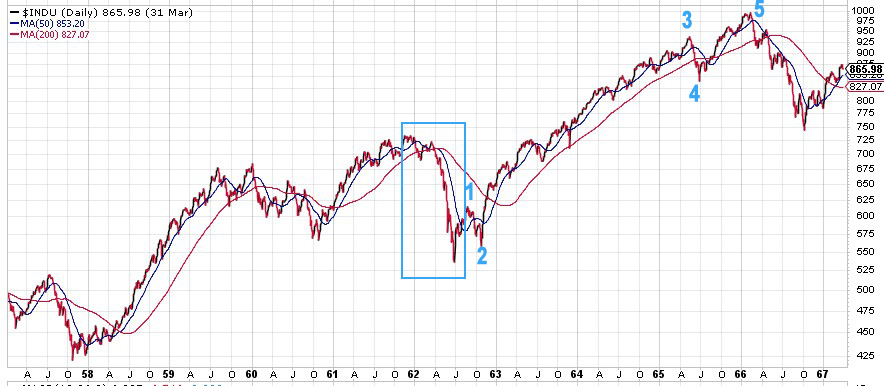
Above is a daily chart of the DJIA showing the “truncation” example above in its natural habitat—in a bullish third wave sequence, surrounded by impulsive waves, it’s simply a small fourth wave correction, not a truncation of anything. As such, it’s supposed to be in three waves!
Truncation Example #2
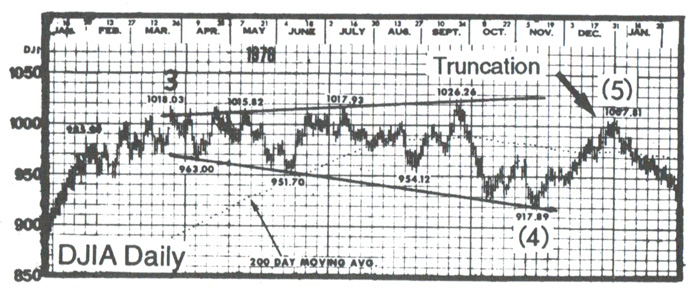
Above is the second example of a truncation from the book (p.36, fig 1-14).
Here’s the same chart labelled properly – another daily chart of DJIA. This wave up from December, 1975 is an impulsive wave with a simple contracting triangle as a fourth wave (abcde), with a small 5th wave up to a final high. I have no idea what they were thinking when they labelled it the first time. If it’s a truncation you’re suggesting as a result of your analysis, it seems to me (as Mr. Prechter states in the book) that all other options should be exhausted. He apparently didn’t heed his own advice.
Bob Prechter, in his writings, has expressed a desire that EW Theory be classified as a science. However, his adoption of this truncation “anomaly” certainly doesn’t support this desire. You can’t have a valid scientific theory that fails periodically. After going back a hundred years in the DOW, I can’t find a single occurrence of a truncation either at market highs or lows.
As far as I’m concerned, truncations don’t exist; nobody has ever seen one.
_______________________
Inadequacies in the book
Here are some areas in which the information in the book is not complete, imho:
Second Waves. Second waves in an impulsive pattern must retrace 62%, based upon my experience. I’ve cited this several times over the past two years and it has yet to fail. This fact is often the difference as to whether analysts are correct in their calls, imho. In Prechter’s book, the requirement is that they only have to retrace 38%, which has caused analysts to be wrong over and over again.
Fibonacci Ratios. The role of fibonacci ratios in both corrective and impulsive markets is woefully incomplete in the book and, in my work, has time and again proven the most important factor in determining both wave end-targets and whether a structure is corrective, or not.
Third waves of an impulsive sequence are almost always (I haven’t found an exception yet) 1.618 or 2.618 (in an extension) times the length of the first wave. Fifth waves are typically 1.618 X the length of the first wave. They can extend to 2.618 times the length of the first wave, but this is rare.
First Waves
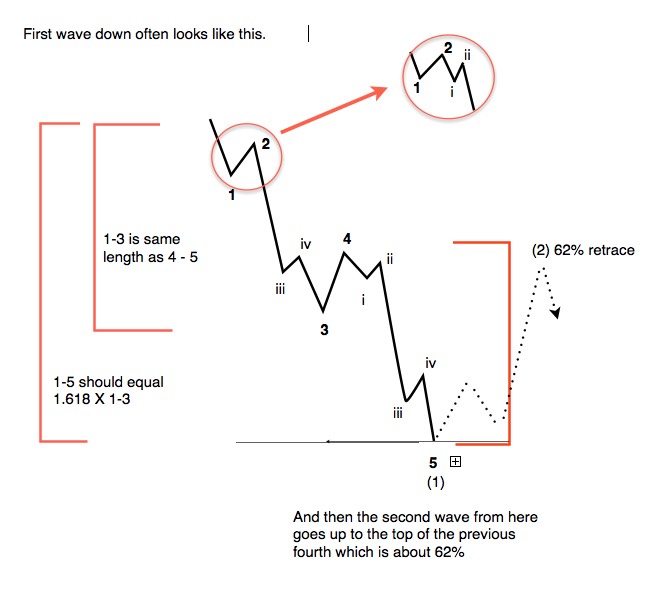 First waves of an impulsive pattern have a different structure than all other impulsive waves. This fact simply isn’t addressed in the book. This is why first waves often have the appearance of a three wave sequence. The different is subtle.
In a true impulsive first wave, wave 4 must retrace to the level of wave iv in the diagram and also must reach a retrace level of 38% of the distance to the beginning of the first wave.
If it does not meet this requirement, the wave is to be considered a zigzag, which is a 5-3-5 combination (in this case, it’s corrective).
Waves in Five. The difference between a corrective five wave pattern and an impulsive five wave pattern has not been addressed at all in the book. This perhaps the most important distinction in determining corrective vs. impulsive wave structures.
B Waves as Irregular Tops. I’ve tackled this interesting phenomenon at the top of this EW expose with a chart showing the SP500 from 2009 to today. Irregular tops appear (if at all) at the top of an impulsive trend. This is referred to as an “irregular top,” which Elliott identified as a feature of his theory, for different reasons that don’t apply to the current situation I describe above.
But, here we are with a B wave. It should not be ignored, or “papered over” by breaking the rules. That’s not the proper way to advance a science. Recently, I’ve seen a chart from Mr. Prechter that ignores a fifth wave in order to skirt the issue of this irregular top.
In summary, what we have a technical publication riddled with errors. It’s no wonder that elliottwave practitioners come up with different counts. However, there is seldom more than one correct count. The issue is the rudimentary condition of the tools they’re using.
I’ve been attempting to research these tools with the goal of clearing up the misconceptions. That’s been my goal.
I’m not disparaging the work of Robert Prechter. He did a great service by publishing this book, which in my view, is the most comprehensive interpretation of Mr. Elliott’s work. However, like any science, it often undergoes intense scrutiny, with the ultimate goal of proving its viability without doubt. In my small way, this is what I’ve been attempting to do, and all the research I’ve done doubles down on the integrity of Ralph Elliott’s work and the Elliott Wave Principle itself.
________________________
I get asked often why EW analysts come up with different counts. Erroneous information is a great foundation on which to construct a building that will eventually collapse. If science is rock solid, then the building will stand forever.
However, if your tools are blunt, you’re going to do a less than adequate job as an analyst, through no fault of your own (other than laziness, I suppose).
Some have offered statements to the effect that the Elliott Wave Principle is a subjective method of analyzing the market. That’s an attitude that suggests a minimal understanding of the process.
Prechter himself spent a few pages on this very topic:
“Despite the fact that many analysts do not treat it as such, the Wave Principle is by all means an objective study, or as Collins* put it, ‘a disciplined form of technical analysis.’” — page 94
• Charles Collins wrote the foreword to the Elliott Wave Principle.
As a result, I don’t generally look at anybody else’s work. I don’t let news or events play any part in my analysis. My job is to remain completely objective. I only look at indicators after I have done my initial analysis to see if they support (or not) my prognosis.
So, as an EW analyst, are you an “artist?” Perhaps, because you’re given a set of tools that are roughly hewn and have to use them to bring clarity to a market that moves in a predictable manner, churning out the same patterns over and over again, with Fibonacci relationships to each other most often provide multiple target options.
I suppose the real art is weeding out those options through experience. So, there is art in analysis, but I believe how the market moves to be a science that was uncovered by Ralph Elliott, with rules and guidelines that were refined, clarified, and communicated by Prechter and Frost.
In my work, my interest has been in refining the tools, finding the errors in the communication of Elliott’s work. However, the free blog is obviously not the correct platform through which to undertake this task.
It looks like it’s time to move on, by spending my time where I can have more of an impact.
____________________
Problem receiving blog comment emails? Try whitelisting the address. More info.
______________________________
the real deal SM 2
The real deal …‘Educational, insightful and thorough market analysis for all levels of traders. It’s Elliott Wave at its best….Peter Temple is the real deal’ —SM |
Have not had a losing week RW 2
Have not had a losing week …I have been with Peter almost a year. The only thing that matters is have I made money with his service. I think I have finally turned the corner using Peter’s EW. I have not had a losing week in the last 5 months. Thanks Peter, for your amazing amount of hard work. —RW |
The best of them JL 2
The best of them …Last couple of years, I subscribed to several ‘market traders’. You are by far the best of them and the personal contact is awesome. Daily and daily updates are very well written! Besides your expertise in EW, I also like your cycles analysis. Best investment I ever made! —JL |
Couldn’t be happier … KK 2
Couldn’t be happier …The analysis and insight you provide is simply amazing! I’ve been trading the futures and equity markets for well over thirty years and usually average around 5% monthly. Since joining your Traders Gold Service two months ago, that number has better than doubled. I couldn’t be happier.—KK |
Rise above the rest … SM 2
Rise above the rest …I have only ever met a few people who, in their chosen fields (astrology, medicine, music, martial arts, technical analysis), rise above all the rest and you are one of them…you have ‘the gift’…and that’s why I’m a Trader’s Gold member. —SM |
Tops in your field DZ 2
Tops in your field …You are tops in your field. Tried to follow Elliot Wave international for years. They were always behind the market. After discovering you, I perceive that you are an expert in reading the waves, which puts you way ahead of the rest of your peers. And you can read the Waves like you are reading tomorrow’s financial section. I pray you stay healthy. —DZ |
Get an upper hand … JC 2
Get an upper hand in trading …Seeing all the different currency pairs and the wave structures and hearing you explain why this has to do that on a nightly bases gives one a upper hand when trading. Elliott Wave applies to all stock and indices and can be applied to any candlestick chart. If someone ask what you want for Christmas – Tell them a membership to Peter’s “Traders Gold!”—JC |
A true expert in Elliott Wave FL 2
A true expert in Elliott Wave …You are a true expert in EW analysis. What you provide is not available anywhere and is priceless. Subscription on your services is the best thing I have ever done. Many thanks for your effort to make me a better investor. I now have more trust in my investment decisions. I hope you will continue the excellent work! —FL |
The Market This Week
Here's the latest daily chart of ES (emini futures)
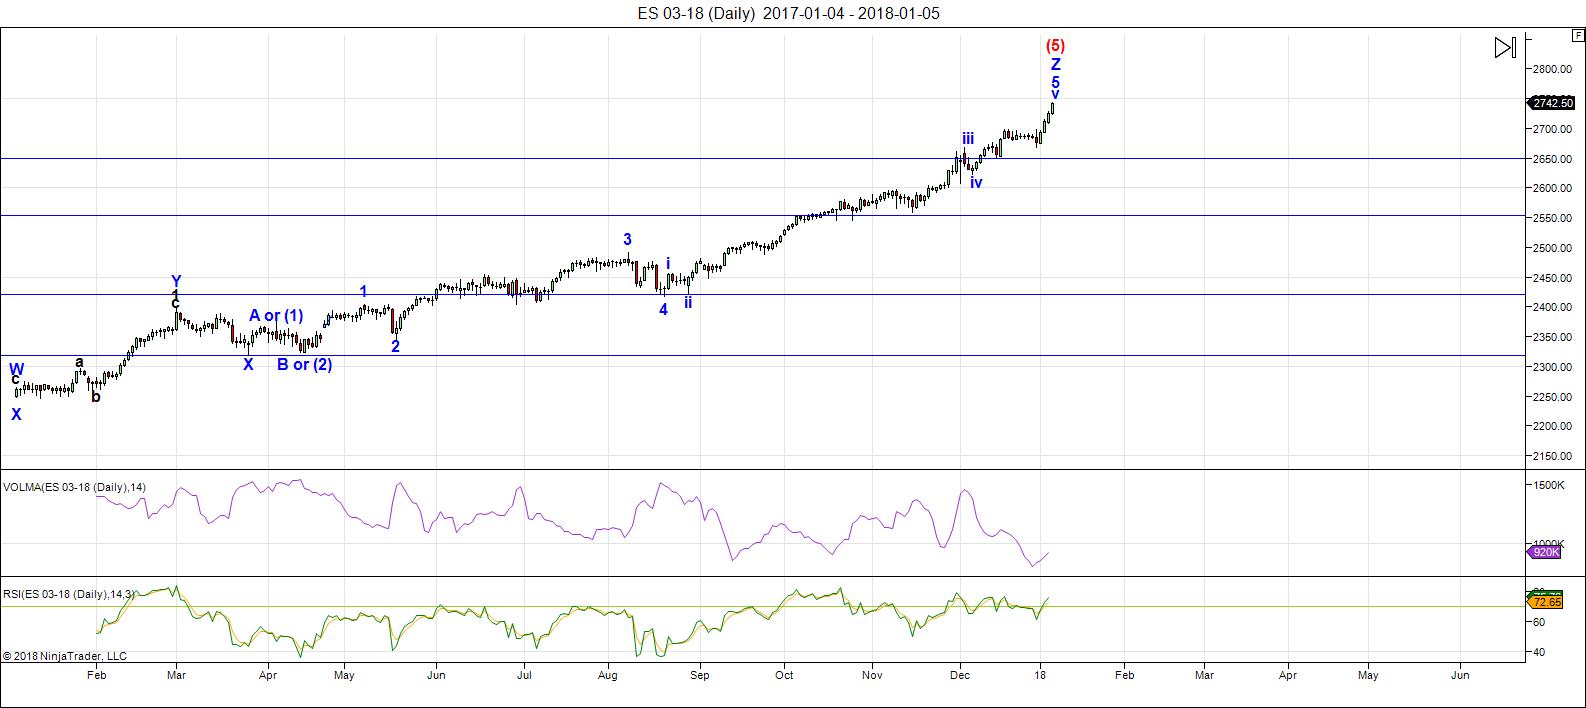
Above is the daily chart of ES (click to enlarge, as with any of my charts).
There have been no material changes to my prognosis. We are at the high. I expect this final wave to turn down this week.
I thought last week we might have a large contracting triangle in play, based upon the need of currencies to top. However, with the dollar topping earlier than I expected, the US market has rallied to a final high. Everything is in place for a major change in trend.
My Trader's Gold subscribers know that every one of the ten assets I analyze daily is at a major inflection point this weekend.
Volume: It's dismal. Bullish sentiment is now at 93%, the highest it's been since the top of the dot.com bubble.
Summary: The count is full for the US market in general, except for small subwaves that form the balance of a motive set of waves in SPX and some other major US indices. Watch for a turn this week, which will change the trend and end the 500 year bull market.
___________________________
Trader's Gold Subscribers get a comprehensive view of the market, including hourly (and even smaller timeframes, when appropriate) on a daily basis. They also receive updates through the comments area. I provide only the daily timeframe for the free blog, as a "snapshot" of where the market currently trades and the next move on a weekly basis.
______________________________________
Sign up for: The Chart Show
Next Date: Thursday, January 18 at 1:00 pm EST (US market time)

The Chart Show is a one hour webinar in which Peter Temple provides the Elliott Wave analysis in real time for the US market, gold, silver, oil, major USD currency pairs, and more. You won't find a more accurate or comprehensive market prediction anywhere for this price.
Get caught up on the market from an Elliott Wave perspective. You’ll also get Andy Pancholi cycle turn dates for the SP500 for the balance of the current month. There’ll be a Q&A session during and at the end of the webinar and the possibility (depending on time) of taking requests.
All registrants will receive the video playback of the webinar, so even if you miss it, you’ll be sent the full video replay within about an hour of its conclusion. For more information and to sign up, click here.


I’d like to see the blog made available going forward, but I can certainly understand Peter’s frustration with some of the content that does not relate to EW analysis or is either indirectly or directly critical of his work. I would propose that Peter keeps his blog open on the condition that all future comments from readers say something about EW analysis, even if it’s only one sentence in a paragraph of other comments. If the comment does not relate to EW analysis, Peter would then have the right to remove that comment and even prevent that person from posting going forward. My question to Peter is, “Do you look at other EW practitioners for a cross check on your work or do you largely ignore them?” For example, I recently came across the above post by Andrew McElroy on Seeking Alpha, and from a quick review of his recent posts, his EW analysis appears to have been pretty good thus far. However, I have not heard of him before and don’t know what his EW analysis reputation is. Thanks.
As I said in the post, I don’t look at the charts of others. I don’t know what the point of that would be.
Oops. Here is the post I had referred to in my comments above. https://seekingalpha.com/article/4135689-elroys-elliott-wave-weekly-january-6th
you must be right- all the other bears are capitulating. hussman now neutral and Grantham near term bullish and prechter now says more upside and etc… only you and Nenner are left. thanks!
Question for all-does anyone know of any other widely followed and respected stock market bears that are calling an imminent top besides Peter? I can’t find anyone else-I think Peter is right on target!!!! thanks
???????
i am sure the “optics” will be confusing…………………but who “be” you? why have you co-opted my name?
whereas, i agree fully with what you wrote…….. your writing style can never be considered as …………”luri” ……..”BE WARNED”!!!!!!!
And peter……………forum or forum”less”, and EW aside ……………………simply put…….., we love and admire you……..
…………………………..and yes, there is something else……………………..”THANK YOU”
As usual, your personality shines through! A good thing. Thanks.
I’m not looking for accolades here, though.
Peter T,
I personally would be very disappointed if you do indeed shutdown the comment section. I can only imagine the attacks you endure that many of us never see because many of us are not monitoring the site 24/7.
I have wanted to understand EW analysis for 4 decades…You have made the scales fall from my eyes. For that I am most appreciative.
Why not consider charging a monthly fee to access the comments section. I personally enjoy the comments from many posters…ie Verne, Joe, Peter G, Luri, LizH, Tom and a number of others. Perhaps “not” charge posters who “add value” such as Joe, Verne, Peter G and Luri. Just a thought.
Hope you find a solution that works for “you” !
Or I could require a log in, just like any other membership site. The other issue is monitoring all these comments. I’ve got about 3 pages of them since last yesterday. But it was only “members,” I won’t necessarily check them daily. I’ll think about that. Thanks.
Luri,
Am I understanding your post correctly? Did you just indicate someone posted using your name…claiming to be you?
ed,
you are indeed correct……..
https://worldcyclesinstitute.com/the-final-route-to-the-top/comment-page-1/#comment-25505
“I’ll shut down the comments area next weekend”
I hold Peter Temple in high regard…there has not been, nor will there be any effort by me to undermine Peter or his work…having said that, there are a number of individuals who refrain from posting their proprietary work (or other insightful information) on the public blog…consider it the knucklehead factor…in my view, the comments are little more than a distraction!
Why don’t they invest their time and money and build their own web sites instead of leaching off of Peter’s work. My..
none of the unidentified individuals leach off Peter’s work…
https://worldcyclesinstitute.com/the-final-route-to-the-top/comment-page-1/#comment-25581
please post the link to the last post you made where you offered something of value…
Hail
To
The
Elliot
Wave
King!!!
Peet, you know I love you as a friend and I understand how you feel… I therefor support your decision 200%!
May God bless you and keep you!
To all: save this post and think about it for some time…
Cheers,
W
The Netherlands
oh wow.. I do hope you stay on & allow the comments. weird .. today of all days — I was revisiting EW theory which some traders find it subjective . was looking @ http://www.tradersdaytrading.com/support-files/elliott_wave_theory.pdf & also on #GANN https://fx-arabia.com/vb/uploaded/178_11280678913.pdf
Ladies,
I have a suggestion to keep this blog open and yet follow rules Ser but our host.
It is clearly written that we are welcome to post on the below 4 category
1) questions on EW
2)input on EW
3)cycles analysis
4) Astro
So I suggest that when we post we state clearly which category we be
belong to
Example for my post as below
Astro
Guys,
Take care as Saturn in Capricorn now until Dec 2020.
Stuff happens all the time when Uranus joins Taurus from May 18.
Peter,
Pls let me know if this is acceptable to you.
Just a simple guy cause life is short
Hi Peter,
I don’t really comment on the site but, I want to thank you for all the hours of hard work you have put in to help the “little guy” understand an extremely complicated market analysis. I find your work fascinating and look forward to your market update each week. I am also hoping that you might put out a chart of what the waves down might look like once we top?
Thanks again for all you work.
Blessings,
Roger
Hi Roger,
There’s a chart of the first wave down in the blog post. That’s what it should look like. Everything follows once a first wave is in place. In other words, first waves are “not tradable,” from an EW perspective, as we really don’t have anything to go by. But once a first wave is in place, you can project additional waves (targets, etc.).
I’ve posted the charts of 1929 and they’re a good clue to what the waves will look like.
Peter T,
Thank you for all the knowledge you generously share with us. I am interested in cycles too which is how I found your blog. I feel I cannot comment much on EW since you are the guru so I l trust whatever you write. I will respect whatever your decision is regarding the suppression of comments. Many comments have helped me though. For example, Valley and the Original Dave introduced the idea that Year of the Fire Rooster will mostly be bullish. Since Chinese Astrology is a 12 year cycle within a 60-yr. cycle with 5 elements in yin and yang form, I thought it may be useful in the overall “theme/trend” of the market within a given Chinese year.
I think the incoming weeks are very important. Lunar eclipse late January, Solar eclipse on Feb. 15 which is also the last day of the Year of Yin Fire Rooster. Feb. 16th ushers in the Year of the Yang Earth Dog. Joe also wrote the Venus bull cycle switches to a bear cycle sometime this month.
I can’t remember what term Joe exactly used but he mentioned it will be a faux puetz crash. You can start calculating dates to test possible swing hi/low dates but lunar eclipse came before the Oct. 28th solar eclipse in 2014.
So yes, for me, I welcome hypo data someone shares in the comments in the coming weeks. But as always, I will respect whatever decision you make. As always, all the best to you.
LizH: Do you post anywhere else?
Skippy, yes, occasionally I do. I am on twtr.
Much heart-felt thanks to Peter for providing this forum and I for one will be sorry to see it end, but I fully understand the man’s position. I doubt there is anyone here (except for the occasional troll) who posts with the intention of disparaging Peter’s work. Frankly anyone who has taken any of Peter’s chart shows knows the man knows what he is talking about and is more intimately familiar with the nuances of EW theory that most. Much of the forum blather is mostly good-natured banter on the part of those of us with clearly fewer skills, doing our best to make sense of the day to day gyrations of the market. How often have most us spent time thrashing around until Peter gives a post that clarifies the situation? I for one looked at the forum as a learning opportunity. It quickly becomes clear who knows what they are talking about as opposed to people just blowing smoke. We are after all traders, and tend to be more interested in catching daily and weekly trends, than the broader and deeper philosophical questions of the nature of and evidences for corrective cycle waves. I think this short term focus has been part of Peter’s frustration in that he seems to think it has caused some to loose sight of the larger picture. I certainly didn’t.
For what its worth, it was not until I came to Peter’s blog that I became fully persuaded that my own suspicions of this rally and bearish leanings were indeed justified by the larger EW picture which Peter has repeatedly laid out. For that I will always be thankful. Take care everybody!
One more thing. Something Peter said tonight made the lights go on for me as to why Steve Hochberg’s Short Term Update wave counts were so stinky, and that is Prechter’s misguided notion that you cannot get a b wave top. In all the years I read Hochberg’s short term update, I never once say him call an expanded flat in real time and now I know why. If you are a trader
you know what a disaster failing to recognize a higher b wave high (compared to wave A) as part of a larger corrective wave can be. What stunned me is how FOR YEARS (literally!) Hochberg kept making this same incredibly STUPID error that was costing his readers an awful lot of blown trades, including me, until I got a clue. How ironic. The current B wave up is STILL going to lead a lot of traders off the cliff!!
Great guidelines for a community. I will miss feedback from Ken and you core contributors; too bad few ego benders destroy a community…
Vision of the community: From Day 1 we have operated with this vision. We want the community to be:
1. Voluntary: people that we know are interested in our kinds of trading would be invited and offered a free unlimited trial, as a way to wok through insights from workshops in a no-risk environment.
2. Participatory: each member is invited to participate as they feel moved to do so. There will be no pressure to talk, contribute or attend. Transcripts must be available so that people from different time zones can participate in a conversation distributed through time and location and topic.
3. Friendly: A moderator will be able to enforce standards of acceptable public behavior. The intent is to let the community find its own level of acceptable discourse, but in general it must pass muster with my mom. We will not say or do anything our moms wouldn’t approve of.
4. Humble: we will try to maintain a spirit of humble cooperation, acknowledging the markets are not only unknown, but may very well be unknowable. We will approach he market and in our discussions acknowledge that trading is like sneaking up on a sleeping grizzly. Tread lightly.
5. Energetic: the environment must offer enough reliable, frequent value to be a place where people are eager to participate on an intraday basis through weekly basis or it will die of its own weight and irrelevance.
6. A place for reflection: we must have ways not only to trade intraday in fast moving markets but have the ability to conduct and review thoughtful reflection
7. A gathering place for community ideas: we want to be a place that people naturally think of to share their new ideas, lessons learned and insights
8. Efficient: the community site must be simple and intuitive to operate and maintain, and allow for multiple modes of communication so that it is a one stop shop for community information sharing needs.
9. Effective: Value must be added through the process of sharing, reflection, discussion and information storage. People will be encouraged, furthermore on how they derive value, so that others will be encouraged to try it.
10. Flexible: the community solution must support multiple modes of discourse, allow for storage, have the possibility of multiple sub-groups and self-directed work group areas. It must have security, privacy, storage, transcripts, images, text and multiple modes of formatting. It must also be scalable as the community grows.
11. Web-enabled: It absolutely must be accessible through the web, through multiple end user devices in order to be useful to travelers
12. Low maintenance: it must have a simple robust architecture and simple tools for routine administration. Individual members must be able to configure the environment to their preferred work mode.
13. Support world wide access and time zones: there must be no limitations for members access based on geography or time of day (This quickly became synonymous with the Web-based criteria).
14. User-driven: the community of practice must be able to drive the direction, mode and content of discourse. It will not be imposed from above.
someone mentioned the SOLAR – LUNAR cycles here ? well — look no farther than Puetz Theory ::
Puetz has been quoted to say that the BIGGEST crash is when the SOLAR is FOLLOWED by a LUNAR. they 2 go hand in hand..
2 WEEKS AFTER THE SOLAR ECLIPSE THERE IS USUALLY A LUNAR ECLIPSE.AT THE TIME OF THE LUNAR ECLIPSE THAT IS WHEN THE MARKET WILL DECLINE
Solar and Lunar Eclipses Worldwide – Next 10 Years
https://www.timeanddate.com/eclipse/list.html
I’ve tweeted ad nauseam about Puetz Theory and Moon phases on twitter under first my twitter account BUDDIEE18 and then at Eternity100000
..both of which Twitter has me locked out of which is ok w/me. was already to quit tweeting publicly on Dec 31, 2017.
use “Search Twitter” next to your moniker — any symbol or words (along with monikers) and you get tons of free information. all one has to do is search. 🙂 simple as 1-2-3-.
BUY THE FULL moon (Jan 1/2) + 4 Trading Days
SELL the NEW moon (Jan 16/17) + 4 trading days
http://www.moongiant.com/calendar/
https://twitter.com/BUDDIEE18/status/405187690636668928
PUETZ THEORY ::: http://israel7777777.blogspot.ca/2012/09/moons-and-stock-market-crashes.html
All I can say Peter is that I read most of your updates and appreciate your in-depth understanding of the markets very much. Like others, I haven’t commented much because I’m an amateur on these subjects! Thanks for sharing your knowledge, keep up the great work
🙂
Peter, thanks for al your posts, although it is a pitty to see this blog disappear.
Will you inform us if you shut it down?
All the best John.
Oh yes, for sure. I think making it a membership signup is a good idea. I don’t really want to charge for it, because then it would require more of my time and I don’t have any more time. I’m fresh out.
🙂
Andre,
Are your dates still valid,so up to day and down into 9/10 Jan and after that up again?
I’m curious if passive investment instruments such as ETF and AI driven algorithmic trading has “diluted” or “distorted” the core data sets used in EW analysis. I’m not disputing the discipline, but I wonder if it relays too much on the principles of “natural/organic” aspects of peer to peer human thought processes/reactions and doesn’t factor in enough the rise of the “machine” trading influence. My hunch is that the machines are/will hyper-impact moves one way or the other. Machines don’t react that just act. I’m fine if you pull the comment section.
I haven’t seen any anomalies. All the measures, waves, etc. are on target.
Peter Temple,
Sincere thanks for the sharing of your work and returning the study of Elliott Wave Theory back to a science. The work you have given away has hopefully added to your “good karma pool.” I have greatly appreciated your blog.
Peter, thanks for a great webinar this week! All the best! Mike
Mike,
The next one may be the most important one I’ve ever delivered …
Thanks!
Don’t shut down the comment page on my account, I will just no longer post. I was trying to give another perspective and be helpful, so this will be it for me. You want EW analysis, here you go. I work from a yearly chart down to the 1 hour chart, that’s what my mentor taught me. Starting with the yearly chart 1932-1937 is cycle 1, 1937-1942 is cycle 2, 1942-1973 is cycle 3, 1973-1974 is cycle 4, and 1974-2007 is cycle 5. That makes a Supercycle 1 with a perfect zig zag down to Supercycle 2 down to the 2009 lows. Pull it up on a chart, it’s as clear as day. Supercycle 3 began and we’ve had Primary 1 complete in 2015, Primary 2 down and completed in 2016, and we have been in primary 3 every since. We currently are still in intermediate 3 of the 1st major wave of Primary 3. That’s it. Back in the fall i posted on here we were in intermediate 3 only to get bashed, but here we are today alot higher from that point. Good luck to everyone and have a great day.
Exactly my point. Thanks.
Thanks Dan. I for one do not think disagreement necessarily equates with disparagement. It really depends on how one’s point of view is presented. I have been bearish, you have been bullish and so far it is very obvious to any impartial observer who has been right! This is one reason I don’t pay much attention to folk who post opinions but no trades. All the best!
I have absolutely no issue with opposing views. However, with no evidence to back them up, they’re simply opinions and have no value.
dan,
i have been known, on more occasions than naught, to be bubbly and “blond” – but your post has me “unbubbly”……… so i have dawned my super smart “brunette” wig.
ok, here is me being a brunette……………… wave counts completely aside – i am taking account of “YOUR” timing numbers –
super cycle wave 1 [all five waves] – from 1932 to 2007 gives you 75 years to produce 1 full wave.
supercycle wave 2 [a/b/c corrective] – 2008 to 3/6/09 – gives you 1 year 3 months [give or take 3 months or so]
Hmmmmm……..so it takes a full human lifetime to generate wave 1, yet if you had a new year’s eve baby in 2007/08 – that baby would STILL be in full diapers and still nursing, upon the full completion of supercycle wave 2……………..??? really??? …..now remember – i have my smart brunette wig on!!!!
is it DRY in here???………….is the air really dry in here………….?……, as i am having a very difficult time “swallowing” the two vastly different time differentials…..
I bet Peter T knows the difference between waves and cycles.
That’s because you are not taking into consideration how fast and far “the infulx of money” and “technology” moves the market. Now we can throw politics into the mix. Just like Peter using EW as a constant ( from a set of rules derived 80 years ago) instead of a variable, not allowing for an ever changing socio-economic world. I would throw both wigs away.
ken,
bite your tongue…..no sane person “throws” away a wig! and i mentioned only ONE wig – so i am unsure where you got the second one…..is there a hidden “wig” secret you want to share with the class.?????
so “nominal” ken…………………do you think in “real” terms??…..or only in nominal terms? can you show me in real terms how that 08 correction was a supercycle????……..and what of social mood, and sentiment – can 75 years of social mood and sentiment cycle within the blink of an eye – because of ……………………….technology????……………………….. really ken?……… yeesh!
To Brunette Luri………The S&P was sitting around 117 in 1980. Then guess what happened? The effects of the 1978 Recovery act that allowed 401K’s started kicking in as employers initiated the benefit to employees. Although ERISA passed in 1974, the IRA’s were made popular in 1981 by the Economic Recovery Act. As this ” influx of money” started to flow into the stock markets along with the “technology revolution”, the markets shot up about 2250% to where we are today. Money and technology.
To blonde Luri……who mentioned anything about supercycles.
As an add to the below reply……………..the technology revolution was ( in part) when the average person at HOME could start placing stock trades from the their personal computer. Of course now we can do it from our phone also. This all started in the late 1980’s and gave millions of people the opportunity to invest or trade the stock market.
so ken,
square the circle for me…………….in 1974 the purchasing power of a single US dollar was — around 60 cents [ish] versus a 1913 dollar…………….today the purchasing power of that same dollar is around 4 cents versus a 1913 dollar…….. can you see where i am going with this…………… REAL dollars and REAL dollar gains versus NOMINAL dollars, and Nominal dollar gains………
….. the moonshot in equities since 1974 reflects the destruction of the purchasing power of the currency – erroneously termed “inflation”…………debt is money, and when debt grows, money grows……..blah blah blah……
……………………..and dan mentioned the supercycle……………and my initial reply was to dan……………………
ken……….ken……………….”tag”………………………YOU’RE IT!!!!!!
Luri….Aha….the old square the circle metaphor. Can you help me out? I pulled
A dollar out of my pocket and I can’t tell if it is a real dollar or a
Nominal dollar. Funny thing though…whichever one it is, they both
Seem to be worth the same amount at the store. I can’t figure it out.
I think they are taking advantage of me now that I know that there are two
Kinds of dollars. Thanks for opening my eyes….Now go put your smart brunette
Wig back on………….Marco……
I don’t know what’s going on here but I did not write that comment and want it removed. I particularly disagree with this “I think this blog is great to debate and share thoughts-positive or negative.” and things being attributed to me with me saying them!!!!!!
Anyone in theory could have typed that comment, but not everyone has my email address!!!! This has me VERY concerned.
I have been keeping my thoughts to myself but as you want them here they are, in the politest terms. The NY 2018 post mirrors the NY 2017 post almost exactly. I don’t hold EWT in high regard, I like cycles. Anyone who likes cycles but doesn’t like EWT isn’t welcome here, that’s fine by me as the moderator sets the rules. But don’t post comments in my name.
Aha! Thanks.
There is an issue that seems to crop up every once in a while where an email address seems to lie dormant in the signin area. I’m working on resolving it. In the meantime, I’ll block that ip address and that should fix it for the time being.
My apologies. I thought that was a rather weird comment. Yes, that post came from a different ip address. Thanks for pointing it out.
Making the blog a membership only affair would fix that.
Thank you
I don’t think it was intentional. A few times when I am on a library computer and checking the site, I have noticed that the reply profile is already filled in when I try to post. Most times I catch it but once I accidentally posted with another poster’s profile.
I am out of my SPY Sep 250 strike puts fo 5.20 and a small profit. I have to say I was really spooked by that Zerohedge article from the 2012 comments about the FED shorting volatility. I am going mostly to cash until further notice. In fact I also want my funds out of brokerage accounts as well. I think if this is the way the FED has been behaving, systsmic risks are greater than even I imagined. I really hate missing the current short oil trade with Commercial shorts holding their biggest short position in years at 640 K contracts. If you are still trading it is the best reward risk set up I have seen in some time. All the best!
Peter – please delete my email address from your website. Thanks
Kerry,
It doesn’t keep your email address unless you’re signed up for receiving notices when new blogs are sent out to subscribers. But for comments, I have no control unless I decide to require a log in.
Peter, this is totally unacceptable. My name and website are in the public domain but not my email address. I do not expect people to comment as me praising your forum. I suggest you make it a log in only site then, I have never had this problem before on any other website. I haven’t posted in ages so why would my details be lying dormant in the sign in area?
I don’t have the answer to that question, of course. This is an example of the constant work a site like this takes that many don’t realize. It’s a constant battle for site-owners these days. The technical aspects of running an open blog are incredibly time-consuming.
AAPL is likely a good indicator of the top everywhere, as it’s down in 3 waves and needs to test the previous top, about $2 away. IWM (russell 2000) is another, about the only US index that hasn’t made a new high and it’s very close.
IWM has topped with all other indices . AAPL about $.90 away from testing high.
Tks, Charles,
Well, we can tick off those requirements. WTI oil also at a small new high, pennies above the target (a flat).
Thomas Kuhn in his “Structure of Scientific Revolutions” makes the cogent point that the way a paradigm moves from Scientific Theory to Scientific Law, is by demonstrating predictive value. It seems to me that one of the most powerful ways one could demonstrate the efficacy of EW theory is by posting actual trades based on the expected wave count.
I know that counts can and do sometimes change, but one should have a better than random chance of success with such an aporoach. I certainly do not have the skill to embark on any such demonstration, but I thought I would give it a shot with the TSLA wave count from this week’s post by Peter. While the current smaller degree labelling has already been invalidated by upwards movement today, we still could be seeing a continuing second wave up. If the EW analysis is right, a third wave down is next. To test this wave count, I am buying (in a virtual account) 10 TSLA March expiration 305 puts for 9.80
As an options trader, I am confident a third wave down should result in an easy double of those puts. Let’s see if Peter is correct.
I will keep you posted. 🙂
Aside first .. when I comment, luri’s name and email address a pre filled when I go to post.
Second … thought Peter’s column was hinting at shutting down weekly posts, not simply the forum. Personally, I seldom review the forum comments. So my remarks below were in anticipation of shutting down the blog. My mistake. I think.
Finally, agree with Verne on the Kuhn point. And I touch on that below, essentially.
Peter —
Sorry to read about your consternation over this debate.
I don’t use EW in my own work, which I rely on first and foremost. But I do track what others using EW are thinking. I agree that in principle it offers more than most other T/A.
There are perhaps ten careful EW practitioners publishing their views from time to time for many of us to consider.
Only rarely is there much agreement on the larger degree counts. I’ve been expecting that over time, views would converge.
They have not. So for many of us coming to EW only in recent years, the last few years represent the first public (internet) bake off of who might have it right.
I am not a declared disciple of yours, or anyone’s, at this juncture. I’m agnostic. But I have respect for your efforts and conscientiousness.
The proof will be in the pudding (per Verne and Kuhn). And it may take a while, even if your view is correct, for that to be revealed to all.
Clearly, given the different counts out there, you (plural, collectively) are either using different versions of EWP, or you differ in the adherence to a consistent application of the rules.
The waves never label themselves. And its a challenge for the rest of us to evaluate competing paradigms. At least, it has been for me.
Some like you have made it known where they disagree in the rules, which is a critically important service you’ve provided. You prefer RNE’s original rules. Joe Taverna seems to prefer Neely’s. Daneric is following Hochberg (and Dan has had to make repeated changes to his larger counts).
Most others never even ALLUDE to possible philosophical differences, and one of my friends commended you for putting that out there this weekend more clearly for everyone.
The requirements for 62% retraces on impulse wave 2s. The LD and ED requirements for the 1 4 overlaps (others have it merely as preferred). No truncations.
I don’t blame you in the least for your feelings of frustration. I think back to Peter Schiff being greeted on CNBC with derision and ridicule when he alerted viewers in 2007 of the coming housing debacle. It must have infuriated him to be challenged like that, but he got the last laugh several years later. In this case, you are facing doubters and skepticism but not ridicule.
We are all traders … and its a probabilistic discipline. Most major tops have come with the NYSE cumulative A/D line turning down before the major indices top. So my view is that the odds are against your count. But I can’t be certain. There have been exceptions. I have my own tools, which seem to point to a momentum top ahead only, and the need for multiple wave 4,5 unwinds. But parabolic moves could easily deceive my system. I have limited prior experience with them.
My suggestion would be, if you are proven correct in the end, to write a book about your views that could supplant Frost and Prechter. They may have gotten first mover advantage, but there should be room for a better bible if and when the their version is shown to have missed the boat.
Regards,
Pieter
All that and I forgot to supply my own identity. That was me, not Luri posting the above. Apologies.
I assumed it was unintentional as it has also happened to me….now I always check before posting if I am not on my own network…
Great idea! EWI has done a tremendous amount of injury to EW theory with their long history of erroneous calls. I can understand the skepticism of some who may not have considered possible mis application of the theory by some.
Pieter,
I don’t know why that email thing is happening but I’m going to work on the login idea (and I have someone working to try to solve the email issue). I’m concerned about this.
I haven’t changed my count on a long time
I now have price moving above an acceleration channel I have drawn around the current upward movement. While not always the case, this is very common, in fact expected, for third waves. I am prepared to hear another take on the momentum question. Could SPX now be acting like a commodity…?
“No good deed goes unpunished”.
Sorry you feel the way you do but I don’t blame you.
In case this is my last chance to post, thanks for the education!
Since 1950, a greater than 2% market rise in the first five trading days of the new year has resulted in an up year for the market 100% of the time that has happened. Today’s close will one way or the other have historical signigicance as we are already up well over 2% this year.
Verne, I respect your posts as knowledgeable and indicative of good research, but when I hear “always” and “never” or “100% of the time” when it comes to data, I always call in the data police. I did not do a detailed check and you did not mention the index or average you (or someone else) researched, but I think most bears would be satisfied with a year like 1973 when the DJIA was up well over 2% (2.7) in the first 5 trading days, then down 16.6% for the year. In 1984, up 2.2% for 1st 5 trading days, down 3.7% for the year… In 1984, S&P was also up over 2% in first 5 days and up for the year, albeit only slightly. But it was down for the year from the high reached after the fist 5 trading days. I feel it is not a meaningful stat and may even be deceptive and give false confidence to those who buy the concept but don’t do the research!!
Thanks Peter G. I stand quite corrected. I sloppily looked at only a few years back and took the Zerohedge stats as gospel. I just LOVE the fact that you caught that! Next time I will actually go back and CHECK!! 😉
One difficult lesson I have learned over the years is to not conflate market price with logic, or even reality. Is it for example, logical for FED governors to consciously decide to actively short volatility and so encourage the assumption of outsized risk by market participants?
Consider Continental Resources, a big shale player. When you take a close look at their balance sheet, they are actually worth less than zero. The are issuing new bonds (at higher rates I might add) to pay off older ones in a classic Ponzi scheme. Why is this bankrupt stock trading at 55? l am not saying anyone should short it. Who knows how long the insanity will last?
I must opine based on market price action these past several months, sideways consolidation such as we are seeing today has always lead to additional upward movement. Will that change today? Who knows?
I still think we get the first clue of the turn in futures. Bye for now…!
Peter T,
You do a very good job on the blog, you are among very few who are calling a turn. It takes a lot to make and stand by such calls. Appreciate your effort.
Market turns (cycle changes) most often concur with events… whether the “triggering event” caused the turn, or the turn caused the event… or neither nor both. EW, planetary, psychological and other factors interplay with overbought and oversold levels. It is up to us as traders to set up, determine triggers and execute our plan. Peter has meaningful feedback to help us execute. If we are here to have Peter predict the future or gain counter-fulfillment, we are in the wrong place (just my opinion). Peter, please keep up the good work. Mike
Amen! 🙂
Some more technical fun. Yes SPX now has a slight throw over above the Oct 1987-Mar 2003 bottoms line from underneath on a log chart, but perhaps it was only so that these shorter term channels whose upper channel lines converged between Friday of last week and today on an arithmetically scaled chart could be met… that’s happening right now as we watch!! https://imgur.com/a/laqbX#nmUJTRk
Click on chart in link above to make it full-page…
I know Ed likes exact numbers, so here you are, Ed, for the chart in the link just above…
Blue channel line today…2748.19 tomorrow 2749.66 Up ~ 1.47 pts/day
Red channel line today…2748.69 tomorrow 2750.98 Up~ 2.29 pts/day
Peter G,
Thanks for the preciseness!!!
Cool!
Well folk, while history does not always repeat, as someone said, it frequently rhymes.
Based on today’s close, a down market this year would break a record going back to 1950.
Wired funds arrived home safely!
Holding small contigent of SPY 243/245 March bullish put credit spreads in anticipation of more upside.
This is Kerry posting on my phone. I now have Verne’s email address. This is unacceptable !
Yikes! That is completely nuts! That really should not be happening. There has to be some “promlematic” code in a sub-routine somewhere
I subscribe to a service that always has “my” contact/subscription info as some person in Hawaii (wish that was me… I’d be surfing curls instead of internet 🙂 They couldn’t correct it, I just have to verify my info before transmitting… hmm
I sounds like the system in some cases is preloading the profile of the last poster on the thread; it should be an easy fix…
Yes to this observation. You can clearly see It’s a non-secure site, warning you personal data may be compromised. Don’t use company e-mail in the future if you want to post a comment.
Kerry again – should of known it was my fault Liz
Kerry, if you consider your e-mail as high-risk data then a good precaution is to refrain from posting comments in a public forum that requires you to input the high-risk data.
Hi Peter,
Always a great read.
Many thanks and a properous 2018
Phil in Sydney
Please!! I do not want anyone to take what I am going to say next as any kind of personal criticism or disparagement. The forum will be gone in a few days and I just wanted to throw this observation out there for what it is worth. When I first started reading the site a few months back, I challenged the plethora of posters with widely diverging opinions and methodologies to post a few trades along with their prognostications so readers could have an objective, impartial way of determining whether they had an approach to the market that could reliably predict market direction. As traders, if we don’t get the trend right nothing else really matters. Very few folk took me up on the idea. Nevertheless the opinions, which I fully enjoyed reading, continued to flow.
Since I have been on the site, I followed my own suggestion and posted details about 12 trades I made based on my own metrics for gauging likely market direction in a particular stock or ETF. Eight of those trades, including the SPY puts closed this morning were profitable and in four I was stopped out for a small loss. I gave full details about entry and exit price and in some cases lot size. By my count that was about a two out of three success rate for those trades so listed. Obviously those were not the ONLY trades I made during the period but the success rate was quite typical, around 66%. I do trade a lot of credit spreads so that may give a bit of an unfair advantage compared with those who don’t but I trade what I know.
I also made an attempt to pay close attention to posters who would post information about possible market direction. Since no one generally would offer specific trades, I kept tract of a simple metric as to whether they expected the market to rise, or to fall. The results are quite interesting. For just about every poster who gave specific information with specified time frames, as I look at my notes, it was literally a coin toss. No one posted an opinion on market direction that gave a better than 50% chance of being right in the time frame specified.
There was one exception. Although the time frame was a lot broader, the only person on the site who was better than 50% in opining where the market was likely going in a specified time frame was Joe.
That is my story and I am sticking to it. Go back and check if you like but that is just the way it is folks.
Of course a few folk have specifically stated that they were long the entire time and they also have been correct about the trend.
Sorry Ted! I happened to me again and I, Verne, posted under your profile before I noticed.
You are forgiven Verne 🙂
So kind! Thank you! 🙂
Joe is amazing. His SOXX observation allowed me to hop on nvda and avgo last week. Verne, still long on investment accounts except for one fund I sold last summer. It was a fund of funds, difficult to track for me.
For trading accts:
Swing low. 8/30/2017: https://worldcyclesinstitute.com/the-hopium-epidemic/#comment-21385
Swing high. 9/21/2017: https://worldcyclesinstitute.com/time-for-a-small-dose-of-reality/#comment-21931
Swing low 12/5,6: https://worldcyclesinstitute.com/christmas-stalking/#comment-25446 So far the potential fractal still looking good.
Verne, I wanted to say something earlier regarding your TSLA puts. While I’m over-all bearish with TSLA, I do join bullish intra-day waves via calls. I feel your put entry is too early. If you look at the chart, you’ve got 2 back-to-back hammer candles. Fast Money was defending it last Friday, Musk tweets Sunday night, Mon morning, so you know the bulls will try to push it up today. They’re aiming for 350 which is the price a little over the daily upper bollinger band. They are not looking at EW. Only riding on momentum. The fastest time it moved from lower to upper BB was August 2nd to 3rd. It took awhile for momentum to die down. Another potential fractal is 8/23rd with 8/24th as a swing high.
I completely agree with your take Liz and you are in fact making a very powerful point, which I know will not be lost on a single trader on the site.
I very PURPOSEFULLY made that trade based ONLY on the count that Peter gave in this week’s forum update.
I know very well that no experienced trader enters a trade based on a single signal. I certainly never have, no matter how much I trust it, or how reliable it has been in the past. I learned that the hard way let me tell you!
Remember, the entire point of the experiment is to test the predictive value of an EW count, and the count as presented called for a third wave down so I did not want to cloud the issue by citing any external or peripheral factors.
If we are attempting to establish that we can move from “theory” to “law” in application of EW, which is indeed the essence of the scientific method, we need to demonstrate that we can successfully trade with ONLY the wave count, assuming it is correct, and do so consistently, AND repeatedly.
The force of gravity is ALWAYS precisely related to the inverse square of distance between the centres of the two objects, PERIOD! No ifs, ands or buts.
I used a March expiration date as I think it more than enough time establish the onset of a third wave down or not. I really would appreciate any input from other posters on my approach and welcome any and all suggestions on how I might improve it.
Reread Joe’s posts over the weekend…Eventhough he is traveling (I think)…he had a potential turn window January 9-18th. Also was considering a short position in the NYSE index 13,220.
Not trading or investment advice.
DOW theory confirmation of bull market today, with every major index except RUT making new all time highs. Wow!
If we are indeed close to a top, a lot of historic bullish signals are going to be smashed and completely negated. I have to say I am starting to become more amenable to the idea that this may indeed be just a third wave up with a fourth and fifth yet to come. Just my two cents folk; not saying I am right and others are wrong. I am trying to apply what I have learned over the years but certainly realize things this time thing may not necessarily going unfold the way they have in the past. An old mentor, Bryan used to chastise me:
“Beware of analysis paralysis, and trade what you see!” 🙂
I will not consider short trades in this market wise prior to a decline below 2714.37, which if it sticks, will close the two most recent market gaps and signal at the very least a likely end of the current upward wave. A move below 2673.61 will confirm it. No point in fighting the trend.
Peter,
I for one am still a novice. I do read everyone’s comments and find them fascinating. For someone who is seeking wisdom your site has offered a view seldom seen by those seeking such information. I appreciate your honest approach to analysis. I will be happy to sign in, sign up or do whatever it take to continue to participate in your forum. Please consider continuing in some way as best you can. Your wisdom is invaluable to me. Thank you for all your efforts.
Jeff T
Thank you Peter for your updates as well as allowing me along with all the others
To use this web site to share and exchange thoughts about the stock market .
Lizh
The Venus bull cycle ends tomorrow Jan 9 th .
The flawed puetz cycle begins 20 to 25 trading days before Feb 15 ( the solar eclipse )
There is a George Lindsay time count that ends Feb 16 th .
I’ll agree with Peter, this next update will be extremely important going forward .
Time wise the window is opening for a top . The Elliott wave count now needs to
Confirm the timing .
As Peter has mentioned many times , we need to see 5 waves down followed
By 3 waves up .
If we are truly seeing a top then we should know by next week yet I’m sticking
To my time span of Jan 9 – Jan 18 th .
Let’s not forget option expiry .
Thank you Peter for all you have done the past 2 years and helping me
To prepare for the change of trend .
Joe
Verne
Is the utility index a part of Dow theory ?
Just a thought to consider
Joe
For the purposes of DOW theory Joe, I think it is excluded, but I am not sure why.
I think the main idea is that a rise in the other indices that is driven by true economic expansion will be reflected in a commensurate increase in goods being transported hence the key being confirmation from that particular index.
Verne
I am no Dow theory expert my any means .
I’ll say this though , the utilities are included
Yet many discount them and focus on the transports
And industrials . It has been many years since I have dug
Into the details though .
I’m not going to argue it but pretty sure .
Tim wood is a guy I know could answer this question since
He has done a ton of research on this subject and has also talked
With Richard Russel along with many others .
Nice to see them rising back towards the previous wave 4 of one
Lesser degree 🙂
It’s the divergences between the index’s
Those index’s being Dow industrials, transports and utilities
My take on it and I don’t have time to find proof or post links .
Divergences warn of a trend change
And confirmations are when they drop to
New lows together ( there is rules to this )
As well as make new high’ s together which
( also have rules ) . I cannot state the rules yet
I have heard them .
l find it fascinating that the people who do not think a top is imminent and for whom I have a lot of respect correctly cite the absence of monthly divergence between price and the A/D line which has faithfully preceeded every prior market top. That fact is indisputable. I do realize it does not necessarily have be that way at this top but the history is what it is. Those expecting price to continue upward despite the rest of us with bearish misgivings have been so far right. The divergence with utilities is indeed striking and may be the new early warning beacon. In fact it was how a few smart analysts first realised the Chinese were juicing their GDP numbers when the kept reporting surging growth numbers in the face of declining electricity consumption.
I recently read a paper that pointed out despite the blast upwards in market prices, our energy consumption has been flat for decades. Margin debt is the highest in history. I also have to wonder how much of what we are seeing in markets today is outright financial fraudulence. I guarantee no one is pricing this in…
There are some very successful systems that buy and sell vol based on divergence and dispersion. They are still selling vol even though I want to buy it. Is one industry (utilities) ENOUGH divergence to drive markets down? That is what keeps my positions small right now. Cheers! Mike
Interesting year in charts by pension partners
https://pensionpartners.com/2017-the-year-in-charts/
Where will the S&P 500 end 2018? Where is Crude headed? Is Gold a good investment here? How many times will the Fed hike rates?
I don’t know the answer to any of these questions. As Lao Tzu said, “those who have knowledge don’t predict. Those who do predict don’t have knowledge.”
What’s the alternative? Weigh the evidence as it comes, invest based on probabilities, be forever humble and thankful, and leave the predictions to those whose job it is to entertain. That’s the best you can do in this business.
Now that we have an admission from the FED that they have been actively shorting volatility ftom as far back as 2012, I now consider it to be a compketely useless metric as a trading tool. I don’t think investors understand what a perilous situation this is for their portfolios when means of proper risk assessment have been deliberately distorted by central banks. Frankly I am surprised I was even able to trade it fairly successfully, but no more for me. Who wants to trade a rigged instrument?
Based on the action in futures, we will be seeing new highs today so I will be holding my bullish put spread.
verne,
the Fed’s – illegal i may add – short volatility position renders ALL technical signals as “distorted” and “unreliable”…………….which is why everyone is scratching their head………………
……………what it also implies, is that the “POP” of the bubble ……will also be engineered………………………………
I agree. It really steams me to think about all the carnage these contemptible criminals are going to unleash on the inattentive sheeple… 🙁
TSLA UPDATE
Based on pre-market, it looks to open lower. We do not yet have the momentum one would expect of a third wave but until wave one is exceeded the count remains valid.
verne,
take a look at the overnight……………………….. hmmmm…………https://invst.ly/6aknr
The ever-present ED!
The stock and trade of central banking is FRAUD. This what you get with a fractional system. Frankly I am amused at all the gullible folk who believe that just because the FED claims it is reducing its balance sheet makes it true. BOJ is now over 200% of GDP, so the FED has plenty of room to rock…
Bid/ask on TSLA puts 10.90/11.10 so in my book Peter’s count has resulted in a profitable trade based solely on the EW count.
As an options trader, 10% or better is worth the effort when you trade the lot sizes I do. There is a bit of inside baseball in terms of selecting the most promising option chain, but that call worked for me and I would ring the register. Let’s see if a third down unfolds…
Now 11.00/ 11.30…..
I am going short the SPY right here @ 274.19. 🙂
Any stop loss in place?
I will hold onto two point bull put credit spreads until I see a futures collapse. Risk is only 200 per contract so even if we get an overnight plunge downside limited. There are NO SELLERS in this market, and has not been for quite some time. I do not expect a reversal during the cash session.
yes 274.68
I just got stopped out but am looking to re-enter short. There is a parabolic moving happening right now in the 10yr T-Note. It will spook the market. If the 10yr gets above 2.63 watch out. Rates will rocket.
SPY below 234.79 I will re-enter short – and my reason will be because the opening 5 min bar low will be taken out. Again :/
For 10y rates, the next 2 days are critical. 10y and 30y auctions have been important for that market. I am expecting 10y yields to double top around 2.60. Should happen in the next 2 days. In case it does break above 2.65, it can get messy as that market has the same short vol problem that Verne keeps talking about in equity markets. Just more systematic than in equities due to mortgage servicing portfolios.
I jumped back in short when the wedge in the SPY broke and closed below the trend line at @ 275.15 stop loss @ SPY 275.26
SPY daily candle closed with a nice upper wick. I am holding my short position over night.
Man! I just LOVE watching real traders at work! 🙂
l sure do miss my posse trading days!
Right on brother!
I eat, breathe and sleep it.
It’s how I earn a living and my hours are long, but I would not have it any other way:)
This website is for educational purposes relating to Elliott Wave and natural cycles. I welcome questions or input about Elliott Wave, cycles analysis, or astrological input relating to any market. Due to a heavy schedule, I may not have the time to answer questions that relate to my area of expertise.
I reserve the right to remove any comment that is deemed negative, disparages the Elliott Wave Principle, is otherwise not helpful to blog members, or is off-topic. Posting trade specifics does NOT serve an educational purpose, is stongly discouraged, and such comments may be removed.
Want to comment? You need to be logged in to comment. You can register here.