
Cycles Update, End of Day, Friday, Oct 9
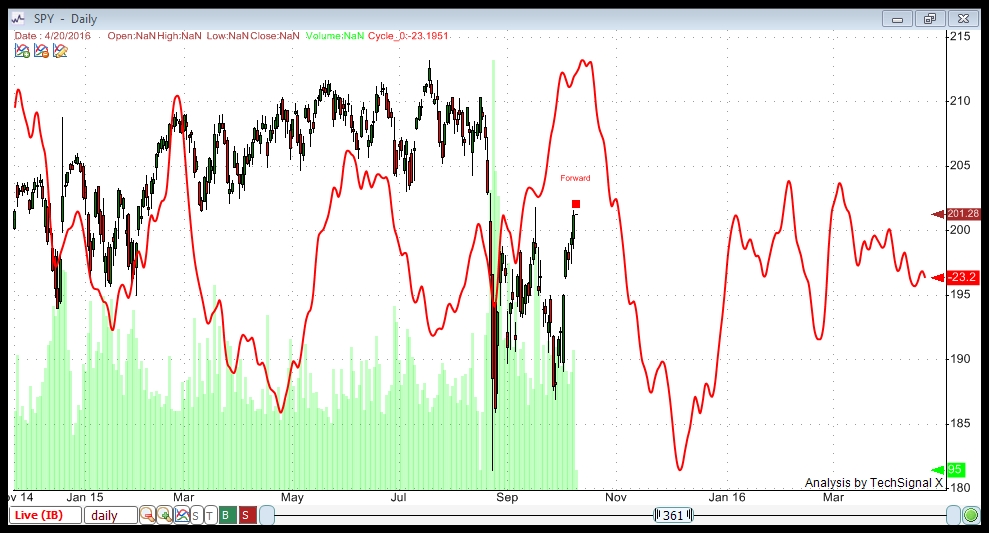
Above is a brand new cycles analysis showing a turn Oct 13/14 (measurement is quite accurate) and a bottom of a rather sheer wave down on December 7, 2015. The full moon is also an important date in the Puetz crash window. I’ll do a fuller update post on the weekend.
Here’s a more in-depth explanation of what this chart is suggesting.
__________________________
Update: Noon EST, Oct 8
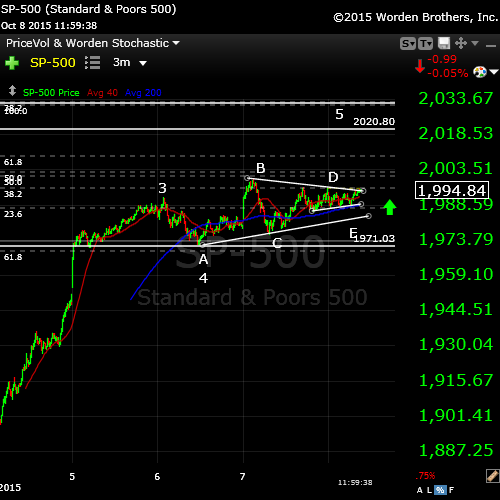
Here’s the triangle in the SP500. The E leg may have formed a triangle on its own (within the larger triangle), but be cautious here, as it still could come down to test the lower trendline (after I wrote this, I noticed we seem to now have cleared the upper trendline, so this is much less of an issue).
If it is, in fact, done, it will rise up to complete the 5th and final wave. Targets for the SP500 are 2020.68 (previous high) and approx. 2013 (62% retracement from the very top of the market). We are still completing a regular flat, which either goes to top of the A leg, or slightly above.
Similar levels for SPY are actually in reverse, as the previous high is above the 62% retracement level from market top. Previous high: 202.89. 62% retracement level: approx. 201.50.
Previous high for ES is approx. 2011.50.
__________________
Update Wednesday, Oct 7, 11AM EST – We look to have completed wave 1 of 5 in the SP500. Measuring this first wave and extending 1.618 from the bottom of the second wave puts us at about SP 2030 as a target.
Update Wednesday AM after the bell – We’re in the final fifth wave up. There are two main objectives now:
- the previous top at 2020.68 SPX and
- the 62% retracement from the very top of the market (at about 2031 SPX).
In either case, I think we’re looking at this whole correction being a second wave. As a result, it will be a very large downturn.
The Nasdaq looks like it may be stopping somewhere around here. This would put it into the third wave of the third when it turns down in earnest.
GDOW may be giving away the bigger picture, as it’s now moved above the 38% target and is on its way to the 62% target, which would also put it into a second wave position.
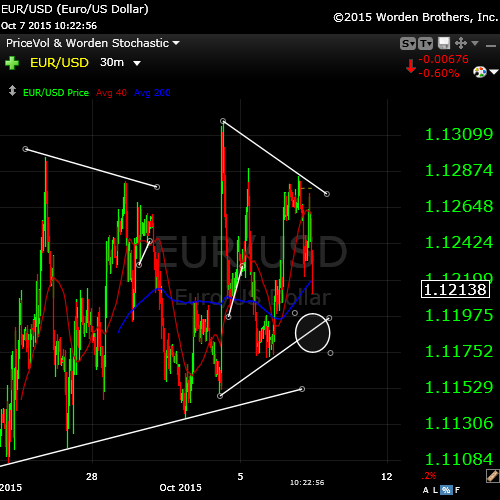
A telltale sign of the end in the US market may again be the EUR/USD, which has been tracing out a triangle. It moves inverse right now to the US market. I would expect it to finish the lower wave of the triangle as the market makes its top.
___________________________
Addendum – Monday night Oct 5
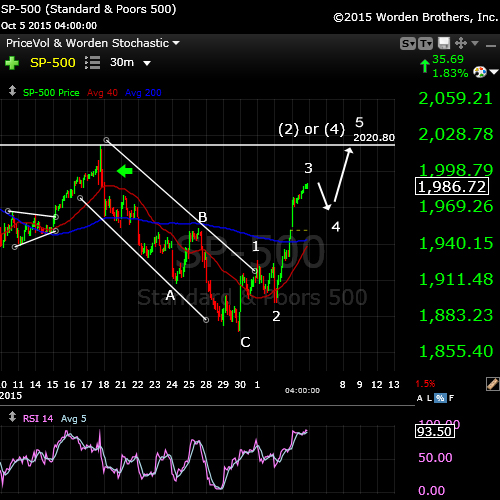
Here is the SP500 above. Based upon my scenario of an ABC down wave from last week and an “ending wave” up, here’s the expected path. Wave 3 in the SP500 is 1.6 times the length of wave 1. Wave 4 should retrace to the previous wave 4. Wave 5 should end at 2020, although it could extend higher to create a flat.
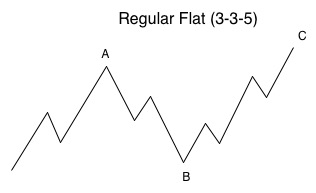
Any flat correction is in a 3-3-5 pattern. In this case, the B wave would have been the ABC wave down from last week. The A wave would be the pattern from Aug 24 up to the high.
In a regular flat correction, “wave B terminates about at the end or about at the level of the beginning of wave A, and wave C terminates a slight bit past the end of wave A.” If we complete a flat that goes to a slight new high, then this would have to be a larger 2nd wave and the downside will be much greater than a 5th wave. For example, the third wave alone would take us down to the low 1600s in the SPX. We would have a 5th wave after that.
___________________________
Original Post: Sunday, Oct 4: Today, we’ll start with the bigger picture. It’s important to revisit the daily charts every single day. So, my first chart will be a backed out view of the DOW.
If you’ve been a student of the markets for some number of years, you’re no doubt used to the fact that the market likes to race off to an extreme before quickly reversing and moving in the opposite direction, in some cases creating a new trend. That’s essentially what I’m expecting to happen here. I am out of the market and will be waiting for the top, which I think will happen this week.
It’s interesting to note that the 1929 market crash was in October (the high was the beginning of September, 1929), and the 2007 high was in October, as was the 1987 high. Oh, those darned cycles!
Back to the present. Having spent time reviewing the markets and my forecast of the past week, along with cycles analysis for SPY, I find no reason to change my forecast.
I tend to be somewhat of an Elliott Wave purist in that I drill down to the one minute chart, if necessary to view what’s happening at all degrees of the wave structure. It helps tremendously in accuracy. EW is fractal and if all degrees don’t conform to the rules, you have an issue with your count—an important lesson I have learned over time.
To review, I believe “the first wave down” was a fourth wave of this correction (an ABC wave down) and that we’re in the fifth and final wave up which should test the previous highs (in the case of the SP500, this is the 2020 number I keep mentioning).
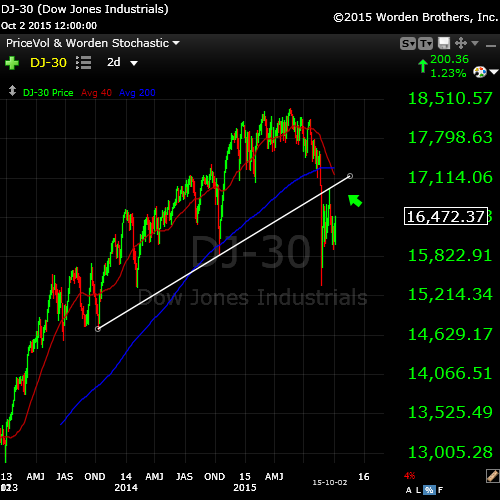
Above is a 2 day chart of the DOW. I’ve drawn in the trendline for the final fifth wave up. What often happens before we take a big plunge, is that the market heads up to “kiss” the trendline one last time before turning and moving in the opposite direction. Based on what I’m seeing in the shorter-term charts (the ABC wave down), this seems like the likely scenario to me. Cycles and history repeat.
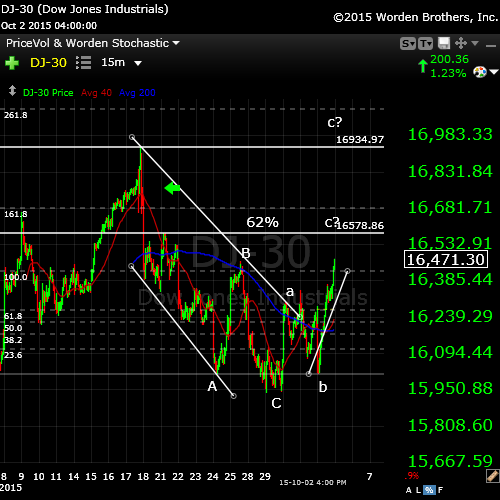
The 15 minute chart of the DOW. This is simply an update of my chart this past week, predicting the rise we’ve experienced in the last few days. My preferred count takes this wave up to a double top at about 16,935 before a major turn. Keep in mind that if my ABC count for the wave down is incorrect, the market could turn at the 62% mark or slightly above.
I have overlain a fibonacci tool, which shows that wave C, as it stands now, will exceed the 62% line if wave C ends up being 1.6 X wave a, which is a typical wave length. That could lead to a fourth and fifth subwave up to the previous high.
So, be alert to the possibility of a turn anywhere from the 62% line up to the top.
I have placed a green arrow on all these charts to show where we should have had a second wave, but where one does not exist, leading to my labelling as a 3 wave move down.
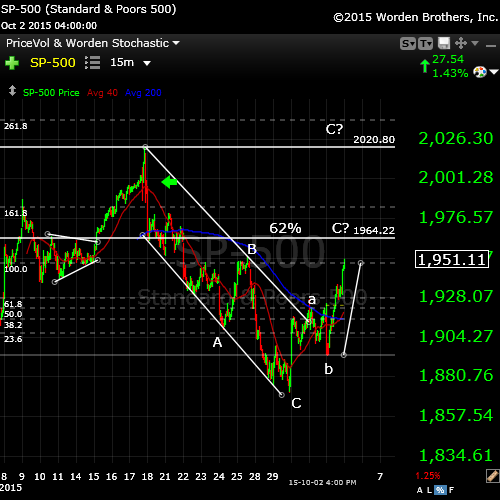
The SP500 (above) sports a similar configuration.
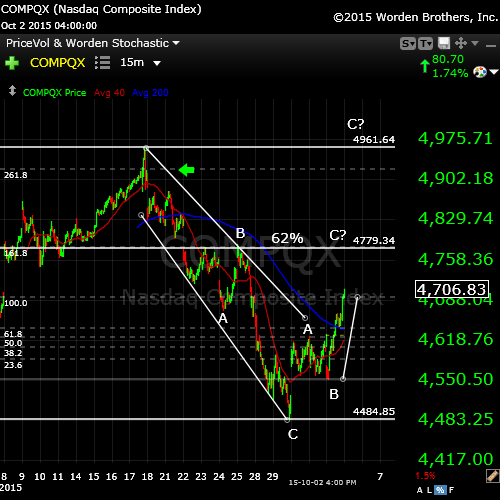
The Nasdaq above is no different.
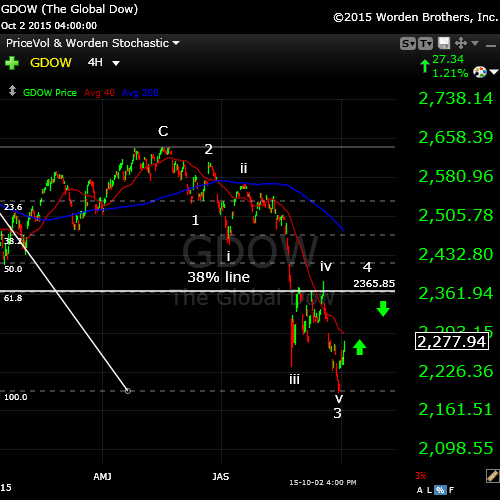
The Global DOW (GDOW) seems to be tracing out my previously posted count. I’m expecting it to rally to the 38% line to trace out a 4th wave before a turn down in a fifth wave, which should be as long as the first three waves. This would fit with the prognosis in the US markets.
Cycles Analysis
I ran this chart this morning (Sunday, Oct 4). I’m showing a cycle top of about the end of the first week of October.
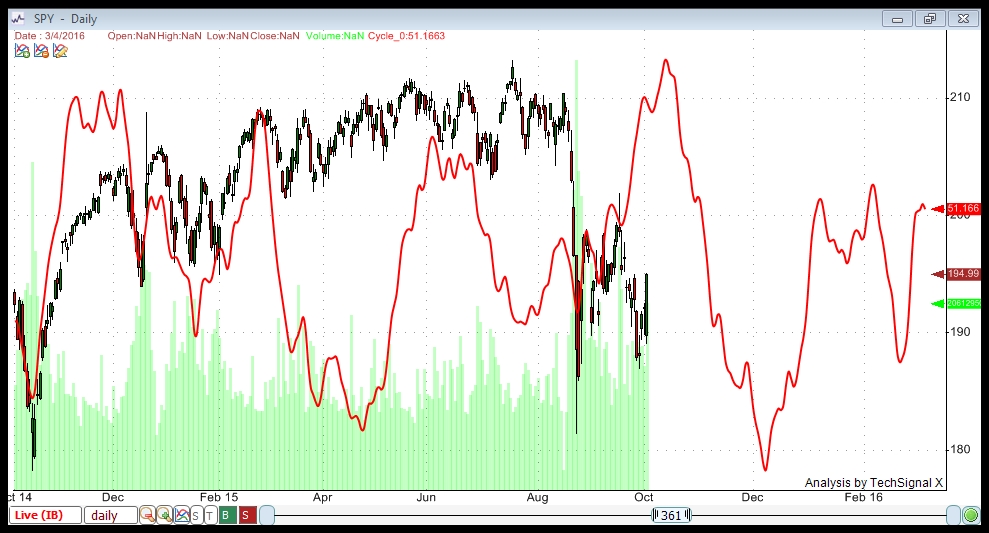
This cycles analysis uses Techsignal X from the Foundation for the Study of Cycles. I’m using data going back to 2002 this analysis of SPY (SPX) and displaying a compilation of all the cycles the software has found over that period. You can see how close-fitting it has been in the recent past. The fit with the current wave is quite stunning and therefore, something to pay attention to.
This analysis suggests a relatively strong positive bias to about October 6.
_______________________________
The Panic Phase and the TPD (Turning Point Distribution) Principle
The TPD Principle describes a period in time of several weeks in which an array of cycles congregate, including gravitational, geomagnetic, and nuclear. It’s around this time that markets have historically topped. I was asked to include a reference to this in today’s blog post, which I’m happy to do. This principle generally refers to market tops (which we’ve already seen on May 20, 2015), but it’s interesting to note how many astro events we have occurring over the weeks surrounding the upcoming major turn in the market.
In his book, “the Universal Cycle Theory,” Stephen Puetz writes, “The TPD principle involves the eclipse cycle as well. The eclipse cycle normally peaks on the first new moon before a solar eclipse. Following that reversal point, it takes six weeks for sentiment to shift from euphoria to panic. Then on the first full moon after a solar eclipse, a panic-phase begins. A panic phase usually last two weeks—ending at the time of the next new moon.”
The dates:
Aug 14 , 2015 – First New Moon before the Eclipse (there is a New Moon happening at the same time as an Eclipse—Sept. 13)
***Aug 29 – Full Moon before the Solar Eclipse (peak of the eclipse cycle)
Sept 13, 2015 – New Moon and Partial Solar Eclipse
Sept 23, 2015 – Fall Equinox
***Sept 28, 2015 – Super Blood Moon Eclipse (start of panic phase)
***Oct 13, 2015 – New Moon (this would mark the end of the panic phase) – six weeks after the Aug. 29 full moon.
So … there’s a lot happening in the area of cycles right around now. Couple this with an ending diagonal Elliott Wave pattern and hitting the 62% retracement level and the period between September 28 and Oct 13 starts to look important to a possible major market turn.


Very good ……n
The futures have stopped right at 62% and judging by the wave structure, it looks like we’ll turn here and head down.
Thanks Peter,
What is the best indication that this count may be wrong and we will head up to 2020?
If your current count is correct, would it mandate a down close today on the first wave lower?
The futures over the weekend part is confusing to me. Does the SnP 500 actually need to make it to 1964 (62%) to satisfy your analysis or has the futures action done all the validation needed?
I maybe don’t understand the question, but the answer seems obvious to me. If we don’t turn down here, we’re going up.
In EW, we generally look for a first motive wave down (in 5 waves) and a retrace of 3 waves to 62%—at smaller degree (say, the 5 min chart). So that’s the safest place to get in. EW is fractal, so the same structure happens at multiple levels.
All the indices should open at 62% and head down. They should all satisfy that criterium. The futures are just the leading indicators, as they’re all that’s open.
Makes sense! thanks.
Ok, this is what I was getting at! We are open now for 7 minutes. The SnP 500 is at 1970 which I would think is significantly above the 62% level. Is this throwover enough to assume the move to 2020 is on? thanks..
I ask because anyone wanting to get onboard for a really profitable trade, needs to be in early and in the correct direction. A move to 2020 from here is a huge gain. As well as a short and new move to August lows.
You never trade the first 15 minutes. The Nasdaq is not at 62%.
This is going to be a huge move. Relax. You don’t need to be in early. That’s why I gave you to optimum entry point.
Maintaining shorts for now.
Hi all,
I feel like the top is nearby. I bought some put options for the AEX Index (THE Dutch Stock Exchange).
It looks like S&P can go to +-1970 to finish an ABC.
Cheers,
W
I understand your sentiment about the first 15 minutes. However, lots of people trade the Globex which means they are already in at the open. Properly trading economic news items like on Friday can be wildly profitable. Especially when the Bond traders telegraph the equity futures moves in advance…
From a fundamental perspective, I have a gut feeling something international (China / Russia in Syria is going to trigger wild volatility in equities / oil /metals.
This is shorting. You only want to be in early if you like pain.
Joined Dave in the short side. Around 197.5, bought spy puts.
Drilling way down to the one minute chart, this looks like a final fourth wave to me. Nasdaq isn’t quite at 62%, so we’re waiting for it. Once it’s there, I would expect a turn, as all the other indices are there. SPX is almost at 1.618 X the A wave.
Hi Peter.
With Apple red I’m not sure to see NQ very green
In my experience, all the indices have to make 62% (NQ already there, of course), but Nasdaq still a few dollars short. The 62% level for it also puts the C wave 1.618 x the A wave.
If it’s the final fourth wave where do you expect the fifth?
Hopefully my Nasdaq comment also answered that question. Not very far away.
Well do you mean the fourth of the C wave up?
Or the fourth of higher level?
C. I’m still on a one minute chart … haha.
4779 for Nasdaq is the target (or close).
Tick tock it must do it now 🙂 because European markets close soon and Andre said lunar degrees cycle predict a turn then.
If we turn here, we’ll be heading to the low 1700s in the SPX at least.
Ohh I love a good bearparty all those faces on the floor turning white big headlines
End of the world….
https://www.google.nl/search?q=bearmarket&espv=2&biw=1366&bih=667&source=lnms&tbm=isch&sa=X&ved=0CAcQ_AUoAmoVChMIkMCxhc-ryAIVYSlyCh3QqAIX#imgrc=2EtRBO8KNNxTmM%3A
http://ibankcoin.com/bluestar/2015/
Exactly. 1986 is the point at which wave C of SPX is 1.618 X wave A.
No, the reversal is certainly not for today.
When the market progresses like steam roller – slowly but surely all the bears step aside waiting for the end of injection
Really amazing to watch the Dow / SnP steadily moving up while Nasdaq is crawling past 4770. It took Nasdaq until 1:30 to get back to the high it set at the open. Will we make 4779? Currently 4773…
Almost there. ES gap 1976.54 to fill is also near.
Sorry, ES close 1976.75.
Yeah, it’s an amazing move. There is a part of me that wonders if we’re going to turn down in a 4th wave and then do a fifth up to the top (SP 2020), as per my preferred count, but the Nasdaq is so much weaker than everything else. In any event, we should turn down as everybody reaches their respective 1.618 x wave A targets.
A larger move up would have to be left to the futures overnight, so we’ll see what happens here as we get closer to the end of the day. We would have to come down first and then go up. The alternative is that we head straight down.
Peter,
What if this is going to be a repeat of Oktober 2007?
Or do you think that this is not possible looking at the wave structure now and 2007?
Thanks
John.
There is also alternative to continue go up like a steam roller.
SPX has gained already 5% from yesterday low without any significant retrace
SP500 has just passed the 1.618 X wave A length, so I think my preferred count is in play. We indeed could go straight up, but then it’s not an ending wave (which should be in 5) and I have no clues to suggest an end point other than the previous high at 2020.
We just have to wait to see what happens.
WE could go into a fourth wave here. Of the C wave, the two legs in futures are equal. If we do a fourth wave, then likely we have the fifth tonight or tomorrow and test the top.
The Nasdaq has reached its target …
This market is irrational.
When it is irrational it’s absolutely unpredictible and can be like that for some time but can roll over any moment
Well, I wouldn’t call it irrational. We’ve had three waves down and that means we have to retrace to the top. That’s the count and what I’m sticking with. The alternate was to turn over at 62%, which didn’t happen … obviously.
The Nasdaq, however, seems to be doing its own thing …
Even so, it could catch up.
Do you think that we are condemned to go up to the top or we may turn down any moment?
I think we’re condemned to go to the top. Three waves down must be retraced. Unless it’s a truncated wave, and although I’ve heard of them (EWI keeps talking about them) I’ve never, ever seen one …
For you the market is like a painter who doesn’t liked the drawing he has done. So, he throws it away and begins to draw a new one from the very beginning
I don’t know what this means.
I’ve had this count since September 26. I’ve explained it over and over.
https://worldcyclesinstitute.com/a-renegade-count-apparently/
https://worldcyclesinstitute.com/the-enigma/
https://worldcyclesinstitute.com/remembering-the-bigger-picture/
Sorry, Peter,
that was a joke
Apologies if I took it the wrong way. It’s a tough market, but based on my experience, we have to test the previous top (and could go higher).
I seem to be the only one who thinks so, lol … I see the EWI folks have been talking about this being a second wave for as long as I’ve been saying it’s three waves down (and I keep getting questioned about these missing waves .. ) I seem to be “bucking the trend” of what everyone else thinks …
I’m also expecting the GDOW to retrace to 38% and it’s almost there.
Just trying to keep everybody safe …
Peter,
what do you think about the way we go to the top?
We’ve taken 90 points without any retrace bigger than 5-7 points.
Are we still in the 3rd wave of C ?
Should we make any significant 4th?
I would expect a 4th wave tonight because I can count 5 waves of C. It should retrace 38% of the entire length, really, which would take it down to SPX 1943. That’s if it’s a 5 wave ending wave. The fourth wave of 3 is at about 1970, so depending on whether the wave is going to top at 2020, or going higher, it could also just drop to that level.
I’m inclined to just let it do it’s thing … and stay away. But if you’re nimble, there could a good short trade tonight.
But if it is in three there shouldn’t be the fourth wave.
It has done already three waves and should simply turn down in the 3rd of 5th
That’s if this wave is a second wave and if the first wave down was in five waves. My count says it wasn’t (that it was an ABC wave down) and that we should get 5 waves up to retrace to the top.
This is what my count for the past week has been suggesting.
The second wave idea would only happen if my count was wrong. So far, it appears to be right. I see EWI is rethinking their count tonight (good for them … haha … but I was there a week ago!).
If you look at the first chart I posted last night – of the DOW, where I suggested we were going to do a flat (to kiss the previous high, or trendline), that’s the scenario I’m expecting.
To get there means we should turn down in wave 4 tonight and then go up in wave 5 tomorrow (a bit of a guess at this point).
Dmitri,
I added a chart and explanation to the post, which I hope will help with what is difficult to explain in a comment.
Peter,
if it goes in the fourth wave it should retrace to what level?
we only have 3 waves down from the May top.
we are in an inverted crash cycle and the market momentum
peak should come Friday- Monday yet that is the momentum peak not the end of the puetz window .
we are now testing the Dow projected price range which should have come Friday . I would assume today was a catch up day .
higher prices should follow into Friday- Monday .
Joe
Peter
food for thought , the 1.618 extension is somewhat of a myth .
Many times when a 3rd wave or a C wave goes beyond the 1.618 extention it will go to the 1.382-1.854 range . additionally if that extended range is seen in wave 3 then wave 5 will end near the 3.618 extension
example wave 0 to 1 = 10 points wave 2 low at say 3 , wave 1 at 10 pts times 1.618 and 2.382-2.854 , if the 1.618 extension is taken out you look for the 2.382-2.854 area to be hit in wave 3 ,wave 4 would then bottom near that same 1.618 extension and then wave 5 would be near 3.618 times wave 1, plus wave 2. lastly while rare the 3.618 extension in wave 3 targets 5.618 in wave 5 . those are rare but I’ve seen them work many times , the 1.618 extension gets taken out very often and the 2.382-2.854
extension for wave 3 or wave c is more the norm
It was a productive day for the bears thanks to the biotech stocks. Joe, your inverted crash cycle is interesting but bad news for my spy puts.
Still short. I am not buying this BEAR MARKET Rally. Will remain short til tomorrow afternoon. NOTE TO SELF : NO FULL POSITION GOING INTO A WEEKEND. Rookie mistake.
$SPX, $SPY closes at 1987 in October. Doesn’t get any scarier than that.
What I’m having the biggest issue with (and I’ve mentioned this before) is that this entire mess of a wave from August is now too long to just be wave 4. It could be a second wave. SPX 2020 is exactly the 62% retrace level from the top of what we’re calling wave 3 down. The outcome is the same, of course, because whether we’re going into wave 3, or wave 5, there will be two very large waves down.
Frustrating market, for sure. It’s not clear-cut. We haven’t had a complete set of 5 waves down, so there’s no confirmation of the trend.
Peter, How would you respond to the following here ? What level for sp do you see if we are indeed finished A and now going to B wave?
The August 24th low held, we experienced a full “B” wave, and now we are heading toward 2020 in my “C” wave … though it will not be a straight line there because the “C” wave will itself ABC, with “A” having ended today. Thks Peter
Rather than write this out here, I’ve put a new chart at the top of the post showing what an ending wave would look like. The entire pattern from Aug 24 could also be a regular flat, which would mean the C wave (which would be in 5 waves, as I have shown) would go past the top of the A wave, which is at 2020 in the SP500.
Because the B wave down last week is an ABC wave (or at least I believe it is), these are the patterns that would be expected.
Thanks, Peter,
what 2nd do you mean when you talk about “larger 2nd wave” in your explanation?
I thought we are eigther in the 4th since 24 of August or in the 2nd since 30 Sept
The consensus has been that we saw wave 3 down from the top of the market and that we’ve been in wave 4 since August. However, we could just as easily have had wave 1 down and be in wave 2.
I think there are more reasons to suspect the second scenario.
Wave 4 should take a similar length of time as wave 2, but it’s now taken much longer, particularly if we go to a new high at 2020 SP.
Wave 4 has also retraced to 62%, which is a normal retracement level for wave 2. Wave 4 usually retraces only 38%.
Wave 4, if it ends up being a regular flat, going to a new high above 2020 SP, would be a pattern that’s usually attributed to wave 2.
I’m leaning much more to this being wave 2. Which means we would have wave 3, 4, and 5 down still to go. But let’s see where the wave we’re in goes before getting too much ahead of ourselves.
In this case the downside would be tremendous
Well, yeah, because wave 3 would be 1.6 times (at least) X wave 1 down and then you have wave 5, which would again be about as long as wave 1,2, and 3 combined.
So … keep the powder dry. It’s more important to be ready for the drop than to play these little ups and downs, imho.
Plus, you saw how the first wave came down from the top. If it was wave 1, wave 3 should come down much faster.
Goodmorning ,
Peter,
I also follow MC Hugh he is on the same path like you with the wave count if we go beyond SP 2020.
If this happens he considers this also as a wave 2 and the third wave will likely take us down till 1500-1600.
Good to know. Thanks, John.
And with that in mind, I expect to see a good-sized fourth wave today. And then up tomorrow, perhaps to a high.
I thought we already did that in the futures..
I’d call that “essence of 4th” and we have none in cash.
Oke thanks.
Well, that’s what I thought, anyway …
How deep may go this Fourth wave?
Normally, I would say ES 1937 … lol … that should still be the case here.
I don’t think this is going to be particularly deep. I think NQ should get to 4250, the fourth of the third, but beyond that, not so sure.
I count 5 waves down so I think this 4th is just about done. The shallowness bodes well for us topping in the 2020 area rather than much above it. We’ll see.
That’s better! Hopefully, Dave will get some relief today.
I have got such a feeling this goes much higher first it will blow it self up..
Or maybe this I hope so for Dave and myself ……
http://time-price-research-astrofin.blogspot.nl/search?updated-max=2015-09-28T07:50:00-04:00&max-results=20
When ever I make a trade, I always have a plan (B) if I am in correct. If the sp does head up to 2020 on me with being stuck at approx sp futures 1940. I would buy some puts at that level. When ever I make money on any trade, I always put the money in my rainy day fund. (Pay Myself fund) Those funds is where I would use to buy the puts. I doubt the sp will get their thou in the near future.So over all, I have no anxiety whats so ever at this point.
Good luck every one.
I’ve added back to the bottom of the post the Puetz crash window info just as a reminder of where we are in the cycle.
Well Peter,
Thinks have to move quickley if I look at the timeframe till new moon.
We’ve come 97 points in two days. We have 50 more to go to 2020, so I think we’re OK.
I would say we are in the panic buying phase since the 30 of September.
LOL
Peter,
you mentioned a retracement from last nights high to ~ 1937.
Is that still in play?
“Normally, I would say ES 1937 … lol … that should still be the case here.”
No, I mentioned in a recent post that we’re likely done the 4th. There’s a law of alternation that suggests if you have a deep second wave, you have a shallow fourth, and vice versa. This also bodes well for a top at 2020 rather than too far above it, imho.
Sorry, not in a recent post, I mentioned in a recent comment. I don’t remember who asked be about GDOW (was it you?). It’s almost at the 38% retrace level and should turn down there.
This gets confusing!
If we’ve finished the forth, how come we are going lower?
The DOw was up 50 a few minutes ago and now its only up 12.
the SnP is down 9 !!
Peter,
the wave down today in cash was in 5 and it was retraced up to 62% in 3 and turning down now
Cash came down in 3 (not a motive wave). I’ll agree with your read on the wave up.
If you have any concerns about that look at SPY, DOW, and NYSE.
These retracement levels are really interesting!
The Dow has made a 100% retracement (16,934).
The Snp has gone to the 1.618 level on the chart at the top (1997).
Nasdaq has made a 62% retracement (4779).
all pretty much at the same time.
I added an update a few minutes ago to the top of the post. So far as expected. It remains to be seen if we’re going to the 62% retracement from the very top of the market.
I added a short update at the top of the post.
Added a chart to the update.
Peter,
What is your idee or time frame when we reach this target (2030) can we go back and forward for a while or does it turn quickly?
No idea on time. Today or tomorrow. We seem to be running out of steam, so more likely it could be tomorrow morning.
It will just run out of gas at one of those targets likely … at about the time the bulls’ egos are at their largest.
What we’re ultimately looking for is 5 waves down at small degree and 3 waves back up to 62%. If we turn there, we’re done.
I am watching this latest wave down as a good candidate, but I’m expecting to see the full five waves up to a final top. We are running out of steam fast.
This 2011 vs 2015 cycle correlation is stunning!
It would suggest a reversal today or tomorrow.
http://www.screencast.com/t/jx56yfwQIeS
As I mentioned the other day, I fully expect some international incident to kick off a reversal. Actually the downturn may happen just ahead of an incident. Peter, correct me if I am wrong. When this wave down you are looking for starts, it will be swift and unmistakeable. Correct?
Events don’t move the market to any great degree. It’s the other way around. Pundits are still scratching their heads about the labour report … haha.
We will just run out of buyers likely. You want to watch for five waves down at small degree close to the targets I mentioned. This looks like the second wave of the fifth, so we have 3, 4, 5 to go. Nasdaq looks like a small 4th wave so far.
We look to have completed wave 1 of 5 in the SP500. Measuring this first wave and extending 1.618 from the bottom of the second wave puts us at about SP 2030 as a target for a top.
Sold half my shorts down at the 1969 level. I will keep the other half for now. My worst trade of the year. Wiped out my gains from last week. Good luck every one.
You will more than make up for it shortly.
Sold the other half and went long here at the 1971 futures level.
Russian airstrikes destroyed weapons depots of Liwa Suqour al-Jabal, a U.S.-trained Syrian rebel group – Reuters
This was when the sell off occured. LOL I know Peter, it was already in the waves.
Well, not in the wave, of course, but international mood has turned decidedly negative.
So from a spiritual point of view it had already entered the unconscious mind of the herd that caused the sell off
I will meditate on that and look at the planets
Be careful mercury is still retograde
Here’s that 2000 contract sell order that chased eMini down at 10:51 $ES_F pic.twitter.com/lurKC2ejai
— Eric Scott Hunsader (@nanexllc) October 7, 2015
We may be setting up here to head down to 1960 ES to complete the fourth wave. I count the wave up in 3 waves.
Looking at the bradley the move from Sept 29 till now (inversion in the graphic) was spot on it turns flat and turns tomorrow /friday .
So that’s what we are looking at.
Rally at the start of the day and fade away.. after that next turn is around Okt 20
Let’s see what happens here …
If we go to a new high, I could also see this being an ending diagonal …
Backing out the charts to 30 mins, I can put the Nasdaq in a large triangle, as well as the SP500 and NYSE, but not the DOW.
Well, actually, I guess I could put the DOW in one if I start the downtrend line at about 17,560
I don’t have much of an idea why we’re stopped. The 62% retrace line is at 1990 SPX. The wave down could be in 5 … market is not helping with any clues.
Sold half position at 1984 futures. I will keep one half for now.
Bought back my other half at the 1979 Futures that I sold out at 1984 level. Full position long.
I’ve added slightly to the post. It’s getting late in the day, so I suspect we’ll continue this triangle into tomorrow. This may just be a running triangle, which could then end in a fifth wave up to the previous high.
Sold one half at 1984 Only a 5 point gain.
The other half was sold for 13 points. From approx 1970 to 1084 futures
I’ve posted a chart of the possible ending diagonal on ES.
I am completely out. Sold the other half. 1985 futures
There is nothing about this market that I find enticing.
If this is a triangle, we should have one more leg down and then a leg up to a high. We only have ABC at the moment.
New chart on the post of the SP500 with a triangle forming.
Peter,
I’d say wave 3.5 just ended with some kind of ending pattern in 5 small waves.
I guess we are going to my 2040+- as I have been saying all the time (yes I know, it didn’t happen at that time, only 2011 was reached) with the overshoot possibility to 2070+-. My guess would be tomorrow hard down to make wave 4 38,2% at 1950 (of course 23,6% is also possible, targets will go up if this happens), than wave 5 (161,8% * wave 1, else 100% = 2018 or 127,2% = 2035) 2060.
The market is really really really weird. We might still be in a VERY COMPLEX wave 4 (in EW terms, WAY TO LONG IDEALLY, but can be because we just ended a multiple year bullmarket and people still think the only way is up!!!) of the big wave 1, so 5 will come after until the end of October (28?) I would say.
AEX target looking at harmonics = 446-458+- so my guess would be 460 (gapclose). So we go hard down first (to 435?) tomorrow morning so that we go even harder up later the same day and Friday.
That is it for now people. Just to be clear, I talk about the S&P 500 future chart (ES).
Cheers,
W
Cheers,
W
I’ll stick with my forecast, thanks … haha.
Please do Peet since you are way better with EW than I am. 😉 I am just trying to explain in EW terms, but of course you know that I use other stuff as well. 😉
Cheers,
W
Your Oct 28th thru the 29th, is very interesting. I have as the most BEARISH day of the month.
I also have Oct 16th as the 2 nd bearish day of the month. I will bring these dates up as we approach them.
From today on till monday the 19e I am bearish.
Peter,
the high was on 19 of Mai at 2137 and the low was on 24 of August at 1834.
So, 0.618 retracement gives me 2021 – precisely what we’ve done on the 17 of Sept.
What other 62% retracement are you talking about?
I have the low (and so does Google Finance) on Aug 24 as 1867.01
If you look 5 min chart it was in the first 5 minutes after the NY open.
SPX has opened at 09:30am at 1872, then has made the low at 1834 and at 09:35am was still at 1839, but rebound in the next 5 min. to 1870
Can’t help you there.
Dave,
Oct 16/19 is also important for me yes! I would say we go for a low, but it is hard this market… Than some retrace back up and hard down again till 28/29 Oct.
John,
What is your estimate for the AEX? I wanna see 39x at least to complete wave 5 down (if my complex wave 4 i(we are in C now) is correct of course).
Cheers guys,
W
I don’t know let’s wait and see..
Went long this morning SP 1982 futures full position. I suspect short term trade.
If we do not head up here shortly, I will bail on this trade. SP futures at 1983 at the moment.
Sold half position at 1989 futures
Sold out completely, last batch sold at the SP futures at 1989. 7 point gain
Note to self: look at my own turning dates, but use Peters price levels. ^^ No dropping down to 1950 for now and the AEX only reached 438 today…
Cheers,
W
The market has done in futures the E of the triangle and has rebound to test its upper board
Short update at the top of the post. Targets for SP500 and SPY.
I would love to short this market. But you never short a quiet market. If my indicators change, I may short it a little later in the day. Good Luck every one.
If we get a retrace of today’s highs, I may short it. It is very dangerous to short a quiet market. But with the fed giving their up dates at 11;00 I may go for it.
Fed meeting at 2:00 NOT 11:00 11:00 west coast time.
To all,
My system tells me we will top tomorrow. One more last push up and than time for a BIG WAVE 5 down till the end of October. This was some kind of flat wave 4 if you ask me. Looking at the action today, I agree with Peet on the 2020.
Cheers,
W
Bought one batch short SP futures 1988
So Dave,
You don’t think we will see a final push to SnP 2020?
Hi Gary, I do not believe so. GL
I don’t either,
Take one more close look at the chart attached at link.
Look at the dates.
http://www.screencast.com/t/jx56yfwQIeS
Gary my next severe correction date is very close to the Oct 22nd you have on the graph. My date is for Oct 16th
Gary, I am not looking for any crash right here. Just a retrace move down from here at the 1992 level. I would happy to see it move down to the 1970ish level if that should occur.
I should have said, I do not believe we would see 2020 FOR TODAY
Because the fourth wave triangle was a bit “muddy,” it’s difficult to project an end to the third wave of the fifth (the one we’re currently in). ES is a bit clearer so I’ll take a stab at 2006ES and the counterpart of 2014SPX.
It looks probable to me that we’ll finish up overnight or early in the morning tomorrow.
2nd half, short for full position. Bought 1992 Average price for the two at 1990 futures.
I had to sell out at the 2002 futures 12 point loss
That is a shame Dave.
This may well be the last push up here before Peter’s target.
I still think we will fall short of 2020. Although we are at 2017!
Peter may show a count that finds that acceptable.
No, I’m projecting 2031 now, based on the length of the third. The fifth of fifth is usually the same length.
This should be the end of the third in ES, I would suggest a drop now to about 1986.
That 2031 is in the SP500.
Normally, they should fight at DJ to protect 17.000 at the close.
There was the fight at every hundred points
I will be shorting it again shortly
1/2 batch short a the 2005 level futures
Dave,
I shorted ES at 2008. This fourth wave should retrace 38% of the entire move up from the previous fourth, which is actually about 1990.
Then we’re back up to 2031 to finish off. Those are optimal numbers. We’ll see what happens.
We’ll come down in 4. The final wave up will be in 5.
Sorry … down in 3 … haha.
Peter,
Here is an interview with Stan harley explaining his cycle work.
http://www.wor710.com/media/podcast-financial-quarterback-josh-jalinski-financialquarterback/financial-quarterback-91915-26364180/
Thanks, John.
I won’t get a chance until the weekend.
It will stay there so pick your time but I m sure you will find it interesting to listen to the method and calculations he makes.
I think tomorrow the Top has to be in looking at the bradley.
If you want to skip the intro,listen from minute 42 that’s where he predicts his next low
Funny I did not know the date!
I wrote on this blog Okt 19….
He is a good ranked high on timer digest many times so I advice you to listen yhe hole interview.
Good luck..
Incredible rally.
The news coming from bad to worse, profit warnings, earnings reduced, emerging and commodities at the floor.
And with all this market takes 8% in one week
Black swan wanted urgently
Peter,
are you still playing this fourth wave?
What is your invalidation level if we continue to extend higher instead of retracing?
Hmmm. I just walked in. This could be just the tail end of wave 3. In ES, I’m likely out at a new high. But it should correct.
RSI is suggesting we’re going to roll over.
Just made a new high
The day they decide to roll over they will not whistle on the top
Ok, ES has tested the high of the 17 of Sept at 2011
And we have hit the SPX 2020 objective!
Please look at this strange anomaly. I can go back for days and not see the erratic lines you see at the right of the image. I have no idea what it means. It is from a Stochastic.
http://www.screencast.com/t/kN7Y5dAYlYi
Seems like somebody injected by portions
Based on the current action and the anticipated top at 2020 along with the cycle projection for a high here until Oct 19, this is a “less risky” point to go short with a firm stop just above today’s high. Since the decline is under way, I am trailing a stop. so far so good : )
Let’s see the first wave down.
They don’t like to go down directly.
They should make just make the retrace before to go a little bit higher
The safe place to enter is after 5 waves down and three up (62% retrace).
They should first break down 2000SPX and 17.000DJ.
I don’t think they will arrive to do it from the first time
Yeah, the retrace last night was tiny, so I suspect we’re going to finish up at 2020.
Peter, when you say “finish” do you mean we may start the wave down from here? Or 2031 may be next?
Thx…
Looks to me like we’re ending here. I see what could be a wave 5 of 5. Everybody, including the NYSE seems to be at a logical place for a top. They’ve all exceeded previous highs,except the Nasdaq which seems to be doing its own thing …
Thanks Peter, from an EW standpoint, the initial reversal should get pretty impulsive to the downside based on the completion of this 5th wave correct?
Otherwise another set of waves up to complete 5 to 2031 could be in order?
Yes. I honestly think this is it. We would have had to have a really good correction last night to shoot up much further I think.
Impulsive down is what we’re looking for. A double top at 2020 would also do it for me, with the same on ES, NQ, etc.
Peter,
how do you see the wave Five you’ve been waiting for?
Yes, could be the wave up this morning and we’re simply doing a double top.
It’s rather shallow, isn’t it?
This looks better here on SPX … the first wave up to today may have been 1,2,3, with a large fourth and now a fifth with another fourth that’s struggling. Hard to tell cause I’m looking at tiny waves at this point. I don’t see any waves in 5 down yet. I’d look for a double top here, but would want to see ES finish up at the same time.
ES has toped at 2011 this morning
Looks like a 5th of 5th of 5th in SPX.
double top coming in ES, I think …
We need to suck in just a few more …
This seems like really erratic inconclusive action!!
It’s just trying to make a double top. You can’t start an impulsive wave down in 3 waves, so it has to be a fresh start. And everyone’s trying to go it at the same time. As long as we don’t go to a new low, it’ll get there.
Dropping below 2008 SPX (the previous 4th wave) is a good indication it’s all over.
Should be some kind of distribution after 8% rally
The Nasdaq and DOW look like they need the 5th of 5th of 5th still to go … one more tiny wave up.
Peter, when looking at it as you are it is a process unfolding. Pretty amazing!
Peter,
that’s what I’m thinking too.
They need to make at least a marginal new high
Yup. yeah, it’s always amazing. You don’t think they’ll get there, but they always do … and then all hell breaks loose to the downside.
All the waves of 5 up need to complete.
I still only see waves down in 3 … it’s a vigil 🙂
I think the big guys will take today some money off the table but will not push the market.
At the same time the algos will keep the supports
No more will happen today, I don’t think, other than to maybe begin the final wave up. This appears to be a larger fourth wave we’re finishing now, so we should be one more set of 5 waves up.
It looks to me like it will take everything up to the 62% level, which means when we turn, we’re going into the larger wave 3. The entire correction from Aug 24 would be wave 2 – why it’s taken so long to conclude.
I really appreciate you analysis Peter!
The last time I was into EW was in 1981. I spoke to Bob Prechter over the phone a few times. He ruled the market back then. His calls for a bull move from 1981 to 1987 were epic. The crash call was amazing !! When he was on FNN (CNBC now) he literally made the market fit the waves. It was crazy. What happened after 1987 I will never understand, He called it a Grand Supercycle top. That was it. The Dow was supposed to go down to 160. I lost interest after that. Since then EWI’s calls on gold have been dismal… Enough of that!!! I choose to remember his brilliance in the early 80’s…
Since your SPX 2020 call appears to be valid at this point, do you have a preferred target for the 1st wave lower?
Thanks again…
Thanks for the kind words. I actually talked to Bob last week or the week before and told him the market was going up … haha … he didn’t expect that. They were focused on going down (it was the abc down that I called that EWI thought was a motive wave). I think the issue is his people. I find them quite biased and bit sloppy, unfortunately. And you can’t be sloppy with EW … it will bite you hard! lol.
I will post on the weekend. I can’t really give a length for the first wave, as the first wave is always the unknown. After you get a first wave down, you can define all the others (their possible distances and ratios, at least). But I can extrapolate to some extend off the first set of waves down.
There’s also a question as to whether this correction is a fourth wave or a second wave. I think it may be a second, but then NYSE has only retraced 50% from the top. So there are some issues here, for sure.
Hmmm. SPX is setting up for a wave up. We may not be out of the woods yet. So is ES. Be careful. If we stop at 2020 on the way up, great. If we keep going, we may yet see that 62% level at 2031 or so SPX. Also the Nasdaq is sitting in a weird spot and may need to get up to 4961 or so.
SP500 has come down to form a double pronged second wave, which could lead to the third wave up.
Great short setting up on DIS I just noticed …
Or, SP500 is setting up a larger 4th wave (just coming down to previous fourth) and we’ll see a larger fifth up to the 2031 level. In any event, no motive waves down that I can see so far …
Yup, I’d say we have one more set of waves up, which will take us right through the weekend and maybe Monday. The bulls have control just a little bit longer. I’d be surprised if we stop at 2020.
OK … so I may have spoken too early. I’m now back on the fence with the latest move in the SP500. I’m looking for 5 down here and a 3 wave retrace to 62%. Hard to pick out to wave structure on a 1 minute chart …
The drop in the SP500 spooked me but I think we’re still pointing up. Will just take a while to turn around. We haven’t broken down technically.
Gary,
Just to append my previous comment. Based on us having to do another leg up, I may do a brief post on the weekend.
You asked the question re: an order of magnitude for the drop. Based on all the indices finishing another wave and going up to the 62% retrace level from the top (which would make this the second wave), the drop of wave 3 through wave 5 would take us below $11K in the DOW.