
Update Friday, May 27: Before the Open
US futures have all done double tops (SPX did so yesterday) so we’re all lined up for the fourth wave drop.
USDJPY at an inflection point. Watch for a big drop very soon.
USDCAD and EURUSD continue on to their targets, as does Gold.
______________________
Update Thursday, May 26, At the Close

Above is the 60 minute chart of ES (SPX futures). Not much change since this morning.
I’m showing the path so far of what I would expect in a “normal” market, which this is anything but. Because of the structure of this wave, it’s making targets difficult to identify specifically. The internal waves in futures near the top of this third wave are really cluttered. This morning, we appear to be dropping in the fourth wave, which makes the third wave a little shorter than expected (we often see this at market tops).
In any event, we should eventually see a wave 4 to the 38% retrace level (about 2066) and then a final fifth wave up. Wave 5 may be shorter than the projection here, but at 1.1618 X wave 1, I put the top at 2120 max. Nasdaq, SPX, and DOW show similar configurations.
Even though the underlying structure of the 3rd wave up is questionable, the action in the market now is definitely bullish. As I said in a past post, I expect this fourth wave to be long and drawn out. It may also be shallower than expected.
___________________________
Update Tuesday, May 24, After the Close
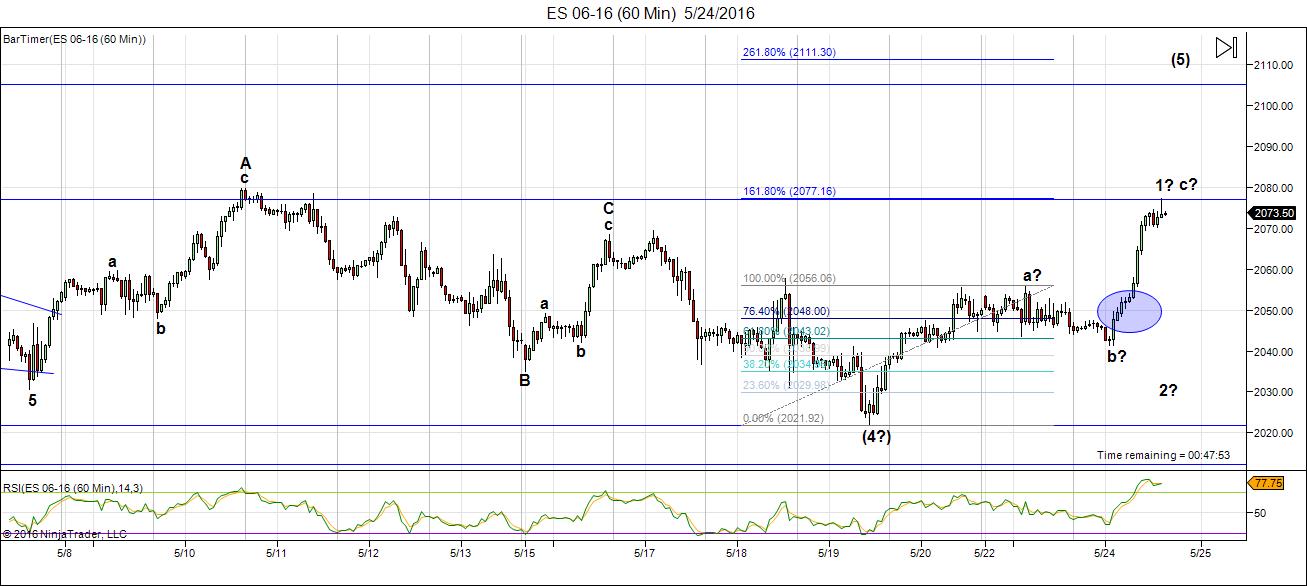
Above is the 60 minute chart of ES. Well, this was an “interesting” day. Let me try to explain the dilemma in analyzing our next move.
We had a very motive set of waves up from the 2022 bottom to a? and then a corrective wave down to the previous 4th wave at approximately 2041. The wave up today is where it gets interesting.
You can see the fibonacci retracement tool on the chart measuring the length of the first wave of the sequence. The extension measurement points to 2077, which is where we stopped. Now this measurement works for both a first wave and an abc corrective wave, so it doesn’t tell us much, except where we expect to stop.
The blue circle surrounds the point where we should have had a second wave if the wave up is the fifth wave of the first. Even if this is a third wave up, there should be a second wave there, but there isn’t. So, this tells me this is a corrective wave, believe it or not. If correct, we should retrace the entire wave up. What makes this more interesting is that I’m still concerned that we didn’t bottom correctly. For those reasons, I’d have to say we’re going back down to the start as the highest probability move.
I have labelled the entire wave an abc wave expecting a move down. I have also left the motive labels on the chart, in case somehow I’m wrong. If this is indeed the first wave up, we’d need to complete a second wave (a 62% retrace of the entire wave). If it’s somehow wave 3, then we’d retrace only 62% of the c wave. Those are all the options I see, the abc wave being my top choice.
There’s one other reason for this. Usually a fourth wave (or any corrective wave) would trace out a double bottom. Wave four did not do that. So we’ll watch what happens overnight and tomorrow.
If we head back down, we still don’t have a clear path to a motive wave, so the direction is still up. This market seems to want to make us all crazy.
The currencies are also pointing to a retrace in the US market. The euro is below. It didn’t change much over the course of today.
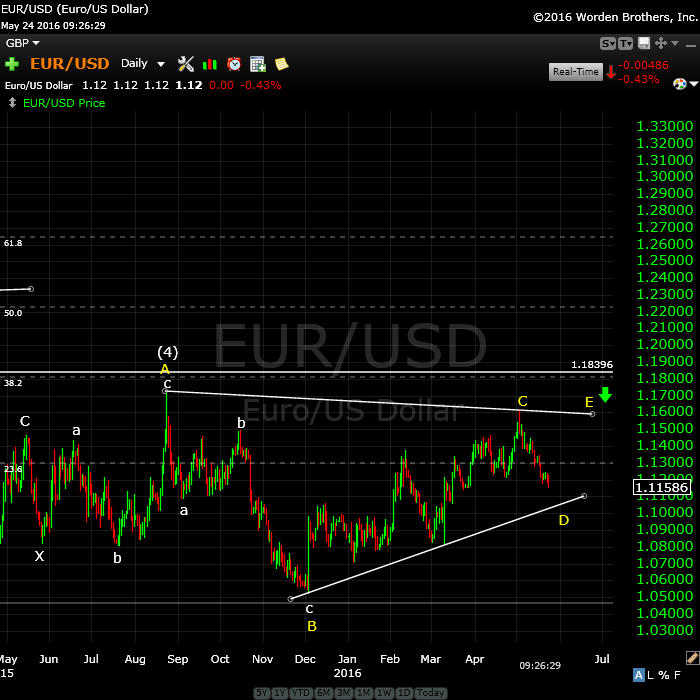
Above is the daily chart of the EURUSD as at this morning. I’m changing the configuration slightly. We’ve dropped to a point where it looks at though the triangle is in play. I would expect to touch the lower trendline in the D wave before heading up in the E wave. It looks like to point A of the triangle is going to be “close enough” to the 38% retrace level to do for the fourth wave.
__________________________
Update: Monday, May 23, After the Close
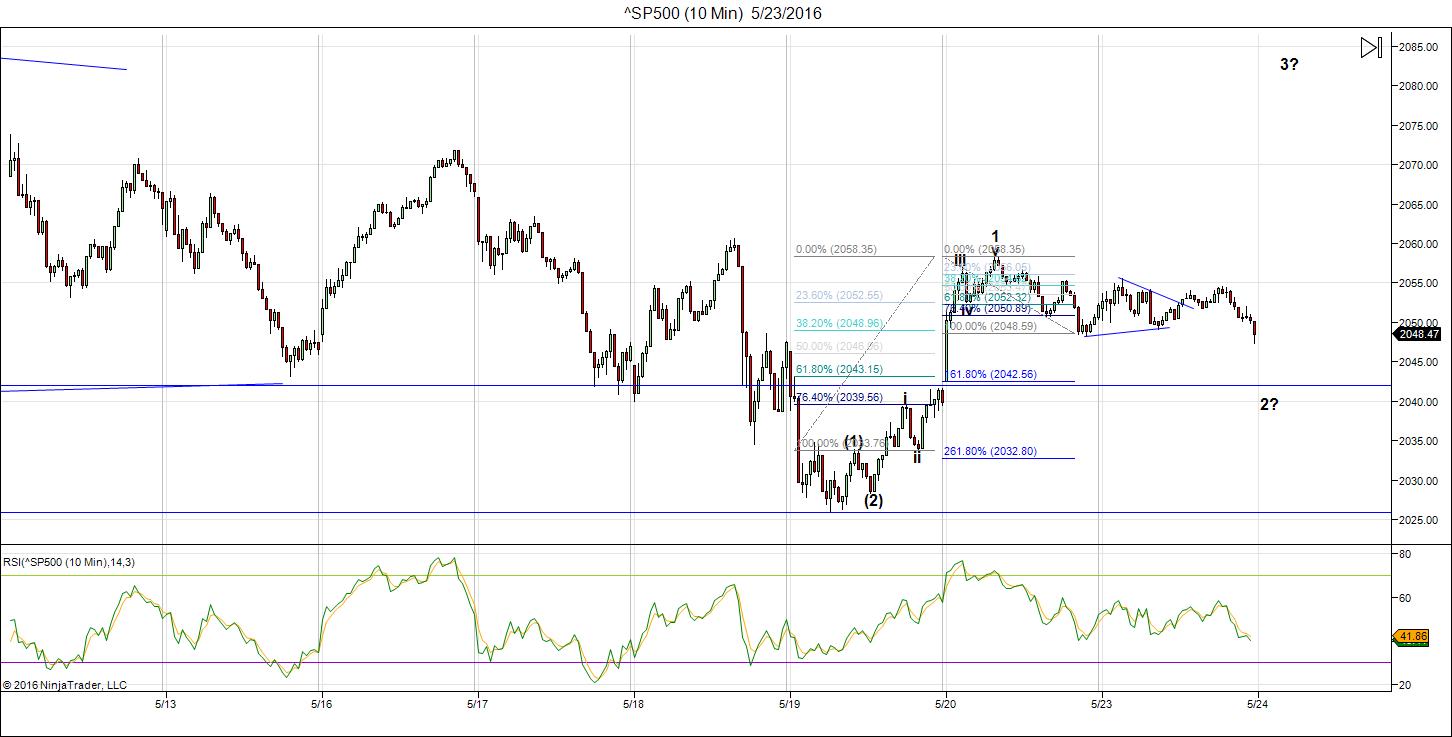
Above is the 10 minute chart of the SPX. Well, this is a bit of a cat and mouse game. I’m not entirely sure what the market is doing—there are at least a couple of options. I’ve labelled the chart a little differently, due to the size of the wave over the past two days.
We have a motive 5 waves within a potential larger wave (due to the (1)-(2) count). So this may be suggesting a shorter drop to a larger degree second wave and then a third, fourth, and fifth, which all together would make up the larger 3rd wave. Finally, we might get a larger fourth and fifth wave higher up.
The direction is up—just not sure how we’re getting there, but this would be my best guess.
I’m showing two fib retracement tools on the chart. The left-most one shows the 62% retracement level of the inner 5 waves. The right-most tool shows the extension of the A wave down. They both point to about the same point as a retracement level (about 2042). This then might turn up into a third wave at that level.
_____________________
Original Post (Saturday, May21): The Last Upper … Yes, this should be the last “up wave” in the US market. For a long time I’ve maintained that the wave up from February 11, 2016 is a corrective wave and that it’s completing wave 2 up, with wave 3 down soon to follow. There are a lot of skeptics out there and even more, crazier projections than I’ve ever seen! 🙂
However, I continue to remain as objective as I can and just follow the wave count. So far, it hasn’t led us astray. We’ve been highly accurate. It’s also the reason I won’t look at any charts you send me and don’t pay particular attention to events in the news. They’re interesting, but they’re caused by human mood. The market is a mathematical representation of human mood. Figuring out the market gives us a clue to upcoming events, but events themselves don’t influence the market to any great degree.
Objectivity is the key to predicting the future of the market based on Elliott waves.
Another huge factor is the All the Same Market scenario we’re seeing at the moment.
I’ve been mentioning for months now that the entire market is moving as one entity, the “all the same market” scenario, a phrase that Robert Prechter coined many years ago, when he projected the upcoming crash.
We’re starting to deleverage the enormous debt around the world. Central banks are losing the control they had and we’re slowly sinking into deflation world-wide, with Europe in the lead.
The US dollar is fully in charge of both the equities and currencies markets. They’re all moving in tandem, as I’ve been saying since September of last year. For a short while, currencies were moving contra to the US market, but for the two months or so, they’ve been moving together.
Watching the charts of the Euro and US dollar provide a foreshadowing of where the US market is headed. It’s the same with gold. As the final wave up in the US indices unfolds, gold should finally head down to complete its second wave—another projection I’ve had out there for sometime now.
The dollar will turn up and the euro will turn down at the same time the US equities market tops in this second wave.
Positive human mood is waning. We’re about to turn negative. My attention is turning to finishing my book, my course, and creating more videos. I will not be around much during the day, but will answer your questions when I can.
Bottom line in the SP500 (and other US indices): We have one motive wave up at small degree almost complete. Once we see a second wave down in three waves, a correction of 62% of the first wave up, we will have confirmed the change in trend. That will lead to a 3rd, 4th, and 5th wave up to a final top. I’m still projecting a top at 2116 in the SP500.
______________________________
Here’s a video overview of the market for Monday, May 23, 2016:
Market Report for May 23, 2016  |
 |
Make sure you zoom the video to full size with frame expander (arrows) in the bottom right hand corner and also set the quality to as high as your web connection allows. This is an HD quality video so the best viewing is at that level. |
Special Treat: Free Video on Motive vs. Corrective Waves
NOTE: You must be registered and logged in to the forum to be able to see this video. It’s a lesson on the difference between motive and corrective waves using the Russell 2000 as an example. It comes from my Elliott Wave Master Class course (in the works).
I will leave it up for the rest of this week. Go to: https://worldcyclesinstitute.com/forum/elliott-wave-resources/motive-vs-corrective-waves/
It’s a YouTube video, so be sure to set the quality to the maximum your connection allows. It’s only about 8 minutes long.
Enjoy!
_______________________________
The Charts Going into Monday
The US indices have found the B wave bottom and are heading up in a final C wave (in 5 waves).
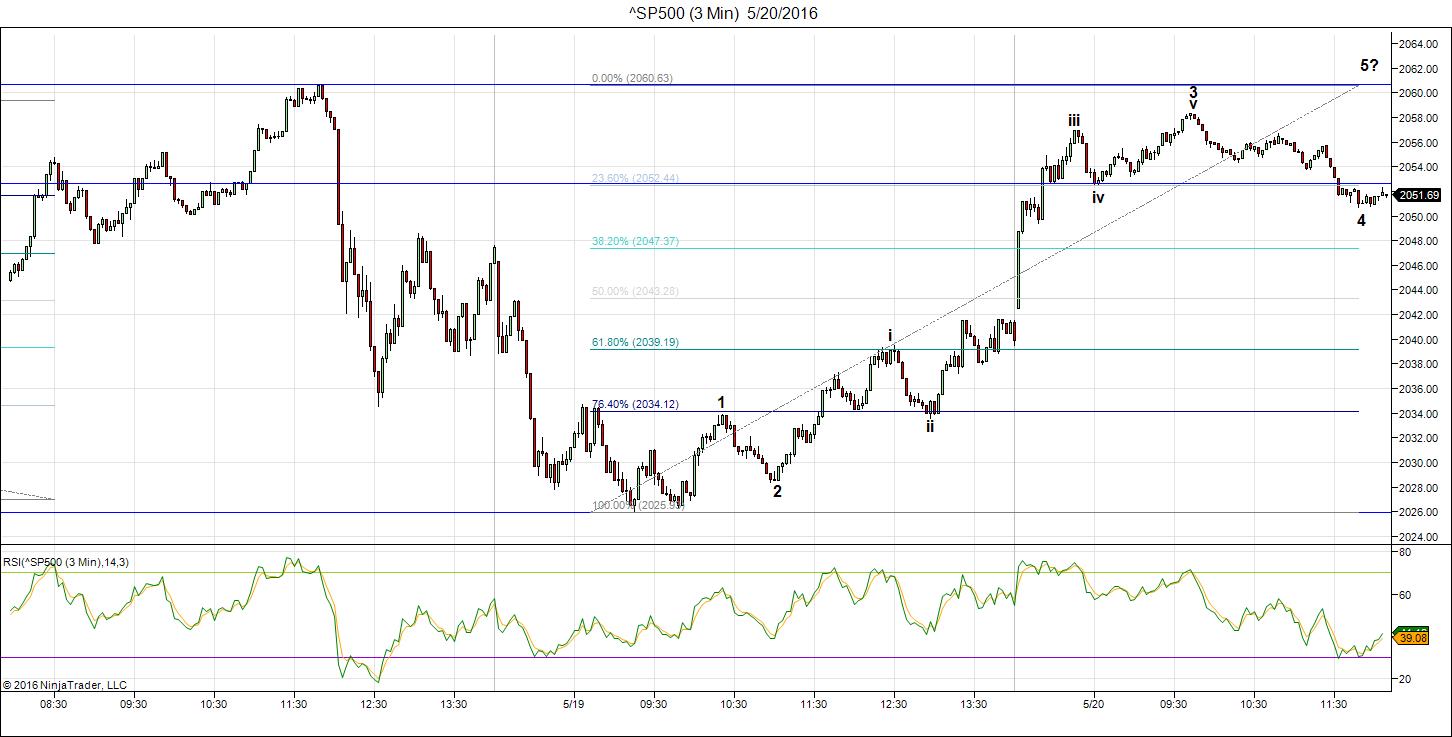
Above is the 3 minute chart of ES now showing a fourth wave of the first wave up looking for a bottom. We should still drop to the 38% level before heading up to complete the 5th wave of the first. Then down in a second wave to the 62% level, before turning up in a third wave (of the C wave). Ending waves should be in 5 waves, unless they’re a triangle, or ending diagonal.
It’s interesting to note that the wave up has a 1-2, 1-2 configuration, which threw me off. I saw overlapping waves and so thought initially that this wave would come back down. However, it’s turned into a motive wave up. The other thing that was somewhat disconcerting (and still is) is that the bottom is not a double bottom. Therefore there’s an extra wave there. That’s the second reason I thought the waves were overlapping. However, I guess in a C wave, that’s good enough. It only missed by a few cents, so the overwhelming construct is of a motive wave.
Technically, the first wave is not confirmed until it’s complete and we’ve seen the following second wave turn up.
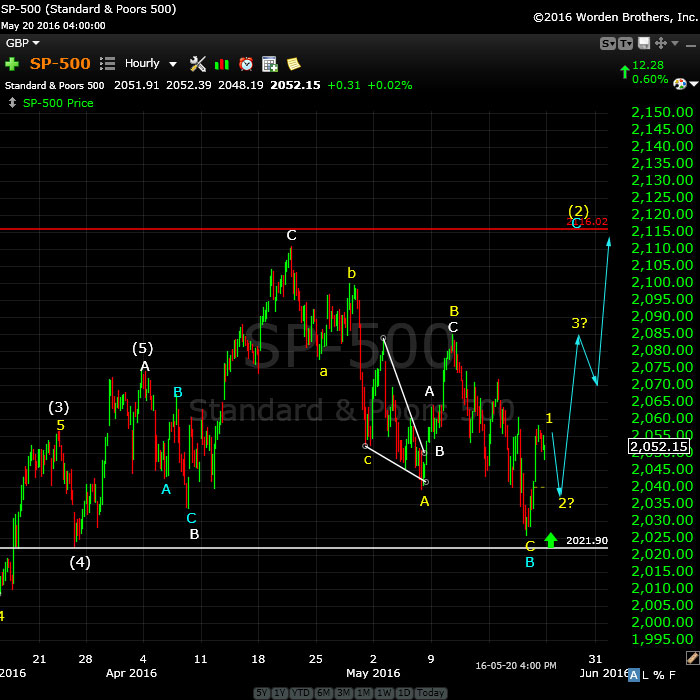
Above is a one hour chart of SPX. We’ve bottomed the B wave and have a larger ending wave still to complete. Ending waves should go up in 5 waves. You can see I’ve put in a projected path.
USDCAD and EURUSD are also in fourth waves now, consistent with that the equities are doing. USDCAD should now turn down and EURUSD up (once the 2nd wave in US equities has bottomed).
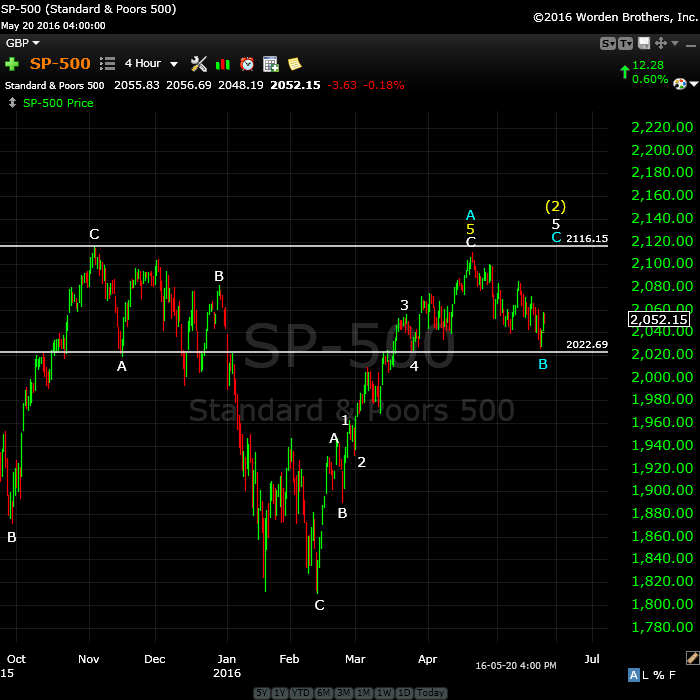
Above is the 4 hour chart of the SP500, showing the double 2nd wave top waiting to finish tracing out. This would negate the possible “truncation” from November of last year and create a spectacular EW textbook set up for a huge third wave down.
It’s typical in a bear market for second waves to trace out a double prong (an ABC wave down in this case from early November and a corrective structure up to where we are today). The wave up shows a C wave with 5 waves up (for simplicity in this chart. The entire wave, however, is not motive, and has traced out a very clear ABC pattern overall. I have therefore labelled this wave more correctly, showing that it is indeed a 3 wave corrective wave, with the (blue) C wave up expected to produce a final ending wave of 5 waves.
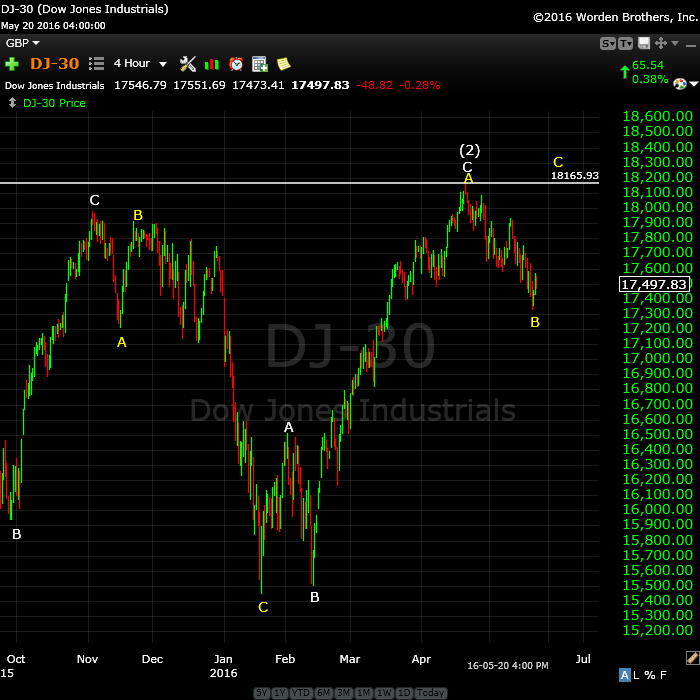
Above is the 4 hour chart of the DOW. It’s similar to all the other indices, as it should be. I predicted we’d reach the previous 2nd wave high and that in fact is what we’ve done. Look for a double top with the most recent high before a turn down. The reason I show this index is that I’m always looking to other indexes for confirmation of a move. You’ll note that the DOW did not come down to a new low in February, so this puts it clearly in a corrective abc wave up. As all the indices move in tandem, this supports the fact that SPX is also in a corrective wave.
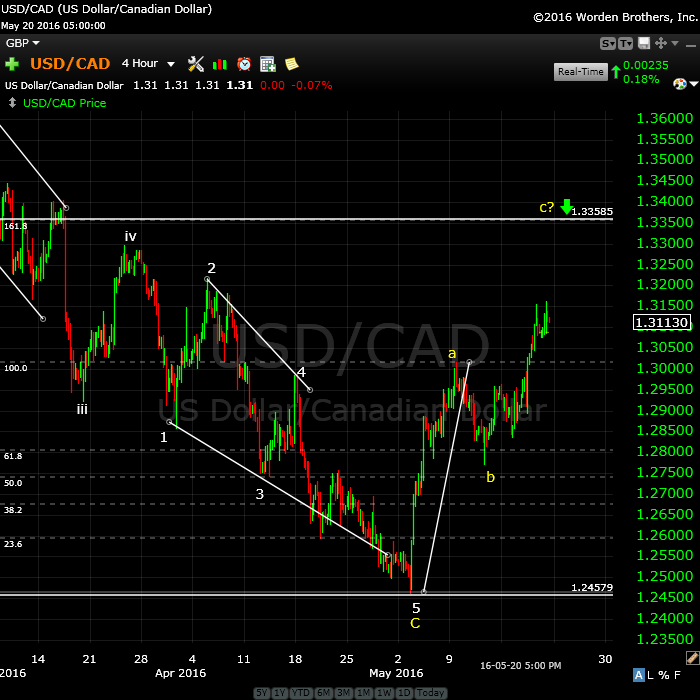
Above is the 2 hour chart of USDCAD. I have been stalking this for some time, waiting for it to top and we’re getting close. I’m presently long, but have only been able to take advantage of the C leg of this wave.
The larger pattern down is an ABC corrective wave, and we have an ending diagonal, which is complete at ~1.24579. However, I expect the current wave up in 3 waves to reach ~1.33585 before turning down to trace out a double bottom (to ~1.246). It could also drop to a lower level. Then it will turn back up into a very large 5th wave.
The euro, Australian dollar, dollar, and Canadian dollar are all at similar major inflection points.
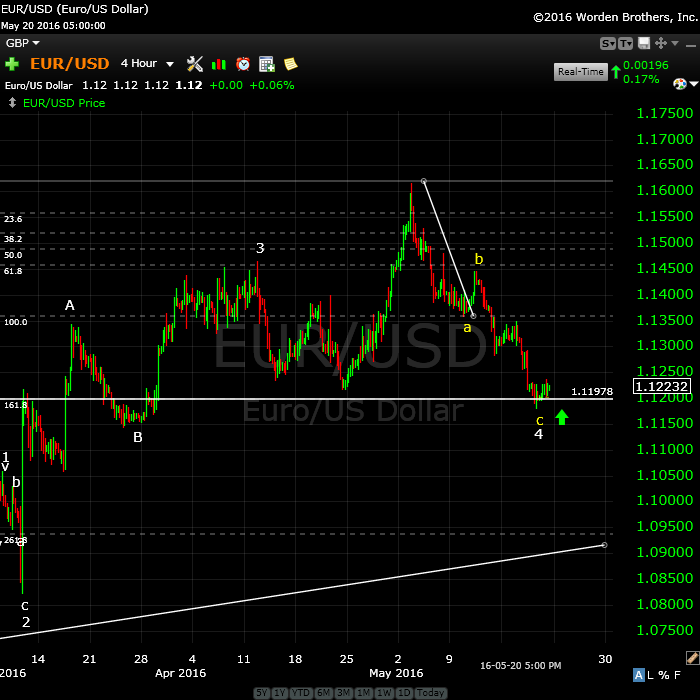
Here’s the 4 hour chart of EURUSD showing the “4th wave” of the major corrective pattern we’ve been in since March, 2014. I predict we’re going to hit the 38% retrace level (~1.182) that I’ve been suggesting for the past 8 months or so (not shown in this chart).
As I explain in the video, the ABC wave heading down (shown above) can be easily measured for an end point using your fibonacci tool. It’s at a bottom, but I expect it to test that bottom before turning around and heading up in its final wave.
It should turn in tandem with the US equities.
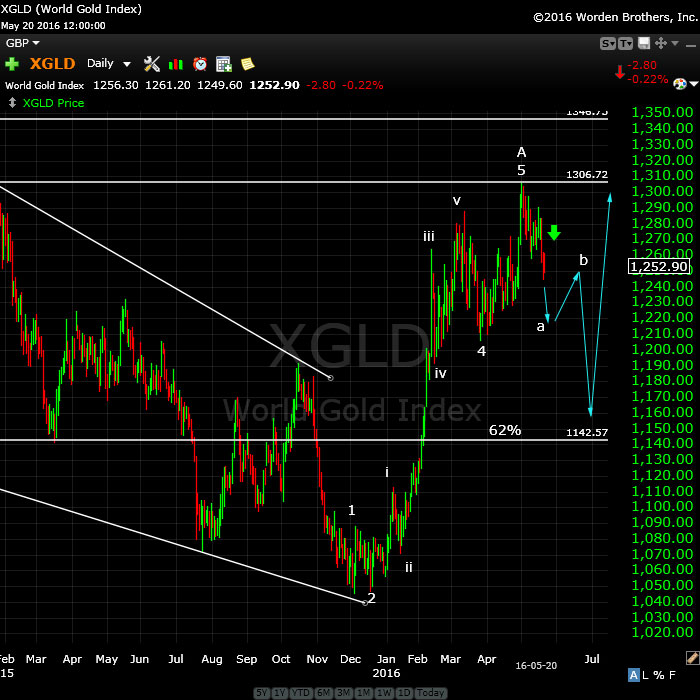
Above is the daily chart of XGLD (gold). We started to move during the last week. The bottom line is that we should continue down here.
The target on the low side is the 62% retracement level, somewhere close to 1142.
________________________
First Wave Down – What to Watch For
This weekend we’re dangerously close to a top of a second wave (in the fifth of the fifth, with an ending diagonal pattern).
What we’re looking for to confirm a turn is a motive wave down in 5 waves at small degree. After that, we should get a second wave that will retrace up in 3 waves about 62%. That’s the preferred EW entry point. So don’t feel you have to rush in. There’ll be a much better opportunity at the second wave level than at the top and the risk is substantially reduced.
__________________________
History: The 1929 crash
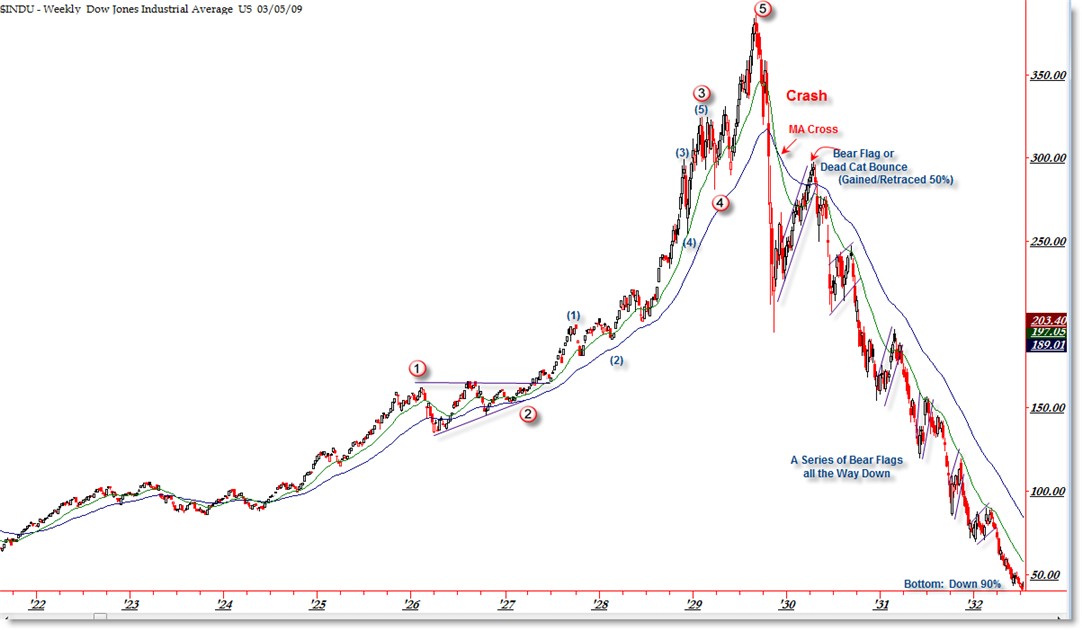
I think it’s important to look at 1929 and the wave structure (above and below), which was the same as 2007—to a point. I will show the 2007 crash below in the “What If” section.
The wave structure of the 1929 crash was in 3 waves overall. There were 5 waves down from the top (the A wave) and then a very large B wave retrace. The final C wave down was a stair-step affair and lasted over 2 years.
Let’s look a little close at the timing of the 1929 crash because the similarities to today are uncanny.
The market peaked on September 3, 1929 and then it took 2 months for the crash to actually happen (to reach the bottom of wave 5 of the A wave). The larger crash which we always hear about began on October 23, 1929. Then there was that large B wave, which lasted 5 and a half months and finally (which I explain a little further in the cycles section below), the C wave which went on for more than 2 years. This might be the scenario we’re looking at going forward.


New post live: https://worldcyclesinstitute.com/the-last-upper/
Yet another great and clear presentation. Keep up the good work. Thanks Peter! I’m looking forward to read your book soon ?.
BY Golly old chap, i think you have nailed it……nick
I am ready, my house is in order…n
🙂
Thanks a lot peter
🙂
Thanks Peter,
I think monday we will see an other top and we will go down again next date June 2.
Peter – Great video! I have been following you for several months and I am really able to understand the detail and import of your charts. It is remarkable what you have been able to teach me. EW is certainly impressive as it continues to evolve (with twists and turns) into a readable pattern – for the well experienced.
As an alternative view, and not EW, looking at your chart of the SnP, two things jump out at me…..me as a neophyte. There are two possible inverted head and shoulder patterns. The first did not rise as high as expected, but the second rose higher than expected. It is almost as if the second is a repetitive fractal of the first. The second point is the potential for a cup and handle pattern, IF (I emphasize the IF) the SnP exceeds your target of 2116 (which I understand it can not do, based upon your EW evaluation), both inverted HnS and cup w/ handle patterns are very bullish. If your target of 2116 serves as strong resistance/neckline, then my patterns fail and you get your HUGE W3 down. But, if your target, per chance, is exceeded to the up side, the bullish potential is also huge. This will be interesting to watch!!
Thank you so much for all your efforts to teach and enlighten us into the intricacies of EW. For one who understands and can read the waves, the revelation is most impressive!
my attempt at a chart to explain the above.
http://invst.ly/1rez4
Thanks, amb
It’s rewarding for me to see the occasional reader latch on to Elliott’s extraordinary discovery, which nonetheless, takes lots of time to perfect. I did not say the SP500 cannot exceed 2116. That’s my target, but it could go a little higher. I will be able to be more specific was I see the waves unfold. We need the first wave in place before I can even make preliminary measurements, and we don’t quite have that yet. The bullish potential is not huge, however, as this is a corrective wave going up and we’re already in a larger C wave. If we start 5 waves up from here, those 5 waves will forecast and end. This is the fifth wave of the sequence. Five waves, corrective or not, is all you get.
But market comes down on heavy volume and goes up in low volume
Hi Peter
I too am looking forward to your book. Any ballpark date on the horizon?
Thanks
Michael
Thanks, Michael,
I’m working harder at it. All the basic research is done; it’s all the writing now. As with the stock market, I’m not good at making time projections. A couple of months, I hope.
HI Stuart – thanks for the feedback!
I am NO expert, but yeah, it looks like a potential cup/handle to me.
a few links:
http://stockcharts.com/school/doku.php?
id=chart_school:chart_analysis:chart_patterns:cup_with_handle_continuation
http://www.investopedia.com/terms/c/cupandhandle.asp
https://images.search.yahoo.com/yhs/search;_ylt=A0LEVvVVWUJXrVAAFTcPxQt.;_ylu=X3oDMTE0anRnZ284BGNvbG8DYmYxBHBvcwMxBHZ0aWQDRkZVSTNDMV8xBHNlYwNzYw–?p=Cup+and+Handle+Pattern+Bullish&fr=yhs-iry-fullyhosted_003&hspart=iry&hsimp=yhs-fullyhosted_003
Peter, I learn a great deal from your work and it is truly a blessing. Thank you for what you do!
🙂 Much appreciated, Joe.
Peter, I watched the video on IWM, so informative, helped me understand and not to make the same mistakes.
1)The only question I had is, IWM will start wave 3 after 68% retrace, but dow and spx has retrace everything back, so how they will start wave 3.
2. I know you are looking for a higher high for spx, above 2111. The daily Bollinger band is now at 2094 and falling. If we go touch, say 2100 and not higher than that, what will that be that
I videos in the forums very informative . Thanks again
Hi sue,
I don’t really understand either of your questions, unfortunately. I’m not sure you really understood the larger ramifications of the IWM structure. IWM and SPX are in similar waves, at different degree, both 2nd waves (corrective). As such, they need to complete the final subwave up before heading down in a third wave.
As I’ve stated before, if we don’t go to a new high, then we’d have a truncation and the probability of that happening is extremely low.
thanks
Peter,
So you game plan is to enter long once we touch spx 2040 or below. IS that correct or you want to wait for some more signals.
Bill,
My count suggests we need to finish the first wave up, then we would head down into a second wave. This fourth wave is getting rather large, though, so we’ll have to see what happens. Not enough info at the moment to provide any more guidance.
Peter,
In your charts of both the DJIA and the SPX, you indicate wave C of 2 ending at approx 2116. Wave C seems extremely out of proportion to wave A. Is there no rule about the proportion of these two waves to one another?
Thanks,
Duke
Nope. Not in a corrective wave. No rules.
Sold half my spxu 28.96 LOL Beer money
I posted a chart of SPX at the end of the day.
This market is certainly devious. I’ve posted a chart of ES this morning.
I’ve also added an updated chart or EURUSD at the top of the post.
Do you still think the next wave down will hit the 2030 level before heading back up to the 2116 level? This market seems to be gunning higher today to at least test the 2080 level.
Charlie,
I don’t know what this wave is at the moment. If it’s part of the third wave, it would have to retrace 62% of the wave up this morning rather than 62% of the entire thing. However, the structure doesn’t look right for the third wave, so I don’t know. I need to see where it stops, but I have to leave the office.
The
Peter,
Thanks for response, looks like the wave from close 2020 to 2075 is quite big for wave 1 , so would it retrace 30 points ..doesn’t look like that.
This could easily be the fifth wave of 1 .. I put the SPX top in that case at ~2078/9. We should be in the fifth wave now, in either case.
The thing that concerns me is that this wave up today has no second wave, so that may mean that this is a corrective wave and that it will completely retrace. Talk about a difficult market!
is it really that different than the up down up from last friday through Tuesday? given volume has completely dried up, computer generated algorithms appear to be taking TA traders to the woodshed on a continual basis. while wiping out bulls and bears alike while gyrating on either side of 2050. we are now within 3 points of peter’s waterfall target. rather than wait for the “perfect setup” anyone with dry powder left from getting screwed over by computers, could leg into a longer dated put spread with an August/october timeframe
should read 30 spx points and 3 spy points. IWM may be the better play since the dividend yield is nearly half of SPY. seems the entire world is chasing us stocks and dividend given the world nirp zirp and global stock market collapse. China is still 40% off last year highs. Japan and Germany 20% off. to me, foreign governments, banks and citizens seem to be chasing here. since we have seen 17 straight weeks of “smart money” selling and soros, icahn and numerous others taking extremely bearish bets in Q1
A brief stock market update – Hedgeye, May 24, 2016
https://twitter.com/Hedgeye/status/735148723211112448
Comforting… (seriously).
frankly, deep down i hope that all those waiting for the perfect setup, the buy the dip crowd and perma bulls get completely screwed over when at some point over night, the complete unraveling will start with china and we open up down 7-10%. it would serve all those chest beating douche bag bulls right. we are seeing the end game to the big short imo. not in 2005-2007 like in the movie.
i would love to see the supposed massive bailout needed in china blaze across middleeast, to europe and hit us all in the same day. then we see yellen and the entire federal reserve go to jail. would serve them right. a guy can dream can’t he?
A new ES chart is at the top of the post.
I am enjoying your site and your analysis! Always wanted to understand EW…You are simplifying that for me! The question I have after each of your posts is…”Are you still expecting that 2116 SPX or vacinity to put in the top?” Do you have an alternative count?
Regards-EP
Thanks, Eddie.
No, no alternative at the moment. That’s because it looks like we’re going back down to start again. We might top now with Yellen and her interest rate hike mid June. I think this thing is going to draw out a little longer.
I agree Peter,
May be something else is playing out.
Nobody understands nothing anymore.
Before there were 5-10 technical analysts for 90 fondamental traders.
Now there are 95 algos that are trading technical patterns for 5 real investors.
I had to release my last 1/2 batch of spxu first thing this morning for a loss. Went long upro, looking for a min 2085. time is more important than price thou. I will take a 1/3 off tomorrow if we reach 2085. I will be completely out of the longs no later than Thursday morning and back to shorts going into early next week. Good luck all
For trading discipline reasons, I am selling one third. Part of me does not want to sell.But bulls and bears make money, PIGS LOSE OUT. Good luck every one.
Looks like we are going straight up to 2116? Futures up big again this morning. This market is really perplexing.
I sold my puts Tuesday morning and went long I think the rally will continue till early next week.
New highs comming bull is warming up…. lol
“Bull markets are born on pessimism, grown on skepticism, mature on optimism, and die on euphoria. The time of maximum pessimism is the best time to buy, and the time of maximum optimism is the best time to sell.” –Sir John Templeton
There is a very large [important ] Bradley turn date Today.
It is a beautifull uppercut on the bears chin…lol
We have seen these stupendous explosive moves higher for no valid reason. They tend to hover for a while before starting the descent so the bear scenario I had in mind has probably been postponed by another 2 weeks. Shame that the bears can’t seem to get their game on like the bulls can.
well the head and shoulders failed, but the inverse head and shoulders formed with the head on 5/19 just hit the target of 2090+. market magic continues to follow path the least expected. i’m looking forward to seeing Peter’s next chart update. we’ve gone 43 points straight up in the cash market in 8 trading hours
In ES, the 3rd wave (or C wave) will be 1.618 X the 1st (or A) wave at 2097. From there it should turn down, in either a fourth wave or to the bottom. That number for SPX is about 2100.
I still don’t know what this wave we’re in is. The structure is questionable. If this is the fifth and final wave, it’s giving me an end target of 2025 SPX.
What I find unnerving is that the US market is moving now contra to currencies (for the past two days).
End target of 2025 or 2125?
Sorry, Aaron. 2125. Thanks for catching that.
Wow Peter, 2125 would run all the stops above 2116 and yet fail to go to a new all time high. Lots of confused and unhappy traders!
Aaron,
I’m not saying it will get there. That’s a fifth of fifth that’s 1.618 X the length of the first wave, which is normal. But waves at the top of the market tend to get a bit crunched up (shorter).
Iwm /rut also close to its high
Thks. See that. And that’s another reason this is most likely the final wave up. GLD also doing as expected. In fact, everything is doing what I’d expect, so I think we have to go with “fifth wave.”
Except currencies (not aligned with the equities), but they’re still doing as projected.
After doing some other measurements, I’m now starting to lean towards this being the fifth and final wave up. The measurements on NQ (NDX futures) work out perfectly for a double top.
The third wave itself is well defined in terms of a third and fifth subwave. It’s the waves within those waves that are an issue. But I can’t argue with the overall look of it.
In that case, we’re likely to have a long fourth wave (in time) as the second wave was shallow and long.
thanks for the update…we are on the same ‘wavelength’…
Peter, may be high on holiday trading June 2nd date
Bingo.. also Super Mario day..
April 21 was the last ECB Meeting…
Sometime around there, I think.
with a long 4th wave, this move could extend into the June Fed meeting for its 5th top is what I hear you saying. That goes with a major aspect on 6/15. (Not sure what date Fed is). For now, looks like 3rd wave could top tomorrow around 2100…
I fully agree with you for tomorrow. Uvxy is not ins ink with this rally. Uvxy does not believe in this rally. The aLgos and the big boys are going to top this market late tonight or tomorrow some time. Back down Friday. (Retrace). I will be going short with a combination of spxu and uvxy. Good luck every one
Thanks Dave. How do you get long spxu and uvxy, via options, short expiry, or do you buy them outright?
LOL, the old KISS Principle. I buy them out right. I still have one third batch to sell. I may wait until tomorrow, to sell out unless we get another pop up in the markets today. I will slowly slide 3 batches of the short instruments tomorrow some time. Best of luck to Whitemare.
The algos maybe waiting for the shorts, to come back in again. Than another shot upwards before turning back down into Friday. LOL, Rinse and repeat.
I AM NOT LOOKING FOR ANY DRAMATIC CORRECTION at this time with my shorts. I am only picking up pocket change. All the best every one.
Not what I was implying. My thoughts then were if the wave up that we’re in (wave 3 I’m calling it now) was to fail yesterday and head to the bottom, we might delay until mid June. But I think we’re going to top closer to end May, which is what I originally thought (should stick with my original guess … lol).
Peter,
can you please redo your charts not to clear up the counts.
Thanks as always for your work.
Hi Peter. When you look at your previous update (after the close of May 23), you were exact on your prediction: 2? bottomed exactly at 2042, and 3? should be 1.168x wave 1, so measured should be around the top we have now at about 2092, which would be the end of wave 3? and than retrace now for wave 4. If this is correct: the final top is still 2116…
So why in the next update you mention that wave 2? is not a wave, and the previous prediction was incorrect?
Thanks for your answer!
johan,
You need to mention what asset you’re talking about. I’ll guess SPX. On two different charts in two different programs, I show the bottom of 2 at 2047 because the market turned before the open, which is unusual, so that’s the only number I have to measure from (and it’s short). The wave 2 I was talking about shown in the circle in the chart would be wave 2 of 3.
I was indeed referring to SPX 10 min chart, which is the third chart from the top (Update: Monday, May 23, After the Close).
But I made a mistake, I thought wave 1 started from the bottom on May 19 at about 2026.
However, can you explain me why the wave doesn’t start at the bottom (2026)? Because if so, the measured 3th wave should top at about 2094, where we are now… (1,618x length of wave 1 = 1,618*(2058,35-2026) + 2042,56 = 2094,9.
I’m still a newby in EW’s, but really want to learn here.
Really appreciate your inputs! Thx.
OK, your latest update is about what I wanted to explain ;-). Good to know!
You’re basically correct. However, as I stated, the bottom of wave two shows on my charts at about 2047, so measuring from that point is about 2097/8 for the top of 3. Wave 2 is the big question.
I’ve posted a chart of ES with my thoughts.
Hi Peter,
Amazing analysis. Given today’s price action, do u still see usdcad going up first to around 1.3350 before heading back down to 1.2460, or do you think it will straightly turn down from here? I would appreciate also if you can provide EW analysis on crude oil. Thanks
Hi Elizabeth,
I think crude is about to top. Three waves up. A little further to go to a previous spike high at 51.18 or so.I’m expecting to see $10-15 oil eventually.
CAD is turning right here (1.2920 or so). I just getting long. The target I have is 1.3357 or so, which will make this wave the same length as the previous wave. And then it should turn and head back down to the previous bottom at yes, 1.246.
Hi Peter
I think it’s amazing watching all these waves come together
And somewhat on time to boot !
Do you think the euro should drop below the early March low ?
I ask only to point out a text book triangle formation should
Require that shouldn’t it ? Wave D would then overlap
The B wave of wave C’s a b c upward move .
With the upcoming Brit exit on June 6 ( I believe )
It dove tails with my june6-13th cycle high .
This is a bearish set up as I see it with the USA stock index’s
We will also be seeing the republican convention with trump
Clearly in the lead and the Hillary / Clinton scandles
Making there way back into the public I’d say the average
Person will simply step to the sidelines . I realize it’s the
Wave counts that matters yet this could be a very strong
C wave down ! Prechter calls 3rd waves ( which are similar to
C waves ) the point of recognition where everyone does the
Same thing and are proven correct . My take on this as
We come into the top of this cycle is not to be contrarian
As the market begins to fall. Following this cycle high
In June we have 1 last cycle to watch out for . It will be
A combination of Venus conjuncting the sun as well as
Mercury conjuncting the sun . They do not hit exact on the same
Day yet once those pass we go into what is termed a Venus
Bear market ( Barbara koval, she did a 100 year study
On the Dow based on this ) it’s not perfect by itself from
What I’ve researched but when combined with the Mars
Uranus cycle it can be very very powerful . June 2008
Into March 2009 this combination was deadly accurate
And extremely bearish.
Bottom line : we are going to see more and more bearish
Sentiment going forward . Lastly the next solar eclipse
( the puetz cycle ) is sept 1 . We should expect a cycle high
Of some degree 1 month prior , hence aug 1 .
To sum it up . Cycle high June 6- 13th and Brit exit vote
July 1 trend change in Mars Uranus cycle, August 1 +_ start
Of puetz cycle, August again ( I don’t have exact dates in my head )
Sun conjuncting Venus as well as Mercury . Also
I intend to look up the next Mercury retro grade .
Lastly Chris Carolann’s work using the spiral calendar .
These are a combination of many bearish cycles all coming
Together at once , by themselves they are high percentage
Odds and in combination I can only say this.
I see this as a sell and hold set up into at the very least
The elections yet Jan 20 2017 is the major cycle low .
If this market manages to hold up and fails to break
This years lows then the outcome will become extremely
Bullish . A total breakdown is not expected by me at this
Juncture yet I would not rule that possibility out either.
Thank you for your updates
It keeps me in tune while I’m away from the day to day
Swings .
Joe
Mercury Retrograde is August 30, 2016
As always thanks for your insights Joe
Joe,
The triangle in EURUSD should unfold as shown in the chart. Otherwise, it wouldn’t be a triangle. It’s a bearish setup, correct. Thanks for the info on planetary cycles. 🙂
Not sure if we’re in the fourth of the third, or the fourth of the entire wave up. If the latter, we should head down from here quite far (a 38% retrace of the entire wave up). Because of the muted second wave, it difficult to get a sense of what the size of the fourth of the third should look like, or if we’ve already seen it.
I’ll just add that this is a 62% retrace for CAD (the turn now). It was either going to go to 38% or 62%, wasn’t sure which. I would much rather trade currencies than to fool around in the US indices right now … 🙂
Based on what NQ seems to be doing (and currencies), I think we’re going into the larger fourth in ES/SPX, etc. I would put the ES target at about 2066, in that case.
Right here. A little below 1.2912. I think we’re seeing the turn now.
Chris Carolyn dow soluner cycles showing jul5 th low, high august 2nd high, oct 23 low
I just updated the ES chart at the top of the page to this morning.
looks like wave 4 also small as wave2 . Peter was concerned about short wave 2.
I updated the ES chart at the top of the post. The Nasdaq has been the key to today, going to a new high from yesterday. But SPX and ES hardly moved so I suspect they’ll head down tonight or tomorrow into the balance of the 4th wave.
I had warned this would be long and drawn-out.
When must voters register by?
The registration deadline for the EU Referendum will be on Tuesday June 7 ahead of the referendum on Thursday June 23.
Cycle high due June 6-13th cycle low due June 24
This will be interesting to watch
Hi Joe, june 6 week is a panic cycle week of Armstrong. The last panic week cycle, the markets headed up significantly.
I remembered very clearly, on how the markets unfolded during his panic week. Monday gave a great head fake, markets were drifting downwards for most of the day. From their the markets ripped up higher into the end of the week. Either way, we should be ready for much more volatility during the june 6th week.
Is that every year? Is that due to the scary number 666? A year that ended with a 6 like 2016 is 2006. Market went down from June 5 to June 14. I think June 14, 2006 was the 2006 low. Lower than the lows made on 1/20/2006, 2/7 and 2/10/2006.
Liz, that was late feb or early March 2016. This year.
Interesting Liz, I have my eye on that time period. Just be aware of the fake outs early Monday to get a good clue for the rest of the week.
Dave, If you live here in the U.S. you’ll definitely be faked out on Monday when you sit in front of your computer to trade. It’s a holiday! 🙂 https://www.nyse.com/markets/hours-calendars
Hi Liz, I was referring to the June 6th week for the panic cycle week of Martin Armstrong.
Chris Carolyn dow soluner cycles showing jul5 th low, high august 2nd high, oct 23 low
Mercury Retrograde is August 30, 2016
next solar eclipse
( the puetz cycle ) is sept 1 . We should expect a cycle high
Of some degree 1 month prior , hence aug 1 .
To sum it up . Cycle high June 6- 13th and Brit exit vote
July 1 trend change in Mars Uranus cycle, August 1 +_ start
Of puetz cycle, August again ( I don’t have exact dates in my head )
Sun conjuncting Venus as well as Mercury . Also
I intend to look up the next Mercury retro grade .
Lastly Chris Carolann’s work using the spiral calendar .
Just putting everyone’s dates along with my own together
🙂
Hi Dave
Thanks for the input .
For me I try to dove tail turn dates
With wave counts and the internals of the market
( advance decline line , trin) as well as indicators
( over bought or oversold readings )
And I look for typical signs of how these cycles
Begin and where they typically end .
While this may be an upward move with armstrongs
Panic cycles , I have to go by my own research as I don’t
Know armstrongs research I only know my own .
That said I’m going to start putting the dates in order
And will begin digging . I’ve waited for this and once it begins
I want a piece of it .
I’ll stick to my dates and follow peters counts
And when everything gives me my trigger I’ll enter
The short side .
For what it’s worth I don’t like day trading and prefer
Longer term position trades .
I’m on a tug boat in San Francisco Bay and won’t
Be home until around June 10 th .
My trading style has to include my work schedule
So taking advantage of opurtunities when they arise
And I’m home to follow them can be a bit tricky .
The day to day fluctuations are not as important
To me as are the longer term trends .
Joe
Quick thought
Solar eclipse sept 1 should be a LOW and a 10 trading day bounce into the
Lunar eclipse if bearish .
Mercury retrograde starts August 30 ? ( Aaron post )
That would work as I’ve seen before a 10 trade day lag
That’s it for me today
These all take time to correlate and put together
Heere is a link for you to check out Joe. It discusses the Neptune, Jupiter, Saturn T-square aspect pattern. I don’t pretend to understand it all. Any additional insight you might be able to provide would be much appreciated.
https://stellargnosis.wordpress.com/category/saturn-square-neptune/
No need for a new chart this morning. A few thoughts are at the top of the post.
SPX 60 minute chart…is it possible that Thursday’s low at 2087.08 marked the fourth wave and the fifth wave is currently evolving?
This website is for educational purposes relating to Elliott Wave and natural cycles. I welcome questions or input about Elliott Wave, cycles analysis, or astrological input relating to any market. Due to a heavy schedule, I may not have the time to answer questions that relate to my area of expertise.
I reserve the right to remove any comment that is deemed negative, disparages the Elliott Wave Principle, is otherwise not helpful to blog members, or is off-topic. Posting trade specifics does NOT serve an educational purpose, is stongly discouraged, and such comments may be removed.
Want to comment? You need to be logged in to comment. You can register here.