


All this talk about a “Trump rally” … absolutely ridiculous! Elliott waves predicted this rally over two years ago—even longer, in fact. So, what are the financial pundits talking about? They talk about every tweet from “The Donald” as fodder for a major market move.
Knowing that the market is traded around the world, to think that the entire world buys and sells based upon what happens in Washington DC is really extraordinary. Wall Street hubris knows no bounds. Next, they’ll think that we’re in control of Earth’s climate!? (oh, yeah, I forgot … they’ve already tried that …)
This notion that events have any major impact on the market is part and parcel of this same kind of thinking. It will be fascinating to see the reaction when it starts getting noticeably colder right across the world, the market crashes big time, and the people realize that we’re really not in control of anything that happens on the third rock from the Sun.
Of course, that will only be some people, as the major media will blame the financial crash on Donald Trump and perhaps the recent tax bill, or whatever event “happens to” coincide with the predicted top.
The truth is that the movement of the market is a mathematical representation of the mood of the herd.
 Charles-Marie Gustave Le Bon (1841-1931) was a French polymath, who is best known for his 1895 work,”The Crowd: A Study of the Popular Mind,” considered one of the seminal works of crowd psychology. He’s attributed with the quote,
“The memorable events of history are the viable effects of the invisible changes in human thought.”
Robert Prechter writes in “The Wave Principle of Human Social Behavior” that
“Major historic events that are often considered important to the future (i.e., economic activity, lawmaking, war) are not causes of change; they are the result of social mood changes that have already occurred.”
“Brexit” was a one day event—a vote by the citizens of the United Kingdom to leave the European Union. The recording of the referendum vote in June, 2016 was merely a “marker” of a social mood change that had already taken place. The point is that collective action is a lagging indicator of aggregate mood change. While an individual can initiate action immediately upon a change in mood (by casting a vote), society requires a good deal more time for an extensive swing in mood to be registered as action; before laws are written and actually put into effect, for example.
These latter activities will show up in accepted social customs well after the mood of the crowd has changed solidly in that direction.
But people continually mix up these “marker events” with an immediate shift in mood and expect, as a result, an immediate turn in the stock market. But the cause and effect is not that immediate. This is why I’ve adopted the mantra: “Events don’t move the market.”
Back to that vote on Brexit. I remember it well, because while I expected a turn down in the market (we were at an obvious top), I was on a plane from New York City to Calgary (out of touch for about 8 hours). I was not able to take advantage of the event. When I landed late on a Thursday night, the damage had already been done. The market continued down to a bottom by the following Monday.
It was at that time that I assured people that the market was going to go straight back up; the waves had obviously dropped in a 3 wave (abc) configuration and it was, after all, an “event.” I can remember at the time being in a crowd of one in terms of my opinion, but sure enough on Tuesday, the market headed back up.
The Brexit vote was simply a marker of mood. Mood had already changed, but the effects of that mood change had not been put fully realized. No laws had been passed—there was no visible change in behavior. In fact, some five months later (November, 2016), not much has changed in the U.K.; they were still discussing the vote.
The Economic Consequences of Social Mood Trends
Bob Prechter (author of “The Elliott Wave Principle”) continues,
“Social mood trends have economic consequences. Men make decisions that lead to the production of more goods and services when the dominant social mood is positive rather than negative; and vice versa. The reason for the lag between mood (as tracked by the stock market) and economic result is that it takes time for people to turn their decisions into policies, and eventually into actions.
As a result, economic trends lag stock market trends. This is an established fact, as the National Bureau of Economic Research in Cambridge has found that, year after year, the S&P Composite index of 500 stocks of major corporations is the single best indicator among the dozen that the Commerce Department uses to foreshadow broad economic trends.”
It’s the trend (the change in social mood over time) that creates the change in action. Events themselves may have a short term effect of a day or two, but the trend will eventually continue on its original path.
If you understand this phenomenon, you’ll be both a better short term and long term trader.
The American Election
The most recent event that’s still reverberating around the globe was the Clinton/Trump rivalry which has culminated in Donald Trump being elected as the US President.
In the same vein as the Brexit vote, I heard people’s predictions for a major change in the stock market trend to start the day after the vote. Again, I suggested we might have some short term volatility, but I wasn’t expecting anything that would last past a day or two. This is exactly what happened, for the same reasons I cited above.
What was the more interesting part of the exercise to me, was to gauge (as a result of the vote) how far along in the revolution the American people were in terms of their mood and thinking. I believe I received a fairly accurate answer.
If the establishment was fully in control, Hillary Clinton should have won. If, however, the population was disillusioned enough, Donald Trump would win; we’d see populist Donald Trump at the helm. Herbert Hoover was also a Republican populist President, who took office in 1929, under a similar economic situation, right before the Great Depression of 1929. History repeats.
I’ve written here before that I believe we’re in the midst of a major financial and economic revolution, an age-old struggle between the rich and poor; the common man and the moneylenders. It goes right back to the days of Jesus in the Temple. That was two thousand years ago, a conflict that continues to play out again and again every 500 or so years, and on a smaller scale, more often.
However, one event doesn’t change the social mood. We’re in for a very long process in thinking and institutions. The markets will soon start to be a very much more “vocal” marker of the immense changes society is going to experience—changes of epic proportions.
Elliott Waves and the Stock Market
Waves reflect the mood of the herd. As a result, at the highs of the market, events (positive or negative) are perceived in a better light, because the herd is in a positive mood. At lows, “bad” things happen. The mass psyche is negative.
We’re rather regularly hearing the cries of pundits or even hedge fund heads that the market is reacting positively to bad news these days. They simply don’t understand how that can happen! Well, that’s because the market is bullish due to the overall mood of those who trade it.
I often find it amusing when pundits and other media types make every excuse they can think of to explain a market that’s not reacting to events the way they expect it to. Or when they try and explain a downturn on good news. They’re certainly very creative!
Elliott waves move in very specific patterns that always play out to their prescribed end points. Virtually all the waves have fibonacci ratio relationships to other waves and so the predictability is extremely high. Given the knowledge, it’s relatively easy to predict wave ends accurately.
Every ending wave is in five waves, it doesn’t matter whether it’s a motive or corrective market. I’ve never found a “truncation” through all my research, even though some say it “could” happen. Yes, if this time is different, I suppose it could. But that’s what this site is all about: cycles. Cycles play out over and over again in the same manner, in predictable time frames; otherwise, they’re not cycles. We call that phenomenon “periodicity.” Elliott waves are price cycles and they play out as predicted until the mood changes.
Three Examples

Brexit (SP500): Above is a daily chart of the SP500 from April through July of 2016. The recent Brexit vote of June 24, 2016 had a dramatic effect on the market for a little more than a day. I remember it well. We had already started a correction and I had expected a drop. I happened to be on a plane when it happened and could not take advantage of it (it had been hours of delays on the road and I wasn’t able to access the market).
It’s interesting to note that the C wave shown in the chart ended up being exactly 1.618 times the A wave down, which is a typical fibonacci relationship in a correction. Two days after the event the market headed right back up (I had made the call based upon the wave structure) and it didn’t take long for it to completely retrace the drop. The trend did not change—the market simply continued the correction and then turned up again on schedule.
I remember all the pundits making a really big deal of the drop, as if it were the end of the world. They continually fall all over the place trying to link market moves to events. It’s a futile quest.
But it’s sure fun to watch them try! And sometimes, quite hilarious.

Nine-Eleven (SP500): Above is a daily chart of the SP500 from May – December, 2001. On September 11, 2001, the attack on the World Trade Center took place in New York City. The US market had already been in a downtrend since May 22, 2001 (on the above chart). The market bottomed on September 21, just ten days after the attack and turned right back up, eventually heading to a new high, of course. Although we had a steep drop on the day of the attack, an historic event of this magnitude did not have a major effect on the larger trend.
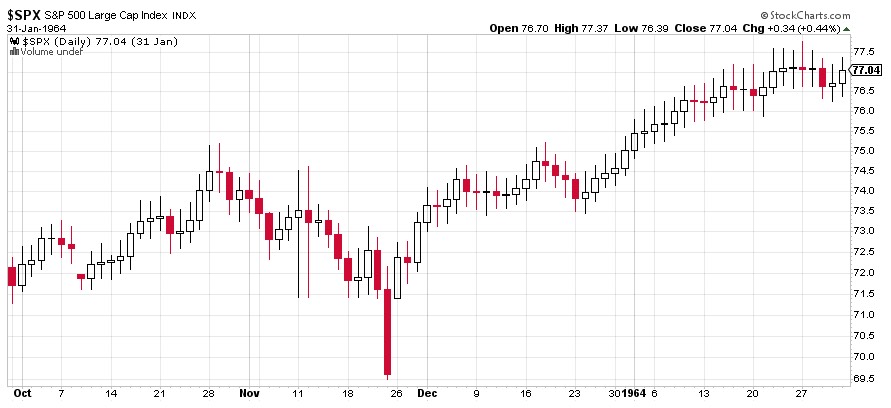
John F. Kennedy Assassination *SP500.” Here is a daily chart of the SP500 from October, 1963 through January 30, 1964. Kennedy as assassinated on November 22, 1963 (the big red bar down). We were already in a downtrend. That day (22nd) finished the downtrend and the next day, the market turned around and want up to a new high and continued on with the larger trend.
_______________________
Based upon these examples, it’s not logical that Donald Trump’s election has had any kind of lasting effect on the trend. After all, the rise in this fifth wave we’re currently in had already been predicted through the Elliott Wave Principle. Events do not change the trend.
The market will continue moving up in its Elliott Wave rhythm until the herd is more negative than positive and at that point, it will turn down. There will be a major event in and around that time, but it will not be the single event that will change the course of history. However, as in the past, it’s likely that the herd will pin the cause of this historic market collapse on that single event, even though it’s highly likely that it won’t happen right on the day of the top, but somewhere close to it.
The trend wanes over time until, as I said, it just keels over at the end of a five wave pattern. It’s highly predictable. At that point, the underlying weakness takes it down quickly and the concern that’s been simmering under the surface suddenly takes hold and quickly turns to fear. From a daily or weekly chart perspective, the market will come down in three very predictable waves (most often a zzigzag), with countertrend subwaves hitting their targets along the way just when they’re supposed to.
It will be an historic drop that “nobody saw coming.”


Peter T,
Great commentary! How do we get to the point you mention…”when the herd becomes more negative than positive at that point we turn down”…when
sentiment and consumer confidence are at or near all time highs?
I have always believed that high levels of sentiment and consumer confidence like the levels that exist today…actually are indications of market peaks. In other words, “everyone that wants in is already in”. I am quite sure you believe the same.
How does the herd become more negative than positive when levels of sentiment and consumer confidence at such high levels? Is it the 5 waves down that says the herd has become more negative than positive? Maybe I just answered my own question!
We’re looking for that 5 wave drop now, so yes, you’ve answered your question.
Thanks Peter,
A clear story.