
Update Thursday, June 30, 1PM EST
Here’s ES with the count to now. We have a corrective wave up. It will no doubt end at a fib number. The latest is about 2103. I had warned on the weekend that this is not a market that’s easy to predict. But it still lends itself to an ending diagonal finishing pattern. The first wave up is the largest of the pattern.
___________________________
Update Thursday, June 30, 7:30 AM EST
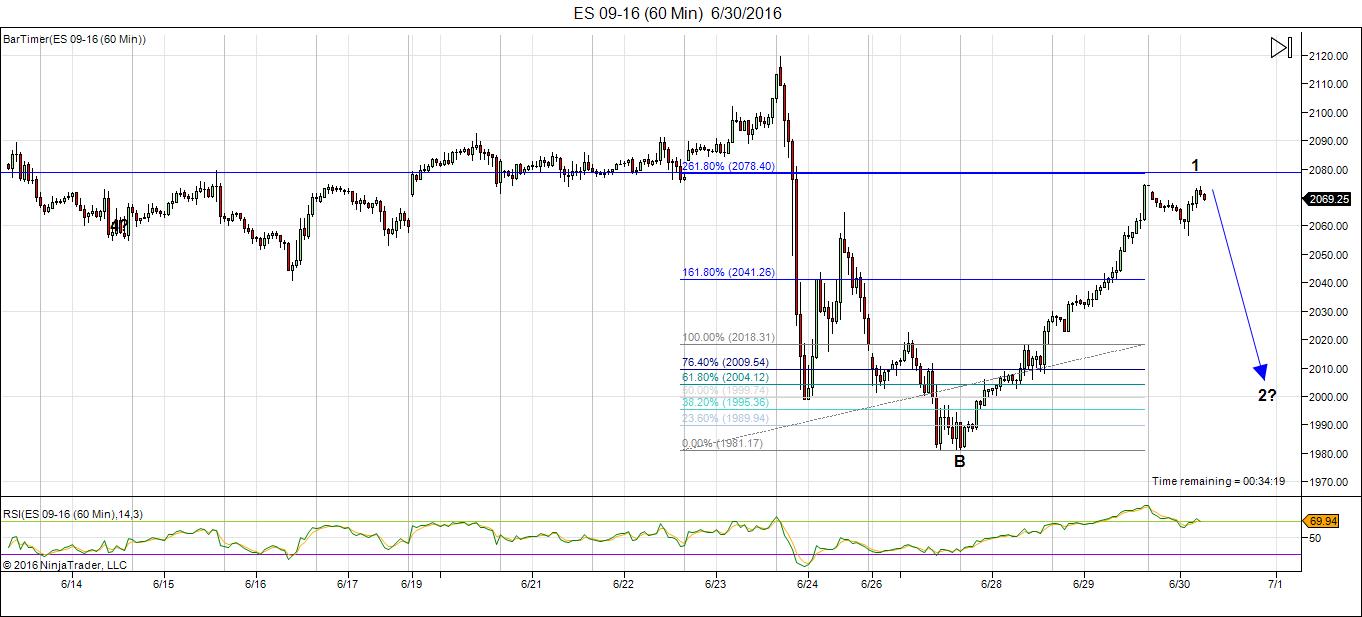
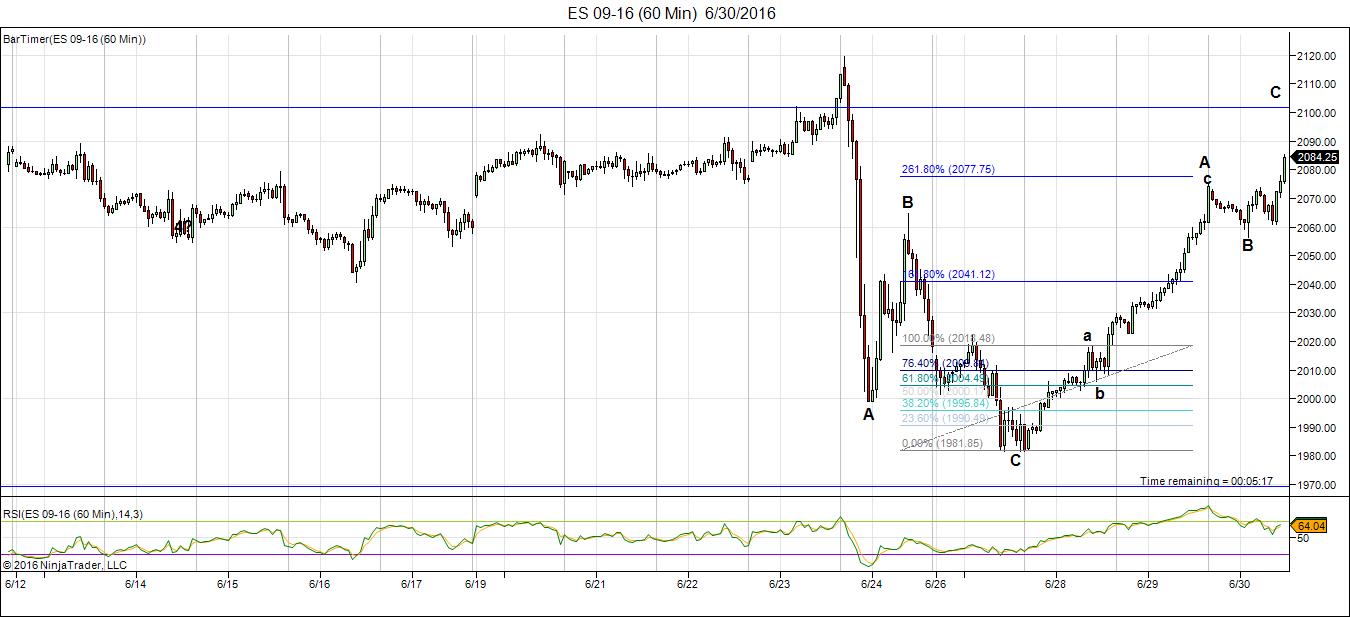
Above is the 60 minute chart for ES (emini futures). ES travelled up past my target of 2066, to another fibonacci ratio at ~2080, while SPX turned at the target of 2073. SPX may rise a little bit further at the open, however, it should turn down shortly thereafter. The 2.618 extension shown here is a rare ratio to extend to, but ending diagonals are difficult to predict, as I’ve said many times before. I think ES should turn around 2080 this morning and head down.
That said, it’s difficult to provide a downside target at the moment. That will be easier once we have an A wave in place. All the waves in an ending diagonal are in 3’s. You can see the projected configuration in the chart below this one. The wave down should last into early next week.
Currencies should also have a turn here this morning.
_______________________________
Update Wednesday, June 29, 11:20 AM EST
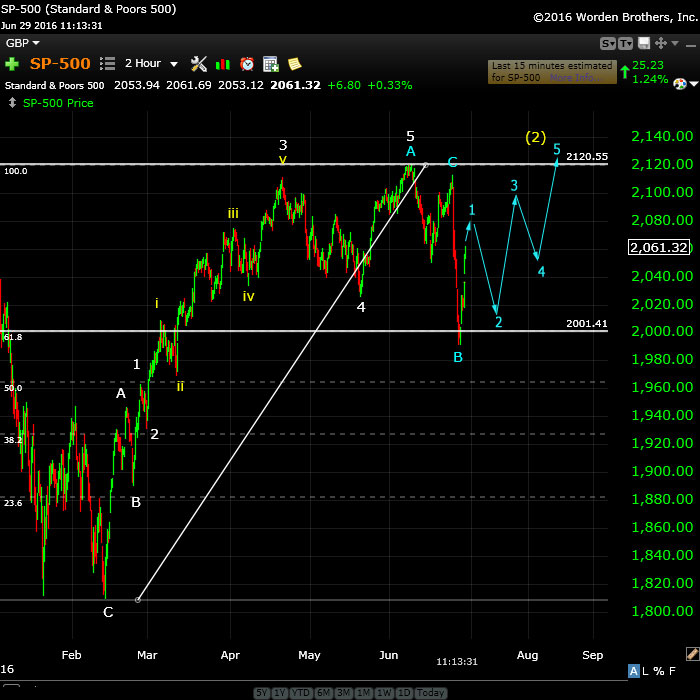
Above is the 2 hour chart of SPX. About the only possibility I see, based on this corrective wave up we have today, which should end at about the 62% level, a measured target, is an ending diagonal. This is what it might look like. This would mean a fairly good-sized drop after a top at about the 2073-4 mark.
All the waves in an ending diagonal are in 3’s, although I haven’t shown these, due to space limitations.
If we drop to a new low, however, we likely have a top in place. I would place this much lower on the probability list (which is a very small list!)
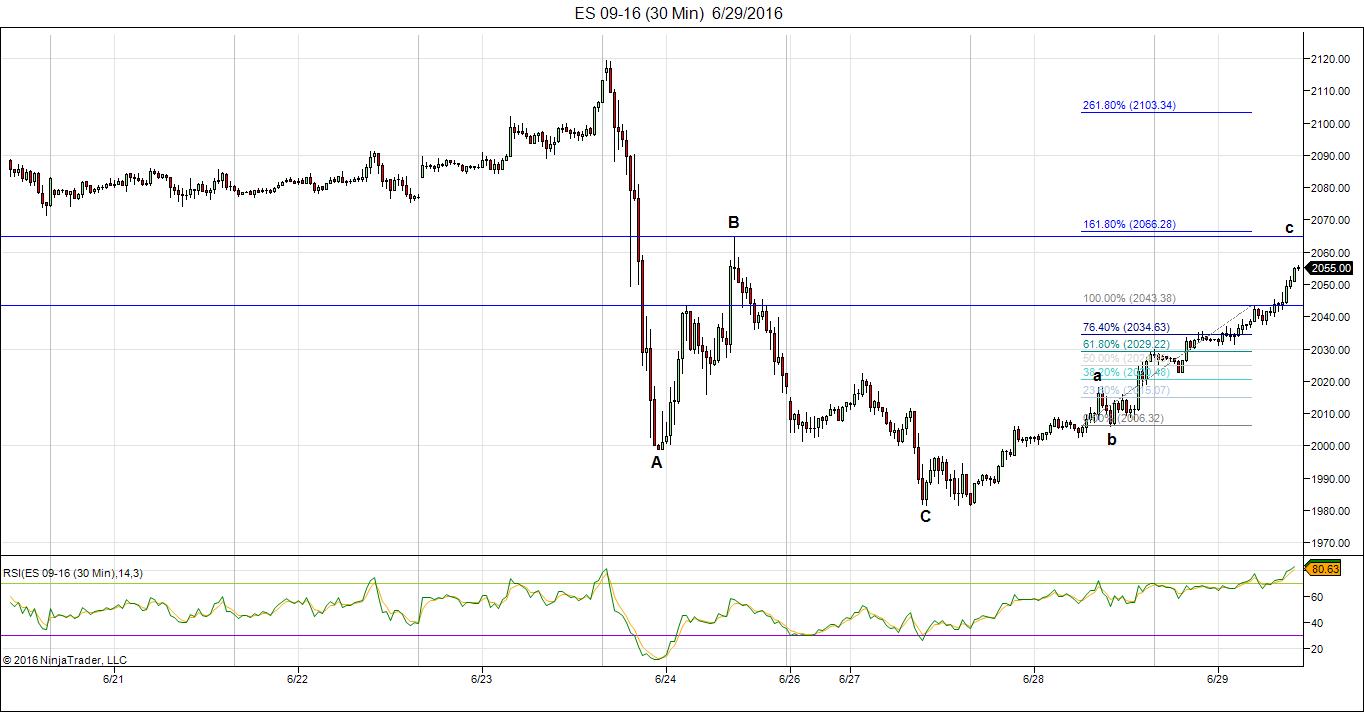
Above is the 30 minute chart of SPX showing the current corrective wave up inching its way towards the measured target of ~2066. If this is the first leg of an ending diagonal, we should see a large drop but not to a new low. At 2066, Wave c will be 1.618 X wave a.
__________________________
Update Wednesday, June 29, 12:10 AM EST
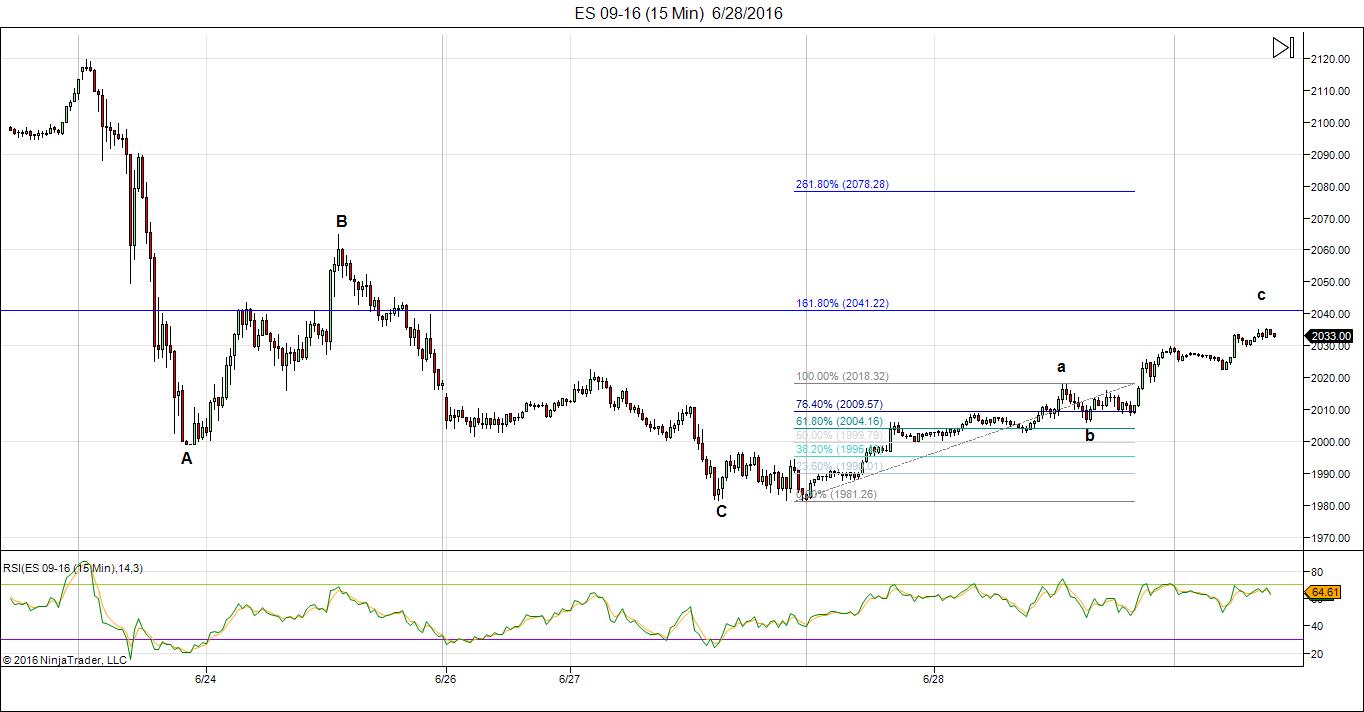
Above is the 15 minute chart of ES (emini futures). I’m showing the wave up over the past couple of days. It’s a corrective wave (5-3-5) and the turn point should be about 2041 based on the measurement on the screen. Waves in 3 retrace. I’m seeing triangles now in EURUSD. GPDUSD, and CADUSD that suggest a wave down.
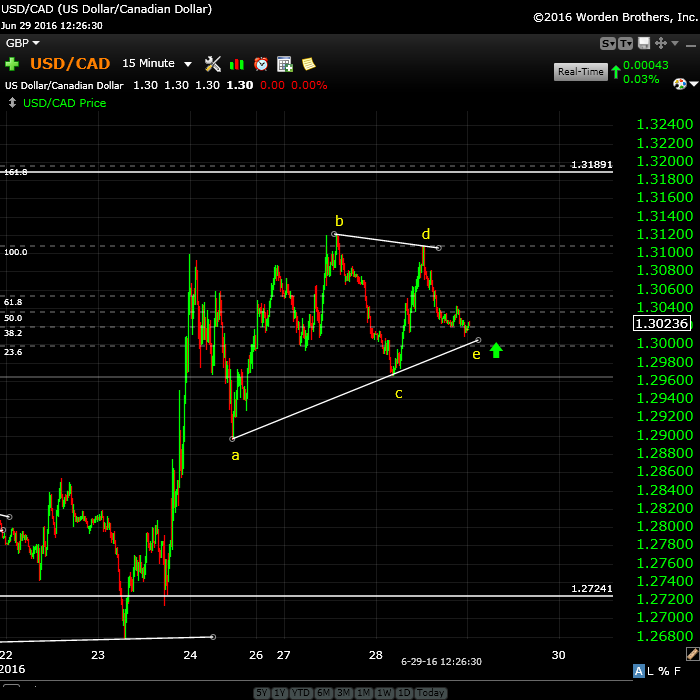
Above is the 15 minute chart for USDCAD showing the triangle that’s almost at an end. USDCAD moves in reverse of the US indices and the euro, so I expect them both to head down as the final wave heads up in USDCAD. The target here is ~1.3189 and then it should reverse and start the final wave down to a down bottom at ~1.2456
__________________________
Update Monday, June 27, After the Close
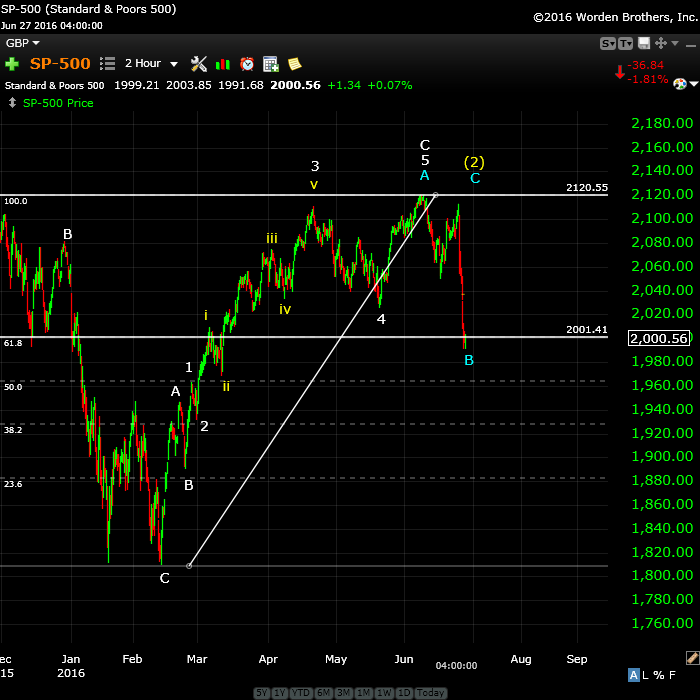
Above is the two hour chart of the SP500. I’ve relabeled it slightly to account for the B wave down, finishing today. This wave has come down to just below 38% (2001) which is a typical 4th wave (or B wave level). We seem to have bottomed (double bottoms in emini futures) and I’m calling for a final wave up to the top.
We morphed from my triangle pattern this morning to a B wave down. Although unlabeled, you can see that the subwaves of the B wave are in an abc configuration. Three waves retrace. In terms of the numbering of the large wave up from Feb 11, I’ve labeled the subwaves of the third wave. The third wave is composed of 5 waves (there should always be an even number of waves within a third wave) and so this numbering shows that there are. This leaves a final C wave up, which should now head up in five waves.
The alternative is that the C wave only rises 38% and turns over into fifth wave, but the wave pattern in the DOW doesn’t support that scenario. It calls instead for a new high (or at least a double top).
So not much has changed from my weekend video in terms of the direction. Triangles would have headed up in 3 waves. This final wave should be up in 5, unless it starts to form an ending diagonal, which will prolong the agony.
_____________________________
Original Post (June 26): We’re seeing the signs of a market about to turn. But to all those who are calling for an immediate drop, let’s just take a moment to reflect on what’s going on and not get too emotionally involved in a one day event. Here are a few thoughts:
- Markets typically do not turn on a dime. Topping is a process.
- Markets don’t come down in one fell swoop. They zigzag. Even motive waves with big drops have large second waves that attempt to reach back up to the top before turning over. You just have to look a the big picture we’re in now. This second wave almost reached back up to the top.
- Events do not change a market’s direction. They don’t change world mood. The markets move to the mood of the herd. The mood of the herd determines events. I’ve never seen an event change a trend.
- Markets turn on cycle turns. We didn’t have a major one Thursday/Friday, but we have some major ones coming up.
- In the Elliott wave realm, patterns have to play out and you can’t have an ending wave in 3 waves, unless it’s a triangle of some sort. We’re stuck in “no man’s land” at the moment. I’m looking for a top that fits the EW rules
So, for all these reasons, without even looking at the intricacies of the current wave structure, logic tells me we’re not done. But, at the same time, I think we’re only days away from a resolution. A little more patience is required.
Currencies have still not topped yet, although they’re very close:
As I’ve mentioned here again and again, the currencies and US market are becoming more and more tightly aligned. They’re all moving together as debt is being deleveraged. If you’re good at seeing patterns and mentally manipulating them, you can easily see them aligning and this helps you (me) forecast the market moves.
It certainly won’t always be this way forever, but they’ve been moving closer and closer into alignment for the past couple of years. Now the moves are almost identical, from a technical analysis perspective. All the US currencies are in the final wave. We’ll all reach the party together. The US dollar is still the reserve currency and it’s still in charge!
Bottom line: The cash indices are all down in three waves at the moment and this tells me we’re going back up one more time. In the process of coming down to where we ended up Friday, we destroyed the ending diagonal pattern, so we’re essentially starting over. Most indices did not hit a new low, so this puts them in a possible triangle situation (not an ending diagonal). If they bottom at the previous 4th wave low, it opens the door to an ending wave in 5 waves. As far as I’m concerned, the trend is still up.
I don’t know yet what the ending pattern will be, but I still don’t expect us to get to a new all time high. We are closer and closer to a turning point and when I see a pattern that I can share with you, I’ll tell you all about it here.
The rules for a trend change in Elliott wave are very clear. We need to see five waves down at small degree and then 3 waves up to at least 62% with an turn down at that point (that’s the entry point).
__________________________
Andy Pancholi’s Market Report Video
Here’s a link to Andy’s new market report video. In it, he takes you through the June report and shows you how to use it. http://cyclesanalysis.evsuite.com/mtr-20-june-2016/
Andy’s Cycles: In case you missed it, two weeks ago, Andy Pancholi provided a short little video looking ahead into July, which you can watch here: Andy Pancholi Special Report.
To purchase Andy’s high-end cycles report, click here.
Wave Three Down
Here’s a link to a projection for wave three down in the SP500.
New York: I spent last week in New York researching Dr. Raymond Wheeler’s legacy, specifically the Big Book. I placed a photo of it in the post for my Global Cooling video. I think it’s quite spectacular and I found some climate graphs that show climate back centuries and how climate changes mirrored changes in society. I don’t think these graphs have ever been seen before. I’ll be doing a video on them in the near future.
The mood of the herd is changing
Brexit is a clear indication of mood change. It’s one of the first steps in a major revolution against the elite, big banks, and capitalism (the way we know it now). Deflation is taking hold, more so in Europe than other continents at the moment, but it will spread world-wide. Even our music is changing, with more melancholy hits (Adele is a great example of this).
In that regard, I just posted a video on change.org to collect “signatures” to help raise awareness about Canada’s debt level and the interest we pay to private banks in Europe, rather than our own public bank (this goes against our constitution). If you’re a Canadian, I urge you to take a look now and consider adding your name to my petition. You’ll find it here: Take Back Our Money, Canada! This is Canada’s Brexit!
I have a few more videos to come and they’ll be hitting the site over the next week, hopefully. Then it’s on to finishing the book.
There will be some other announcements coming during the next few weeks, so it won’t all be dull and boring.
______________________________
Here’s a video overview of the market for Tuesday, June 27, 2016:
Market Report for June 27, 2016  |
 |
Make sure you zoom the video to full size with frame expander (arrows) in the bottom right hand corner and also set the quality to as high as your web connection allows. This is an HD quality video so the best viewing is at that level. |
_______________________________
The Charts Going into Monday
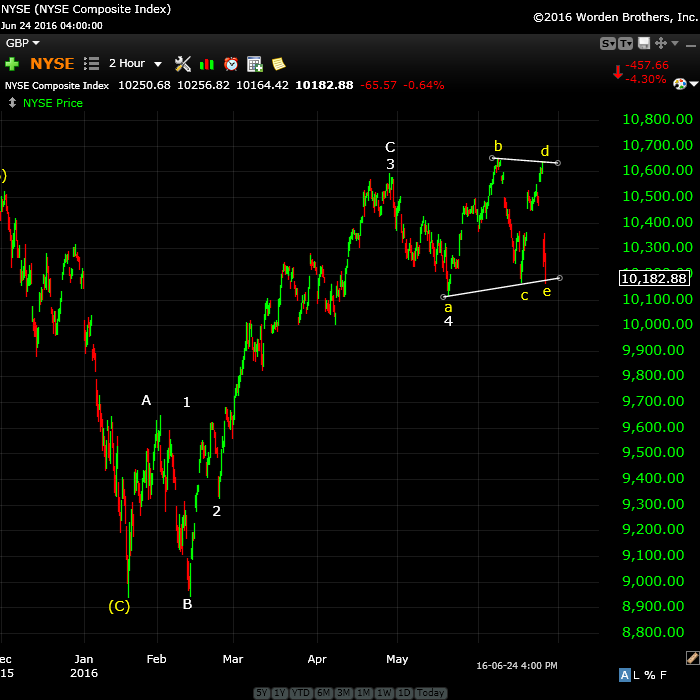
Above is the 2 hour chart of NYSE (the largest cap index in the world) and the one we really need to pay attention to for the US market. I had thought at first glance on Friday morning that the NYSE had done a double top, but on closer examination, it missed by about $10.00 or so. Usually that means we’re going back up to make it official.
The wave structure here is a little different than the SP500 so one of them is likely not correct. I just don’t have enough information to side with one or the other, at the moment. The bigger picture is that we seem to be in a triangle of some sort, which means the overall direction is still up.
The next major move down is a very large 3rd wave. All we need to do now is finish up the final pattern.
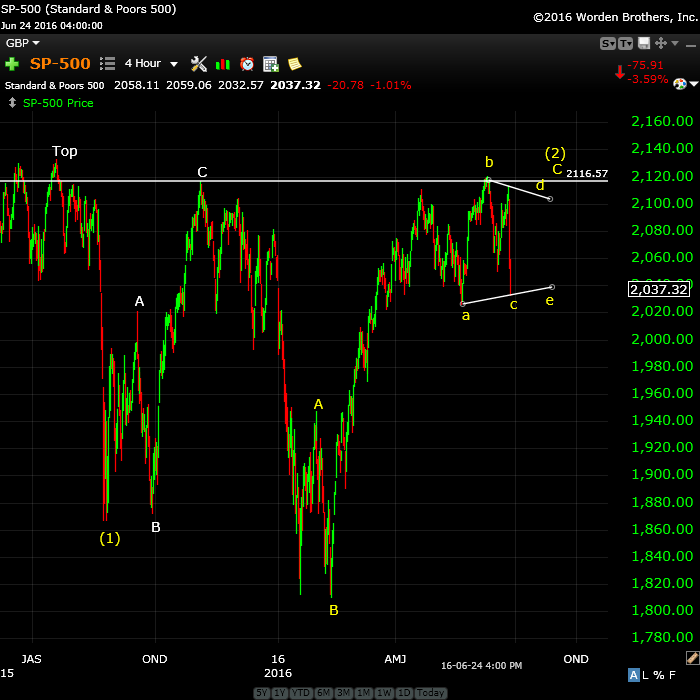
Above is a 4 hour chart of SPX showing the bigger picture. This has a similar look to the NYSE, although I’m showing two more legs of the triangle to go. I’m expecting to see a top to this second wave somewhere above 2116 (looking more like 2134 may be closer to the final high). That hasn’t changed. A zoomed in chart is just below.
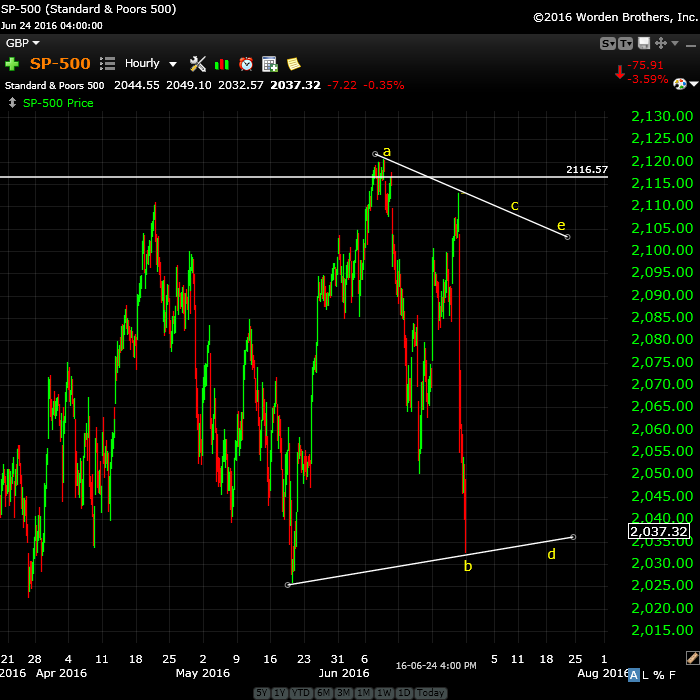
Above is the an hourly chart of the SP500, showing the triangle we still seem to be in. We’ve morphed from the ending diagonal to a traditional triangle. In that case, we need to at least tag the previous high at ~2120. However, in the video, I also show an expanding ending diagonal as an option. We need to see whether we drop a little further here or head straight up (or even head up 38% and then turn over into a 5th wave—but I have this as much less likely).
I don’t expect the SPX to reach up to a new all time high. However, it may get very close.
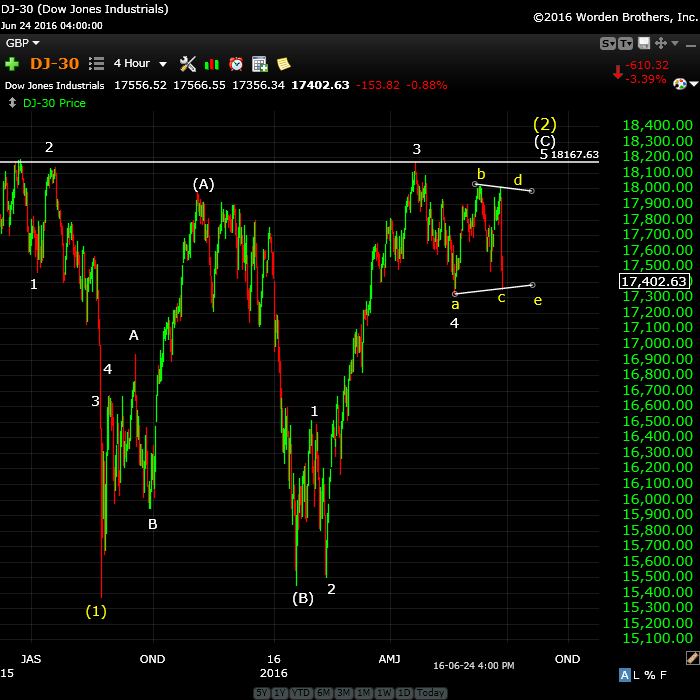
Above is the 4 hour chart of the DOW. It’s also showing a triangle setting up, similar to the SP500. My comments are similar here.
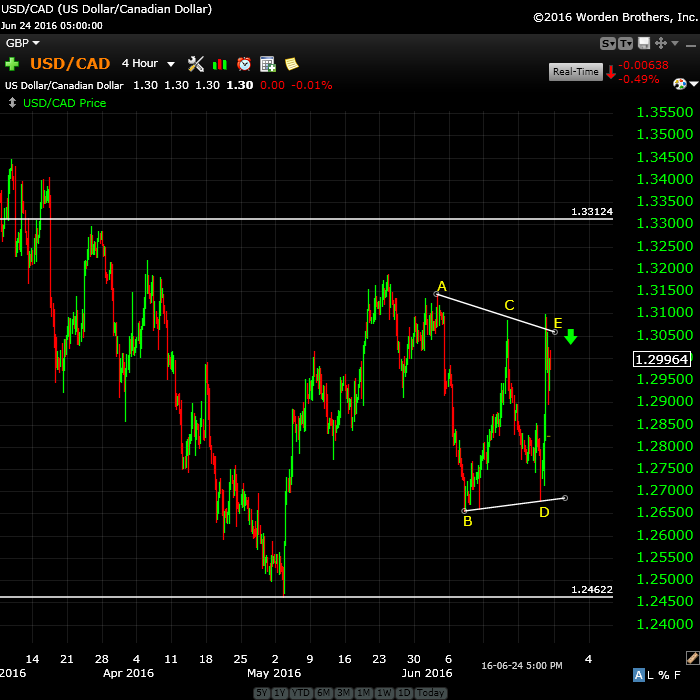
Above is the 4 hour chart of USDCAD.
This has been the most frustrating pattern to try to predict. It’s now traced out a triangle and should finally turn down to complete this final wave to a double bottom—the one I’ve been expecting for the past three weeks or so. The double bottom target is ~1.246.
After that, we’ll turn up in a very large fifth wave, which will eventually take up to a new high for USDCAD.
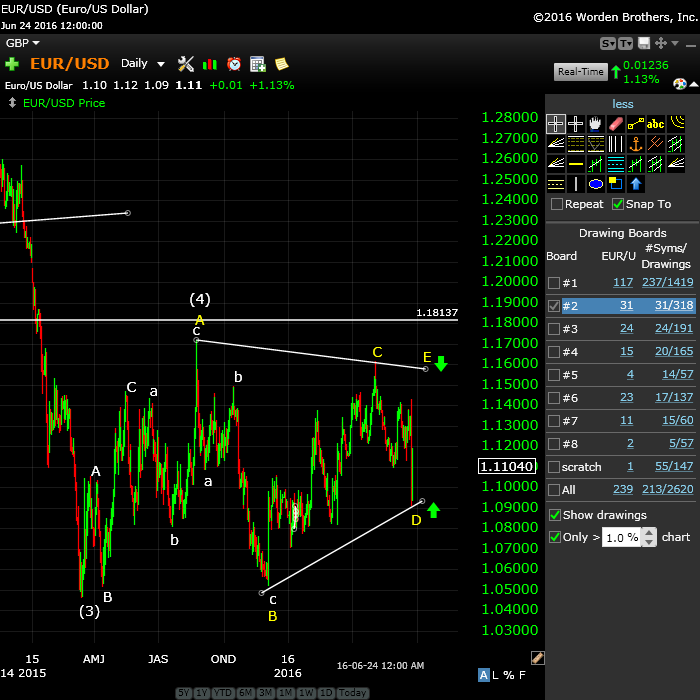
Here’s the daily hour chart of EURUSD showing the “4th wave” of the major corrective pattern we’ve been in since March, 2014. We’re in the final stages of a bearish triangle formation, with one more leg up to go to finish the E wave. Other than widening the triangle (which I’d mentioned might happen), not much has changed here. We wait for the E wave to complete and for a final turn down.
EURUSD should turn down after finishing the E wave in tandem with the US equities.
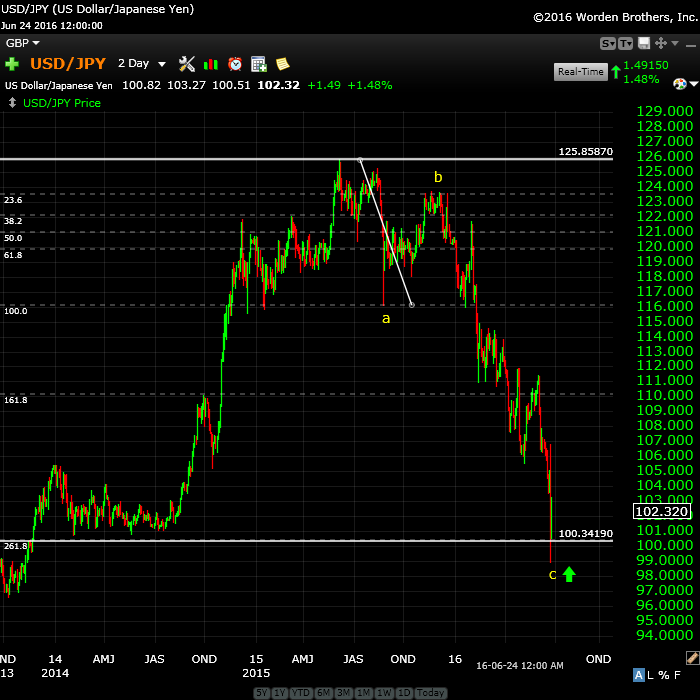
Above is the hourly chart of the USDJPY. We’ve now met my target at 100.5823 and headed a bit lower. We immediately bounced and now I would expect us to head back down to a double bottom. The next major move up will be to the upside.
________________________
First Wave Down – What to Watch For
This weekend we’re dangerously close to a top of a second wave (in the fifth of the fifth, with an ending diagonal pattern).
What we’re looking for to confirm a turn is a motive wave down in 5 waves at small degree. After that, we should get a second wave that will retrace up in 3 waves about 62%. That’s the preferred EW entry point. So don’t feel you have to rush in. There’ll be a much better opportunity at the second wave level than at the top and the risk is substantially reduced.
__________________________
History: The 1929 crash
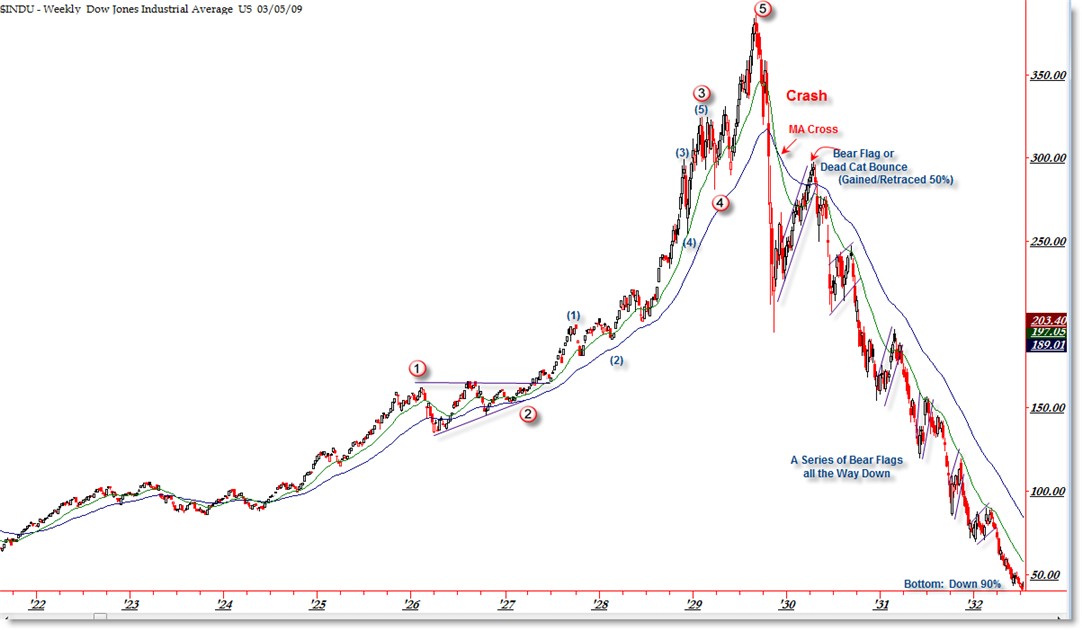
I think it’s important to look at 1929 and the wave structure (above and below), which was the same as 2007—to a point. I will show the 2007 crash below in the “What If” section.
The wave structure of the 1929 crash was in 3 waves overall. There were 5 waves down from the top (the A wave) and then a very large B wave retrace. The final C wave down was a stair-step affair and lasted over 2 years.
Let’s look a little close at the timing of the 1929 crash because the similarities to today are uncanny.
The market peaked on September 3, 1929 and then it took 2 months for the crash to actually happen (to reach the bottom of wave 5 of the A wave). The larger crash which we always hear about began on October 23, 1929. Then there was that large B wave, which lasted 5 and a half months and finally (which I explain a little further in the cycles section below), the C wave which went on for more than 2 years. This might be the scenario we’re looking at going forward.


Hi Peter. How about oil?
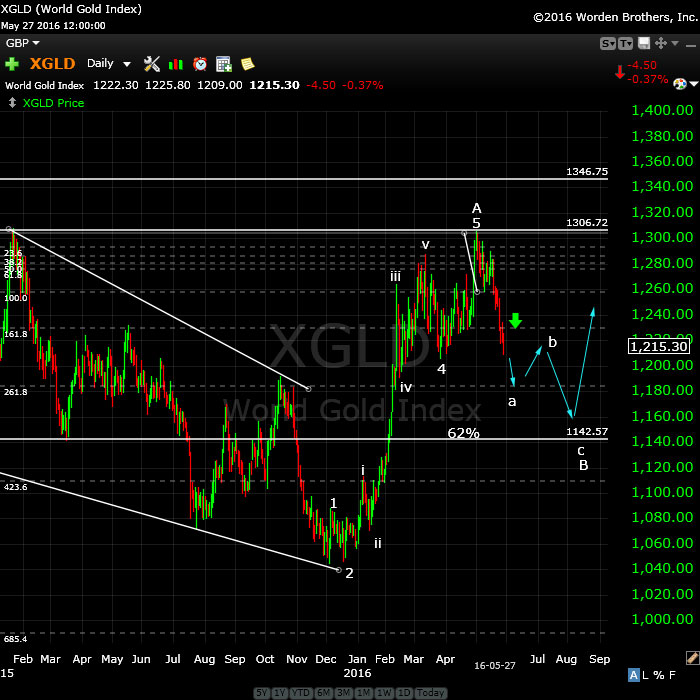
Oil hasn’t changed and I’m pretty sure gold hasn’t either.
So is gold still heading up to $62 before down? Thanks Peter
Sorry, I mean oil
Oil has a couple of options. It should either turn at 52 or 62, both are fib wave lengths to the A wave.
And also how about gold?
Hi Peter
very impressive post .
I’ll watch the video from my laptop
in the morning . all those triangles
the euro and the Canadian though
something seems a miss .
the spx and the Dow you’ve drawn
a compelling arguement .
August 1-3 still matters to me as it’s
the major key date . last year that same cycle
became a low yet in this case I favor it as a high .
the June 6-13th time frame was also an important
time frame for a high .
hate to say this at this juncture but I think
your spx chart is going to be that pattern that nails it .
way premature at this point yet if you look back at even
the 2007 top ( you can go further back )
failed bullish triangles at tops get ugly downside reactions
my issues with triangles has and always be watching
the prior B waves . looking at the Dow as well as the spx
those B waves ( I’m talking about the B waves with in an A B C move )
May not get taken out in which case we see something along
the labeling you have for the spx , this implies the Dow fails
the previous B wave is obvious to see on your charts even if not labeled .
June 6-13 a high June 24 a low from my model . I’m not convinced
Friday was the low but I must respect my work until it’s proven wrong .
Raymond merriman is watching June 30 July 11 th for a low.
regardless Aug 1-3 in my work should be the begining point
of the next leg down .
Jan 20 2017 low as well as a March 2017 low
Oct 2017 can be the major top yet Jan 2018
all of what we are dealing with today will seem like nothing
and the next great depression will begin .
benner business cycle still should be followed
it has a very good 90 plus year track record
Joe
Hi Peter
My wife and I live in central Florida . We sold our warehouses, and living in our r v.
We are thinking that the real estate bubble is going to pop and then we want to buy.
What are your on the real estate bubble popping in Florida?
Thank you.
Bill and Maria
Bill,
Soon, but I can’t give you a date on the turn. I think the bottom is likely about 2020-21. Commodities first, the market, then real estate, then banks—in that general order usually.
SP500 and DOW have broken the triangle. Futures appear to be bouncing, so it’s difficult to forecast what’s going to happen next here. I don’t yet see 5 waves up in futures, so we’re at least going to test the low again.
In the SP500, the C wave we’re in now is 1.618X the first wave at ~2001. The option at that point is either a bounce to 38% or a turn again up to the top, but the pattern remains open.
The big problem in being more definitive is the huge gap down, which means the subwaves are not visible, so a count on that wave is impossible.
My count is definitely wrong and the first pattern that comes to the top of my list now is that we’ve topped. SP500 has dropped to the 38% level from the top to the Feb 11 low.
If we’ve topped, we should bounce here to a level of ~2044 SPX (to complete a fourth wave) and then head down in a fifth wave.
Which gives us a target of the fifth wave after the the 38% retrace of 1920-1925? 1.618* Wave 1?
Ted,
Yes, it should. If we turn at a 38% bounce, I’d feel more confident in a top. Right now, it’s difficult to say. Not a lot of hard clues. The C wave down that we have now is the right length in cash indices. ES and YM topped a and have single wave down, but NQ did not.
Peter-
I know you haven’t put up a chart yet, but are saying last thursday may now be the wave 2 high or that it was the truncation?
To Clarify, last thursday was Wave 2 of of this first larger wave 1 down.
Truncation meaning wave 2 of the larger degree count.
Wave 2 is OK – that’s not the truncation. yes, the option is that last Thursday is the top of wave 2. The ending of wave 2 didn’t finish the pattern, so it would be a smaller truncation in some of the indices (or perhaps all of them). It’s extremely difficult to call this thing while everything is in motion, particularly with subwaves missing.
Ted,
It would depend on where wave 4 ends. It can’t go into the area of wave 1, so it can’t go higher than 2025.91 but the area you cite is good for now.
This would mean a truncation and that’s the thing that leaves some doubt in my mind. The DOW particularly has a ragged top—the pattern would need a new high. So while I’m bringing this idea to the top, the futures have a different count and this would put the entire market out-of-sync. So I’m making this call with a fair amount of caution. The market is a mess from an EW perspective right now.
Peter, how about Usdcad?
The wave up in the indices is in 3 waves, so it should re-test the low. Right now, I can easily see this wave down as a large b wave with a c wave that would retrace to new high to complete the second wave. Either that or we get a fourth wave retrace, which would only retrace 38%.
However, futures look to be down in 3 waves (as does cash). Everything to me still suggests we’re not done with the topping process, but we’ll have to be a bit more patient to get a bit more information. I’m on the fence with small bias towards a complete retrace to the top.
Thanks so much Peter
Elizabeth,
Based upon where the B wave for USDCAD has bottomed tonight, I suspect it has to go to 1.3188. That’s exactly 1.618 X the A wave. It will also create a double top. It should go to a double top because this mess of waves are all in 3’s and it needs to drop to the final low (still 1.24612) in 5 waves, so it basically has to top so it “can start all over again.” I also see the need for EURUSD to drop to the previous low as it has a spiked bottom, which usually doesn’t last. This should also cause the US indices to drop to the previous low.
Then everything is in sync for the final wave up. That’s what I’m seeing tonight.
Peter,
While the triangle may no longer be right, I believe it has simply morphed into an expanded flat for the 4th wave. On the DJIA the drop from the 24th high looks like a 5 waver ending diagonal for the ‘c’ wave of the expanded flat.
Currently the S&P is not showing such a clean 5 down for the ‘c’ wave though.
correction to my comment above: …from the 23rd high…
Purvez,
Exactly! But I want to see a bounce here and then pass then 38% retrace level to be sure. But this is my bias. I wouldn’t say expanded flat because that requires the final wave to be in 5 and we don’t have that (of course, I can’t see the second wave because of the gap, but since there isn’t one in futures, I suspect there isn’t one in cash). Simply a zigzag in my books – we wait to see what happens. Thanks.
Peter, my expanded flat start back in late April. Certainly on the DJIA from the 23rd top, on a 5 minute chart, I can see 5 waves down. I’m not in my usual environment to be able to post a chart….apologies.
I see what you mean. However, this final wave down is clearly in 3 waves in all the cash indices. It doesn’t really matter; same outcome. We’ve dropped to the 38% level, so that suggests a 4th or B wave. I’ll work on the a chart once the market settles down.
Here’s the DJIA chart from the 23rd June high. I’ve drawn what looks like an ending diagonal in 5 waves with an overthrow built it.
https://postimg.org/image/4k0oga7nr/
Sadly I can’t do something similar with the S&P.
Now we have arguably 5 waves up in the bounce in the SPX, ES, etc, so if we get a second wave down (not to a new low), we should continue up.
I added a chart of the SP500 at the top of the post with some notes.
Bill
you can find data on the case shiller index for housing here:
http://us.spindices.com/index-family/real-estate/sp-case-shiller
you can download it to excel to look at data if you want to dig ..
i have found it useful .
Peter
i want to thank you for your currency posts . Ive noted i don’t follow
them all that closely yet i am realizing why you do
Joe
Joe,
I like them because of the leverage, you can easily scale in and out, and right now, there are some big moves.
We’re at an inflection point right now in usdcad, with a turn at the 62% retrace level, which should result in a large third wave move to the target.
Hi Peter
Thought id mention something i am noticing on the cash Dow weekly chart .
ill start with the high the week of may 18 2015
the dow fell in 3 waves 18351 to 17465 then bounced to just above the .618 retrace
yet failed to hit the .786 then collapsed .
24 weeks later ( following that weekly top )
The next high in early nov 2015.
the dow again fell in 3 waves 17977 to 17116 then bounced to just above the .618
yet failed to hit the .786 retrace then collapsed .
24 weeks later ( again following that top )
the once again topped and has so far fallen in 3 waves and is only now
bouncing . assuming this bounce follows the previous 2 scripts
we should once again poke above the .618 retrace and fail to hit the .786 retrace
and then collapse .
a top to top to top to bottom count makes the case for an early oct low .
this fits within the puetz cycle . whether or not it proves true we will find
out later yet its worth making a note on it as it would be a perfect fit.
aug 1-3 high sept 1 low ( solar eclipse ) sept 16 high ( lunar eclipse )
full moon oct 16 ( 6 days before to 3 days after = Oct 10-19th)
lastly something odd i just found which may be of interest
August 18th may be Lunar like ?
http://www.timeanddate.com/eclipse/list.html
http://www.timeanddate.com/eclipse/lunar/2016-august-18
Ive never seen an Almost lunar eclipse yet id keep that in mind
as a potential B wave high .
Food for thought is all .
The DNA of the previous highs are very similar to today is all im saying
Joe
I think we should get a turn down somewhere close by in futures to do a second wave. We’re close to what I’d consider a previous fourth and we look like we’ve just about completed five waves up.
Hi Peter
One last note on the same weekly chart of the cash dow .
the week of august 24 2015 Low plus 24 weeks ( interesting to me as
it is also a high to high as noted above )
aug 24 plus 24 weeks = week of feb 8 2016 ( low to low )
plus 24 weeks =week of July 25 2016 ( yes 🙂 ) Following week is
the week of aug 1 2016 which is my key day as well as now a key week.
How this market holds up for a month i have no idea the previous
2 declines were only 1 week advances yet they were also shorter
on their respective A waves 7 weeks versus this one being 10 weeks.
Coffee time
Joe
Joe, your July 25 date is interesting. If you match up 5/20/15 and 4/20/16 as day 1 of a cycle, day 67 is 8/24/15 for the former and day 67 for the latter is…7/25/16.
I refer trading days to the above post not calendar days.
1 last comment
the week of oct 17th is lined up using the NYA Weekly chart .
Week of june 30 2014 Plus 60 weeks = week of aug 24 2015
pus 60 weeks = week of oct 17 2016 <——— its going to matter
Slightly different then above yet
week of nov 2 high plus 25 weeks = week of april 25 2016 high
plus 25 weeks = week of oct 17 2016
and the puetz window will be in effect along with the mars Uranus
cycle and we are in a technical bear market as per venus/mercury/sun.
Im going to sit back and wait for this bounce ( which will be torture )
and ill get short and hold .
Aug 18th a wild card at this point yet its noted .
Joe
Joe,
Short term I have a July 6/7 High after that a big fall till July 13 after that up till end of the month.
Great info Joe. Keep it coming!
Here is a laugh
Maunder minimum wont cause the earth to cool ?
http://www.forbes.com/sites/brucedorminey/2016/06/27/sun-has-likely-entered-new-evolutionary-phase-say-astronomers/#5b4f31b6278e
USDCAD continues to frustrate. It’s now go its eyes on a double top, by the looks of it at 1.312. It has a very nice (what looked like a) motive wave down and turned at exactly the correct spot, but it passed the 62% retrace level and has kept going.
I still expect it to bottom properly because the larger waves all all corrective.
I would guess USDCAD is going to 1.3148 (1.618 X the A wave up on the 5 min chart).
ES should drop to 1194-8.
Was that a typo on ES, Peter?
Oh, yes. Sorry. Thanks for catching. 1994-8.
Peet,
You know I prefer the 1194,8 right? 😉
Cheers,
W
W,
I’m saving it for later.
PALS next three days:
Phase: bullish
Distance: bullish
Declination: bullish
Seasonals: bullish
Summary: betting on the long side with vxx puts, and leveraged spy etf. Possible pattern would be bouncing this week on SPX 2000 to 2040, and then rather rapid ascent next week to 2200.
Nice trade Valley. I went long yesterday. Sold out longs late today. Small short at the end of the day.
The markets will probably be on the higher side due to end of the quarter window dressing.
Thanks Dave. Good trade also. Good luck with your trades this week!
ES is now above the previous fourth wave. I’m expecting a retrace, but now the wave up doesn’t look to be in five waves, so maybe the game is an ending diagonal, which means waves in 3’s, which will be very difficult to predict. It doesn’t look like we’re going to get a traditional 5 waves up in the indices.
If we’re going to get the alternative (a fifth wave down), there are a number of places we could turn in SPX. The 38% retrace level is at 2041. It’s difficult to pinpoint the previous 4th wave. We can’t retrace above 2050.37 as this would put us into the area of the first wave, which would mean the waves down are definitely not motive. That’s about all I can offer at the moment. There’s not a lot to go on.
Peter – Is there a possible count that calls for a new low on ES below yesterdays print prior to the final rally up?
I think I just posted in the previous comment.
Peter – I understand your comment as it relates to the cash market. Looking at futures ES it would appear the retrace has already put us into the first wave. Am I reading this right?
Aaron1,
I doesn’t really matter. ES is up in 3 waves. They’re all pretty much the same.
This wave up could also just head right back down and do a double bottom. The C wave down in most cases is 1.618 the length of the first wave, so you’d expect a complete retrace from the level. Doesn’t mean we can’t go down and test it. So far, the wave up is in 3 waves.
Looking around all of the charts (currencies and equities), it makes the most sense to me that indices are going to head back down to test the low. Currencies seem to be pointing in that direction. This is a guess mind you, because I have no EW structure to pin that on.
Thank you Peter. I will be stalking for a short tomorrow then perhaps a few minutes after open.
Other odd reason for my bearish bias tomorrow is the number 666. 🙂
SPY low 6/16/16,
6/24/16 (2+4=6),
6/29/16 (9 upside down is 6) or 2+9=11 unlucky number
Hi Pete,
I have been wondering why you do not give the analysis for GBP/USD pair ?
Thanks
Bid,
With the hours I put into this free service, I have enough on my plate.
June 29, 2016 (tomorrow) is Andy Pancholi’s next “Key turning point”…?
http://cyclesanalysis.evsuite.com/mtr-20-june-2016/
Does that mean we are going up or down? We were going down then a big up day today. I’ve been a subscriber to Andy for a few months but I don’t get how to interpret these turns too well
Charlie, I interpret his video that we should have a high and turn down tomorrow. I would look for a turn early morning. (Possibly 10:30 am ) I personally got out of my longs from yesterday late today. Went with a small position short, will add more if my indicators line up. That is my interpretation, perhaps some one else may add theirs. All the best to you Charlie
Charlie,
I depends on where the market is on the day. Cycle turns never predict direction. Some are more obvious than others. The 29th is a minor turn date and only for equities. The major ones have just about everything turning at the same and there are typically two of them a month (in Andy’s service). Elliott waves provide the direction.
If we stay up here all night, then I would expect the turn in the morning and we’ll go down, but just to the previous low I expect.
So Charlie,
The way this is playing out, your June 29 turn date for the indices should happen today with a fairly large drop over the next few days, but not to a new low.
Normally we would rally into and possibly through the holiday weekend; also the planet aspects get more climactic after the 4th as opposed to before the weekend.
Interesting stats from Detrick on what happens after a 3% drop on Friday. So far the only positive Wednesday had a red Monday and red Tuesday. https://lplresearch.com/2016/06/28/what-happens-after-a-big-drop-on-a-friday/
Nice catch, good eye Liz. Good chance for a down day than. Not guaranteed thou, but those odds are pretty good.
Nice to see your coming with similar dates LIZH
i usually start with weeks just because its easier for me
to look out further .
John
not knowing how you come up with july 7th high end of july low
i can only say that from what im looking at and ill note i look at
as many angles as im able to and study others work who i reference
from time to time and then research . the august 1-3 date will be
important in my work . historically its the starting point of a crash cycle .
the market doesn’t have to crash but if it is going to then that would
be the starting point . its like the puetz cycle ( which is in addition to what im looking at on those early aug dates ) , it doesn’t always work
but when markets crash they are always involved involved
( and i am looking at 3 cycles saying the same thing )
bottom line : until i am proven wrong im going to stand by the aug1-3
time as a top of importance . i have studied the set up for far to long
to call it otherwise .
if you turn out correct then from early august to late oct the market would
scream up and that would throw the cycle low which is due in jan way off
all of that would imply something like 19500 on the dow and i just don’t
see that yet ill adopt it if proven wrong .
until then i am going to stick to my work and my dates as posted above .
the ven merc sun cycle is roughly a 20 month cycle low to low .
the cycle peak was june 13th – its low is in march 2017 ( when it turns bullish )
puetz cycle runs from aug 1 to oct 10-19th ( 6 days before to 3 days after the full moon on oct 16. the mars uranus cycle you can look up that by name
mars uranus crash cycle ( arch crawford and raymond merriman ) i found their diagram for that cycle which they studied over 86 years ( 43 2 year cycles )
ven bull and bear markets were studied by barbara koval and she went back
100 years on that study . her book is called time an money . and i have gone a step further and defined some mathematical timelines . to go one further i have my own
planetary model which i have been using for the past 12 years and i have spent many years prior to that just trying to figure out how to build it .
it is a combination of everything except pluto and i had to use a nautical almanac
lastly james mars langhams work who is another planetary guy whose book was written in 1939 . i have taken everything that has worked 80 percent of the time
and have combined it together .
nothing works every time not even fibonacci yet that is also something i use for timing purposes . lastly the work of the late george lindsay as well as robert prechter . i have spent so much time focusing on timing methods that i come to this site because i have found that peter is one of the very few people who gives
an honest wave count . my methods on Elliott wave have morphed into my own style and while i try to be strict on the wave counts my timing methods have
caused me to come up with very odd wave counts because i attempt to put my timing methods into my wave counts .
if you notice peter does a similar thing , he uses timing and wave counts together
yet his primary method is Elliot wave and i tend to primarily use timing then adopt
the wave count . peter keeps me in tune the the wave structure which helps me
also peters use of the currencies has opened my eyes .
what ever happens going forward will be a combination of time and price and wave structure . i don’t ever know for sure what is going to happen .
what i try to do is formulate the if this then that scenario .
based on timing my if aug 1-3 is a high then i would say for me there is high
odds oct is a low . jan 20th is a low and march 2017 is a swing low ( probably a higher low yet that is many months away )
MY intent is to be bearish from an early august high and to minimize and or exit that stance in mid October yet i will not even think of becoming bullish until
jan 20th 2017 .
that is just my plan .
we all must plan our trades and have a good understanding of what we anticipate .
the downside objective for the dow ? somewhere between 15472 in oct
and 14368 in January . my bias is the dow will fail in the price area of 17902
on a print basis yet on a daily closing basis i should have a very difficult time
closing above 17808 .
if im wrong ? 16812 is the next stop ( i just cant see that though at this juncture )
I’m long many stocks at this juncture which is why i sit back and let the market
do what its going to do . the problem with over trading is it is to much work
and the cost of trading will wipe out your account in the long run .
my style is to pick the ideal date and position trade .
its a slower trading style is all .
nuff for now
joe
Joe, I can not imagine the amount of hours you put into the market. I appreciate all the info you provide for us. I personally have a possible high my self for July 7th Gann date. I also have a Gann date for a new low of Dec 6th. I suspect we may have a significant sell off from July 7th testing our recent lows than retrace back up to the Aug 1st time frame. As mentioned before on this blog, we have a low for the Dow of 14340 – 14,430 this year. Dec 7th give or take a week. All the best to you Joe.
Joe,
This is what I said :
John June 28, 2016, 11:57 am
Joe,
Short term I have a July 6/7 High after that a big fall till July 13 after that up till end of the month.
Looking at Andy pancholi video I see a high around July 7 and a low a around July 13/14
So after that it is up .
Thanks for all your information just like Peter you put in so much effort
Joe,
I looked up your post you made end of March until now you nailed it.
Joe March 30, 2016, 9:53 am
Hi Peter
For what its worth , the puetz cycle has worked out again
to the bullish side .
the cycle began feb 8th ( + – )
the momentum high should come april 7-11th ( new moon )
the cycle ends at the end of April which is coincident with the
beginning of mercury going retrograde .
mercury retrograde cycles are not always bearish yet it will be
worth watching .
the mars uran cycle has a peak aug 4th and sept 23rd
the low of that cycle is jan 20 2017 .
the cycle peaks in my work are:
April 11
may 9
june 6 < —-
July 5
Aug 4th <——-
considering the sell of from the march 4-7th high
we should at the least see a decent sell off from the april 7-11th high
i look forward to your update from this weekend after this week
has done what ever its going to do .
Joe
i looked up Andy pancholi and watched his video
tonight .
the article i read ( i do research ) make a comment
about highs and lows in the ftse .
these 2 links give me more confidence
yet it is my notes for further research.
i always like as much information as i can find .
food for thought
http://www.independent.co.uk/money/jump-clear-of-the-market-when-mars-enters-libra-1275891.html
http://www.moontracks.com/mars_ingress.html
ES turning point is likely to be 2041. EURUSD and USDCAD are both in triangles and very close to a turn (in the final waves). They will likely all turn at once.
Peter, I am curious how you decide the time interval for charts and the corresponding EW analysis. I know the charts can look quite different by changing the intervals.
I start with a daily or hourly and then use the appropriate chart for the pattern I see. It also depends on how much I want to show (and how much I want to label!) I try to keep them the same interval for multiple indices on the same day, so it’s not confusing. Currencies, of course, have a wider range. It also depends to some degree on how much has changed from the last posting.
I just posted a chart of ES.
I added a chart of the USDCAD triangle.
Peter, please help me understand…probable sell off in ES from 2041ish back down toward the recent Brexit lows. Then we rally back up to the highs…alternatively this rally could perhaps be a wave 4 and we head back to lower lows for a 5 wave move off the recent highs…and therefore the highs have been made already. Is that even close?
Thanks Pete for the sharing and great works.
Do you think that with the Brexit it will change the cycles pattern as not usual ?
Thanks
Cycles come from the solar system, so no.
ES is at at the target. It’s a couple of points above my measurement. However, I measured the extension of the A wave. The C wave is the exact length of the A wave at 2043.5, which is what we have, so we’ll see if we turn at the open.
Looking at ES (the entire wave up), it’s almost straight, although is has a small b wave within it. So I would expect that if we turn, it will be into a b wave and not to the low, with a C up to follow.
This is an incredibly difficult market to make any sense of at the moment.
It’s algos, not the people. No brain, no fear, no psychologie.
The next probably stop for ES is 2066, which is the top of the 2nd wave spike and it’s also the point at which the C wave will be 1.61* X the A wave. Other than that, I haven’t got a clue what we’re doing.
It’s exactly the same ratio for SPX, with a target of 2073.65. So that looks like the target. What happens then, is likely a turn, but not sure at the moment where we’re going then.
There’s always the possibility that this is the first leg of an ending diagonal.
btw, the wave up is now in the area of the first wave in SPX, so a fourth wave (and fifth down) is out of the question.
Peter, Have been out for a few days, away from your work. Are you saying we may be heading down without a trip to 2120 first? Regards, TAJ
No, just the opposite. But I’m looking for a pattern of some sort, so I really don’t know what we’re doing, but I don’t see us having had a top.
What is strange that euro is not following the rally
Yes, I’ve noticed that and that’s why the scenario I etched out yesterday seems to still have merit. I think USDCAD needs to double top and EURUSD double bottom. The only change is that they will finish their final wave as we finish an ending diagonal in the US indices. All of them will be in 5 waves, which makes sense. We’ll see if that, in fact, plays out.
Peter:…’first let of an ending diagonal’.
I’d been struggling with this wave up until you said that. That was the ‘light bulb’ moment for me. Now let’s see how far down it comes.
Funny. I’m actually just drawing that out on an SPX chart.
I’ve added a chart at the top of the SPX with the possible ending diagonal drawn out.
Also added an updated chart of ES.
A note re: USDJPY. It will need to bottom properly, but needs to complete a C wave up first. The whole process is likely to take some time. The bottoming should happen as the larger US market tops.
Peter, through an Elliott Wave perspective, is there any thing preventing a market from hovering within in a certain range in perpetuity. In other words, must a market go up or down?
First of all, a market that goes sideways in perpetuity isn’t a market. It would have to have no human involvement to do that.
Second, the market moves based on the mood of the herd, or masses, which is influenced by the movement of the planets. So the planets would have to stop revolving around the Sun. This is the reason fibonacci ratios are all through the market (the ratio of the distances between the planets is 1.618). If you’ve watched my videos, you know I believe we’re influenced by electromagnetic waves, but the intricacies of that are still to be pinned down. The science is pretty clear about the basics of it, though.
Or we could all be hit with some sort of zombie virus on a world scale … 🙂
Markets can go sideways at tops and bottoms for a time, but in the middle, they’re in patterns and patterns have certain shapes, so it’s difficult to see what forces might be at work to cause them not to move up or down. We’re fairly emotional beings and life tends to go on, particularly at the present time.
So the answer is that human mood moves the market, and that being the case, I can’t see a market devoid of emotion for any length of time.
In conclusion to your question, Peet ment to say ‘yes, a market must go up or down’! 😉
Cheers,
W
PS: Peet, hurry up with that book since I love the stories (with stories I mean the way you write the truth down…) you are telling! 😀
Looks like Andy’s turn point was off today as the markets keep chugging higher. So does that mean we skip to the next turn date to figure out when the next expected significant move to the downside?
Charlie,
it’s nothing to do with Andy.
The market goes up because I’m short today (Denise Gartman too) ?
Dimitri,
I hope you’re not equating yourself with Gartman!
Gartman lol… What an ****!
Andy will be right imho, I have the turn from my own system @ tomorrow. 😉 I think we will continue down. Next turn @ the beginning of July (4 to max 8, I prefer 4).
Cheers,
W
It was a trend up day so my short stalk will be postponed to tomorrow. If W’s system is correct and tomorrow is a turn then today and yesterday’s SPY candles are reminiscent of 8/26 & 8/27 or 1/21 fast fwd to 1/29.
Charlie,
Do you look at my charts and comments? We’re now about 8 points away from a top in ES (2066-that’s less than 10% of the entire move up). The session ends at 4PM EST (in other words, we have 30% of the session still to go). The projected turn date for SPX is today. I would expect a turn by the end of today. Currencies are all poised to turn in the next couple of hours, as well.
What am I missing?
Peter,
you are maybe missing the “window dressing”.
It’s last day of the month and the quarter tomorrow.
Oh well then. Let me go look up “window dressing” in The “Elliott Wave Principle.” It likely negates everything.
And with that, I’m not around for the rest of the day.
Interesting tidbit, 5 of the last 7 quarter ends have had a down days.
Sorry Peter for the confusion. I’ve been following the fundamentals for 35 years and in recovery 😉
EW and turning points are new to me. Thank you for all you do! I’m learning a ton. What I meant was it looked to me like the turning point was early (happened yesterday instead of today). Markets were down 5% or so from the last top then reversed course yesterday and today. With Andy’s next turn point scheduled for today I was expecting a reversal day today but that didn’t happen so my question was how do we approach it? Wait for the next turn date?
We had a downtrend in place and that reversed into an uptrend yesterday and continued today. Now a turn date came and went with no direction change. Do we wait for the next turning point to expect the tide to change, I think it’s Friday?
Charlie,
You seem to be having a particularly difficult time with this and I’m not sure how I can make it simpler.
Today was a turn day. We went up today, tomorrow we go down. That’s a turn. I expected it to be like that once I got a handle on the wave structure, which was difficult. It appears to be leading towards an ending diagonal, which I posted a chart of. There will be a few more minor turn days over the coming week or two, if that’s the case.
Most market turns happen either at the beginning of the day or at the end. It’s not very often that you get one in the middle. Usually once the trend for the day is set, it tends to last the day.
A turn day can happen anytime within the twenty four hours that make up a day. The 24th was a turn day, but it happened after the session ended (that was Brexit). I hope this gives you a bit more clarity.
Yes! That makes perfect sense. Thank you for the detailed explanation. Now it is crystal clear.
Charlie,
While I’m thinking about cycle turns, let me add to previous comments. What we saw yesterday was in fact, a cycle turn. But it was a minor turn. It turned at the top of the A wave. However, it was supposed to be a major turn. It wasn’t. The 24th was a major turn.
I went back to look at Andy’s document and I’ve sent him an email on this. I usually look at the spreadsheet for the major turn dates. They are always the ones where you see everything turning at the same time over about a two day period. I had written down the 23rd/24th as the turn date based on the spreadsheet but I see on the cover of Andy’s document, he listed the 29th as the major turn date. I think he may have copied that date improperly to the cover.
In any event, you should go by the spreadsheet more than what’s on the cover. The clusters on the spreadsheet are the major turns. Hope this clears up some confusion. It certainly did for me once I went looking.
Now look what you guys did. The turn will come; it always does. Thanks Peter for all you do.
Mars turning Stationary Direct this evening; Mars has played a very tough hand lately and now all these wound up situations have to unwind.
SPX ready for the next drop
jobjas.wordpress.com
Peter thank you for giving us your insight and hard work in revealing to us the cycle theory and your valuable market insight. I now have confidence in trading using your charts and market predictions. I am short the SPX and will trade as we get future dips.
I will soon be purchasing your monthly cycle forecasts.
Thanks, Ronny,
Lovely note. With all the hubbub, apologies for not acknowledging sooner. 🙂
Charlie
just a thought for you to think about .
you said Andy’s turn date didn’t work today .
before you take that date as a failure look at
these turn dates like this . I’m going to simplify this
as best I can . say you have 3 cycles which work perfectly
( yea I know that can’t happen but consider it for a minute)
1 cycle is say 23 days low to low the next cycle is 46 days low
to low and another at say 100 days low to low ( just making a point so don’t think those are all real )
what if at certain points in time all of these cycle dates converge
within days of each other ( all calling for a low )
what happens is they each feed off each other as the market comes out of those combined cycle lows .
I would not say his date failed is all I’m saying .
as for the others John and Dave thank you 🙂 I understand the early
July high and your thoughts .
lastly
I think everyone should look at the weekly charts for a moment .
if you look back at the previous deep breakdowns ( the highs before the extreme drops ) take a look at the weekly chart and what do you see ?
I’m typing by memory so just look . do you see a 6 week A B C decline
from the top followed by a 1 week screaming rally ? and then the tanking market ? now look at the past 10 weeks and hapennd A B C decline
and this week ? screaming rally !
if the market was to repeat itself then it woukd crash next week .
I don’t expect that , so I think Peter is correct .
wave A now wave B then wave C ideally tops out in early August .
we are all on the same page
thank you everyone for your input
Joe
Thank you Joe. That is very helpful. We know this market has patterns and waves. I’m just trying to figure the current cycle out a bit better. Always good to keep an open mind then dive in and keep learning.
Charlie,
If we don’t top right here pretty much off the bat this morning, then I would consider the turn a “miss.” It looks like we have a touch more work to do, but I think we’re just about done. We’ll have to see what happens.
Charlie,
Now I would officially call this minor cycle turn a miss for yesterday. There’s another one tomorrow and I suspect that’s likely to be it. I tend to pay attention to the major cycle turns. I’m a little wary of the ones that show only equities turning and not currencies as they all seem to be moving together. There’s a major one next week, of course, that I would pay lots of attention to.
Joe,
Look again at Andy’s video’s he is clearly indicating ‘something big’ around mid July.
My dates are a turn down June 30 up again July 1 till 7 after that down till July 12/13 after that up again till July 21.
Joe,
If you look at the 10 year cycle (2006) the one wich Andy talks about in it’s video we should top around July 5-8 and go down again middle of July just an idee?
http://finance.yahoo.com/q/hp?s=%5EGSPC&a=05&b=3&c=2006&d=07&e=31&f=2006&g=d
The way the SP behaves is exactly the same like the 2006 cycle ( Andy),if this analogy will folow the same path we will top tomorrow or July 5 around SP 2009 like Peter’s chart.
I’ve placed a chart of ES at the top of the post.
Let me start off by saying “There are no stupid questions.” It’s certainly where I started my journey intro trading and learning about the influences of the universe. I make an attempt to answer fully any of the ones where I think I can be of some help, and will continue to do so.
I was disappointed in comments after I left the blog, the ones that devolved into name-calling. I’ve removed them. I had determined if we got to that, I’d stop this “experiment.” I was heading in that direction anyway, but this event is an undeniable signal that it’s time to move on.
I’ve tried very hard to help but this clearly isn’t the environment to have an impact, and the distraction is keeping me away from other work. It also impacts my ability to concentrate and be objective in my analysis.
My last free blog with a video and charts will be this weekend. However, I’ll continue to do up a blog post on weekends with a chart each time more directed at learning an aspect of Elliott wave, with a prediction when it applies.
What I was annoyed with yesterday was a comment about “window dressing” (in jest or not) that was highly critical of the 3 or so hours of work I’d spent mounting charts and trying to help determine what the structure of this pattern was, with projected targets. But more than that, it’s the education environment that got attacked.
You can call me anything you want or tell me I have no idea what I’m talking about—I’m OK with that, but when we start to make learning difficult for newbies and others who are attempting to learn what I think is one of the most difficult (yet rewarding) systems in the realm of trading, that’s what gets my back up. It was counterproductive because it sends absolutely the wrong message about technical analysis. I left fairly disillusioned yesterday.
Outside influences and events have very little to do with the overall movement of the market. Take the “black swan” event of Brexit, which was not a black swan event at all. It was predicted. We knew it was coming. We know the eurozone is going to break down. Andy P even predicted the exit in a video two days before.
And I predicted we would head back up, and here we are.
So … for those who are truly serious about learning Elliott wave, I’m putting together a course … coming soon, and I will offer a low cost EW introductory webinar in the next week.
I’ll also work hard to get a paid service up and running within the next week so there is no gap in coverage. My idea is that it will have a new, short video each night, an interactive chart show on the weekend (webinar format that will be recorded in which I’ll answer questions and discuss the market with charts) and have a restricted area in the forum for discussion. I’ll also have an area with EW patterns (with descriptions and rules) that can be accessed anytime.
Those are my initial ideas. If anyone interested has others (what you’d also like to see), please send me an email to peter@worldcyclesinstitute.com
It won’t be a service for new traders or daytraders. It’s for swing traders who want a good handle on market patterns and to learn EW so they can use it beyond what I have to offer. More to come on the weekend.
Peter,
“window dressing” was a joke after your question “What am I missing?”.
Just some distraction in this crazy market.
Sorry for that.
Believe me I appreciate a lot your work and am very grateful to you for your effort to help us to learn the EW.
Dimitri,
Well, I figured it likely was, but to someone who doesn’t know that, it makes my work that much more difficult, as I’m constantly having to make the points I made in my comment. And then things devolved …
Ok, I promise to stay serious ?
Dimitri,
I enjoy your humour. A little smily face would have done wonders. 🙂
Peter, thanks for your time and effort. I still think, we small traders and learners should not be punished because of some egomaniacs.
rose,
I agree, but I don’t know how to make that work. 🙂
We really appreciate your work. I think you are doing a great work to make us understand. Best will be ignore and not to answer all the irrelevant posts. It is a good blog, please don’t discontinue it just because of some.
This website is for educational purposes relating to Elliott Wave and natural cycles. I welcome questions or input about Elliott Wave, cycles analysis, or astrological input relating to any market. Due to a heavy schedule, I may not have the time to answer questions that relate to my area of expertise.
I reserve the right to remove any comment that is deemed negative, disparages the Elliott Wave Principle, is otherwise not helpful to blog members, or is off-topic. Posting trade specifics does NOT serve an educational purpose, is stongly discouraged, and such comments may be removed.
Want to comment? You need to be logged in to comment. You can register here.