
Update: Friday April 29, 1PM, EST
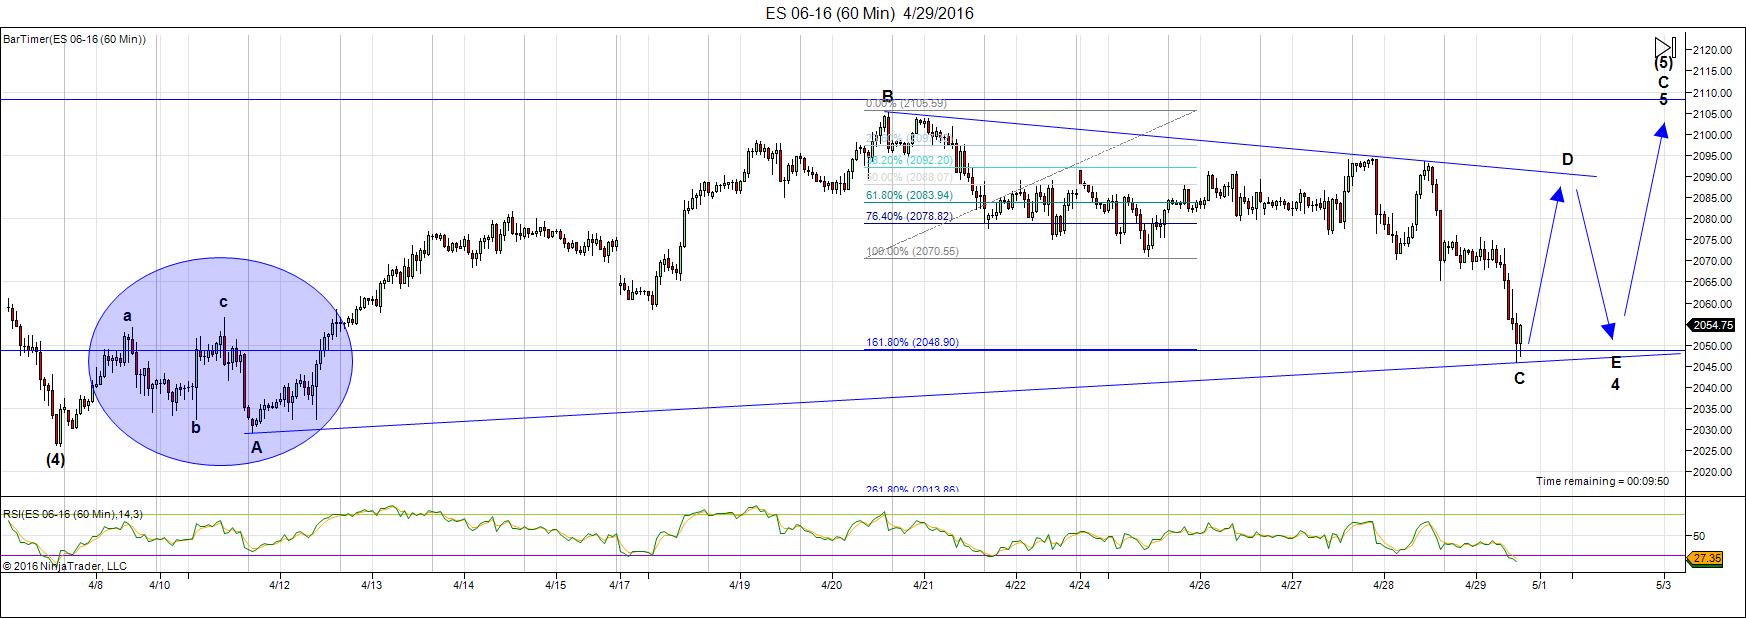
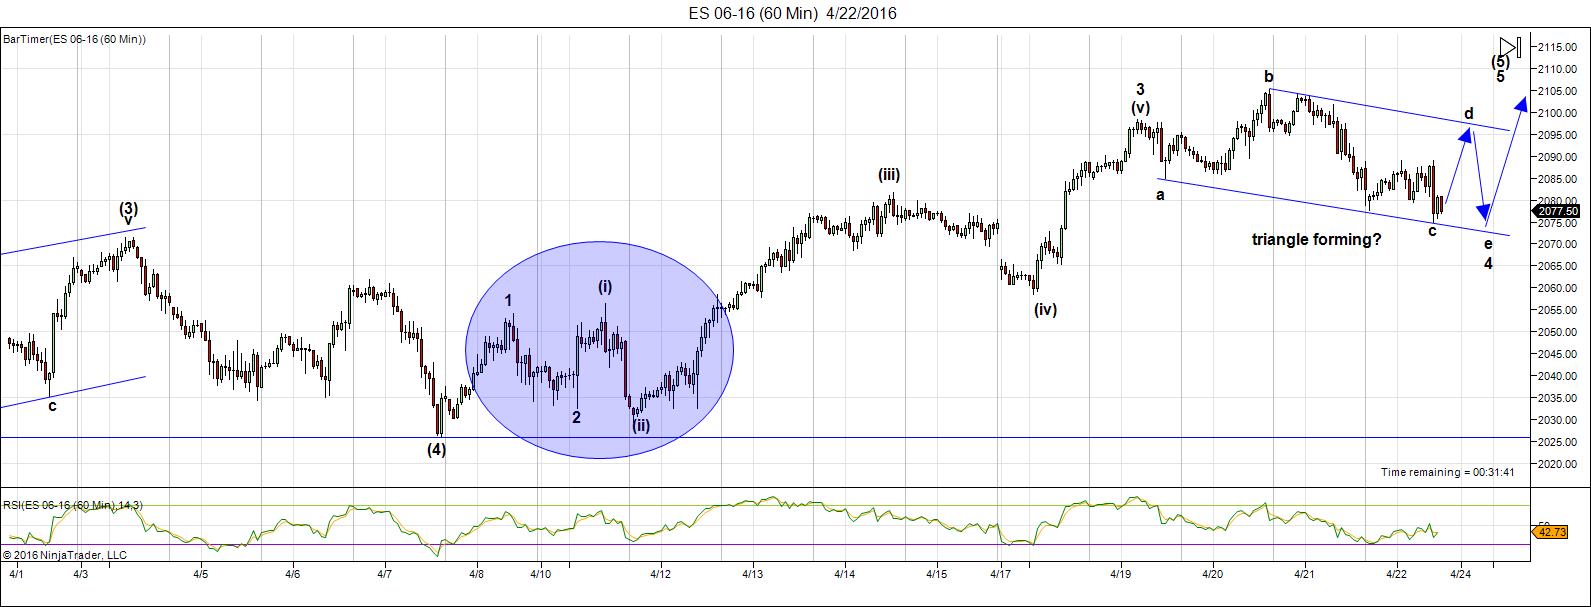
Above is the 60 minute chart of ES (SPX emini futures) showing the fourth wave triangle in progress. I will post a little study in the forum on the weekend so you can see how the blue circle area has resolved itself. If you’ve been following along, you know that I was having an issue with the c wave up in that area as it was in three waves. In hindsight, of course, it’s because this has been a triangle all along (and that was the clue).
We still need to trace out the D, E, and 5th wave up to the top. Although not shown by the arrowed lines, these waves will all be in 3’s and this will at long last end the larger second wave pattern.
I have overlain the fibonacci retracement tool so that you can see how the length of the C wave is the correct length (the ABC length is 1.618 X wave A). The wave down is in a clear 3 waves.
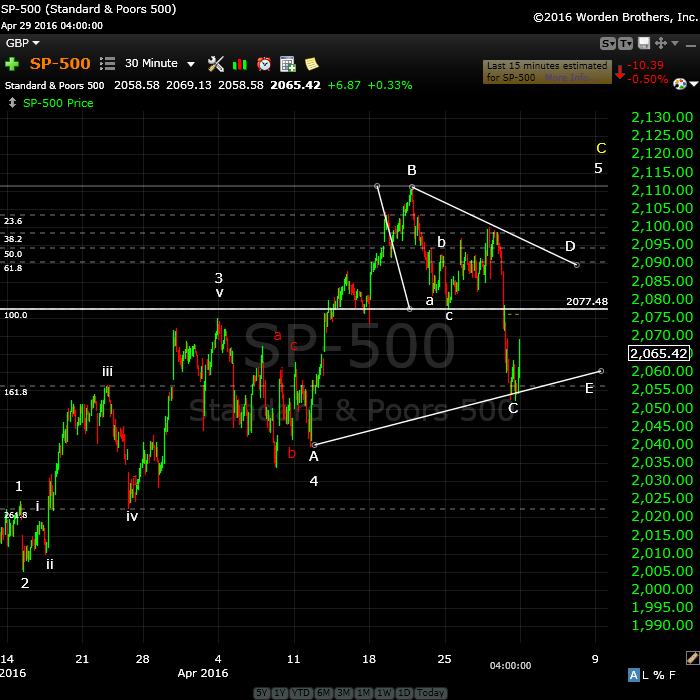
Updated at 4PM EST: Above is the 30 minute chart of the SP500 showing the same ending pattern—a fourth wave triangle. It will resolve in a similar manner to ES.
I’ve marked on the abc (lower case) labels so you can see that the A wave down (of the triangle’s C leg) is in 3 waves. This is the clue that the wave down that we had today could not be motive. A motive wave always has subwaves in 3 waves and this does not. Therefore, it cannot be a motive wave. The only option was some king of corrective wave and so it was relatively easy, once the wave down has hit its target, to see that we’d begun a fourth wave triangle.
Triangles are the final pattern before a single ending wave to the top, so it won’t be much longer.
___________________________
Update: Friday Early Morning, April 29, 12:15 AM EST
We may not be at the Ultimate Cycle Turn yet, after all. Cycle turns don’t tell us direction, of course. We’re looking for the top, but Andy’s turns have been highly accurate at the top of the third, for example, and other points along the way. This turn (April 29/29) looks now like it’s pointing up.
Today, we simply extended the fourth wave, tracing out a C wave. Interestingly enough, the height of the remaining gap between the bottom of today’s 4th wave at the end of the day and the previous most recent high is exactly 1.618 X the length of wave 1, as it should be. Let’s look at three charts: the DOW, SP500, and EURUSD.
The targets haven’t changed, and the labelling hasn’t changed. The fourth wave is simply a little larger.
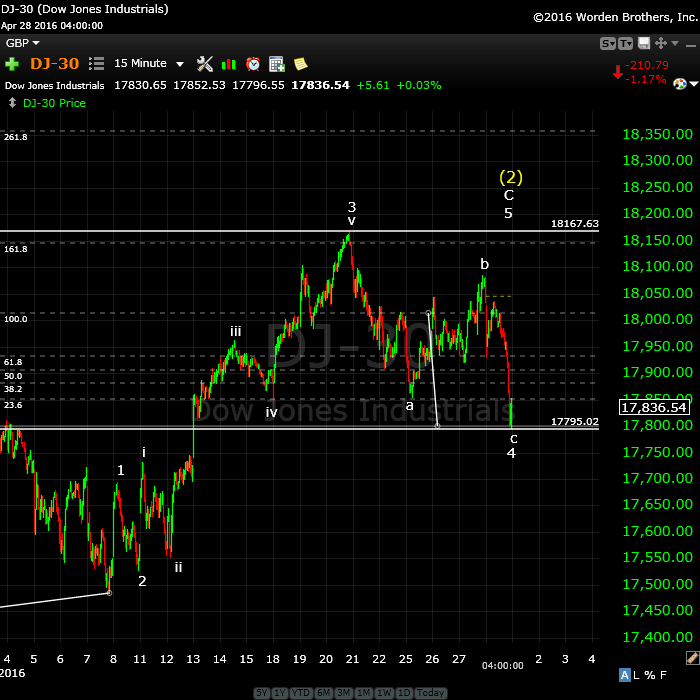
Above is the 15 minute chart of the DOW showing the larger 5th wave up in its entirety. I’ve overlain the fibonacci retracement tool across the gap between the bottom of the fourth and the projected top of the fifth. The length is 1.618 X the length of yellow wave 1, lower left corner of the chart, as it should be. We’re still looking at the same target. The direction is still up.
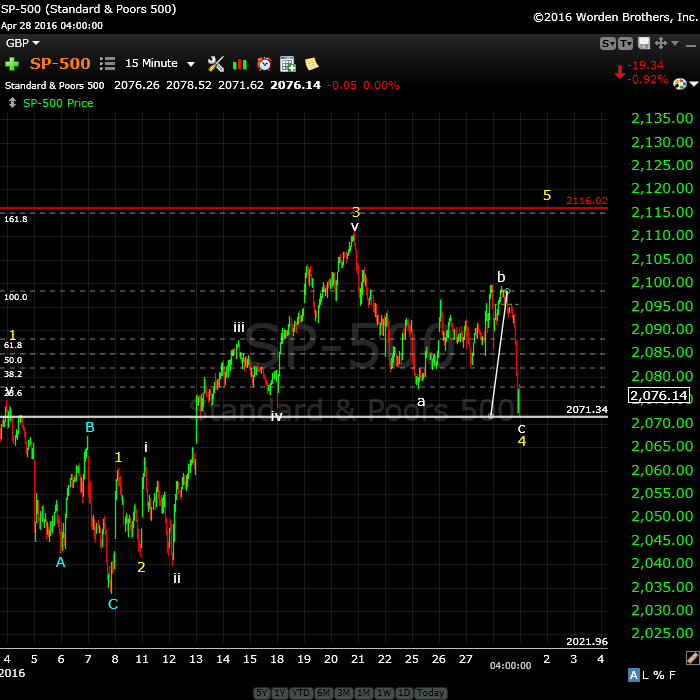
Above is the 15 minute chart of the SP500. It has exactly the same configuration as the SP500. Lengths of waves are relatively the same. The target is the same. The fourth wave is a little larger than it was yesterday.
In terms of the Nasdaq and NDX, the waves do not look motive. It too, has extended the fourth wave down. Analyzing NQ is a little tougher and I’m on the fence as to the structure of that particular wave at the moment. The related waves being corrective suggests it is also corrective.
ES (SPX futures) is clearly corrective. It still has to properly bottom tonight, by the looks of it.
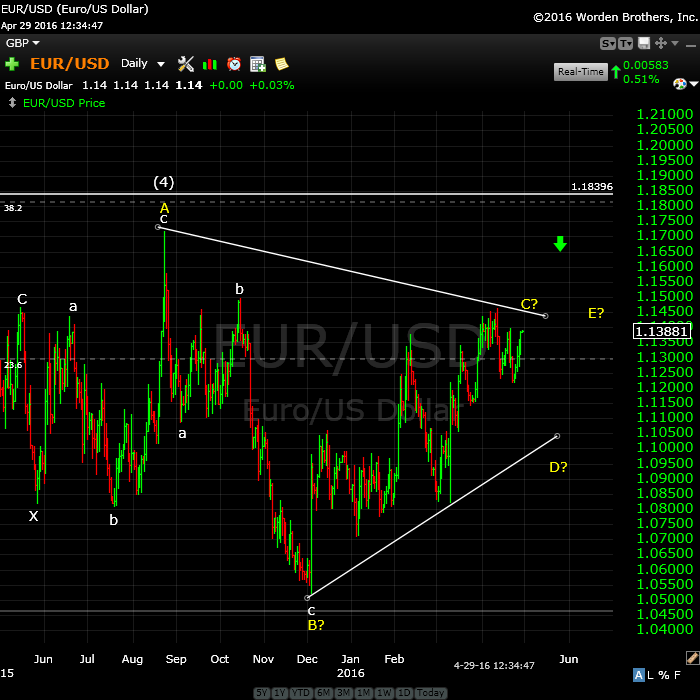
Finally for this morning, here’s a daily chart of EURUSD, which is moving in tandem with the US indices. It’s slowly creeping to it’s final target as the US indices top. There are three probably targets left here for EURUSD. It’s either tracing out a triangle, which means it will have a couple of other legs to go (D and E), it will head up to the current (4) high, or exceed that slightly to test the 38% retrace horizontal line just above it.
Once it hits the target of its choice, it will reverse downwards into a very large fifth wave. The turn is imminent here, as it is with the US indices.
______________________
Original Post (Saturday, April 23)
Welcome to the Top of the Third! (it’s also the top of the 2nd)
We’re here! Not right now, but later this week we’ll see the start of the big drop. Thursday, April 28th is the day—the ultimate cycle turn. We have Janet Yellen (Federal Reserve) in the afternoon before to kick things off (Wednesday, 2PM, EST). What could be more perfect!?
This is the ultimate cycle turn. Why “ultimate?” Because we’re going to head down into the third wave. This is the big one. It’s the one we’ve been waiting for.
From the Elliott Wave Principle: “Third waves are wonders to behold. They are strong and broad, and the trend at this point is unmistakable. Third ways usually generate the greatest volume and price movement, and are most often the extended wave in a series. Virtually all stocks participate in third waves. They also produce the most valuable clues to the wave count as it unfolds.”
Preliminary Targets (at 2.618 X the length of the first wave down)
- SPX: 1405
- DOW: 10,460
- NDX: 2370
Last week in the video, I brought you up to speed on a host of markets and I’ll do the same this week. The predictions along the way have been highly accurate. Put the Elliott wave count together with Andy Pancholi’s Market Timing Report and you have what I refer to as “The Holy Grail of Trading.” Cycles give you the major turn dates and EW gives you direction and price.
You don’t want to miss this once in a lifetime opportunity coming up—to capitalize on the largest crash in history.
This Past Week:
- the VIX hit a new low of 12.50 (it will likely hit a double bottom, before advancing up)
- put/call ratio is .776, the lowest in 2 years
- volume continues to tank and had been moving steadily lower since Feb 11
- breadth continues to drop—only a few stocks are keeping this market up. It’s earnings report time, and we’re seeing more and more of the big guys drop in large down waves
- 5 day sentiment hit 83.4%, higher than even the market high on May 20, 2015. As contrarians, we always want a high sentiment number at a major turn and we’ve got one!
These are all attributes of a market in the final stages of a second wave, ready for a trend change.
A word about events. Events don’t affect the market to any great degree, of course. Social mood affects the market (it’s a mathematical projection of the social mood of the masses); human cause events as a result of their mood. The recent Doha conference on oil was a great example. Immediately after the announcement that the conference was a failure, the oil futures markets tanked. It was a corrective wave in 3 waves.
Well, the media and pundits were all over the story, until the next afternoon when it retraced and eventually went to a new high. That was because it’s in the middle of a pattern that requires a full retrace. It will turn down when the pattern is done and not before. It got really quiet on the pundit front. They had no idea what was going on. But, they never do. They don’t understand how the market moves (Elliott waves).
All the Same Market. I’ve been mentioning for months now that the entire market is moving as one entity, the “all the same market” scenario, a phrase that Robert Prechter coined many years ago, when he projected the upcoming crash.
One of the frustrating elements though, is that when the market turns, it takes longer than usual to do so, because the entire world (in terms of the major indices, and by extension, the mood of the masses) is turning at the same time. So, in this report, you’ll see an underlying theme of currencies moving in lock-step to the US equities, because … that’s what’s happening, something I noticed last September.
The entire world is moving to the tune of debt and the deleveraging that has to happen. All bubbles burst eventually and this one is one that will go down in history, because it’s the largest debt bubble in history.
The direction of US equities is still up for the first three days, at least. Then I expect a big change. Thursday.
______________________________
Here’s a video overview of the market for Monday, April 25, 2016:
Market Report for April 25 REVISED  |
 |
Make sure you zoom the video to full size with frame expander (arrows) in the bottom right hand corner and also set the quality to as high as your web connection allows. This is an HD quality video so the best viewing is at that level. |
_______________________________
The Charts Going into Monday
Note that there aren’t huge changes from last weekend. We’re simply progressing in this final wave and are virtually at the final target. I’ll start with ES to give you an idea of where we left off at the end of the day on Friday and then we’ll take a look at the bigger picture. Everything is pointing to the same end point and a major turn.
Above is the 60 minute chart of ES (emini SPX futures). I’ve completely re-labelled this wave and I’ll tell you why. The circled area has always been the area of contention, because it sports an abc pattern. However wave 1 was in 5 waves. Wave (i) looks like three waves, though. I’ve labelled it as a 1-2,1-2 pattern, as a result (that wave in 3 is still an issue, however).
I’ve labelled the entire wave up as a third wave within a larger five waves, because each of the major waves look like they’re in 5 waves and labelled this way, there is no overlap. However, it’s unusual for wave (ii) to be lower than wave 2 (in the circle). Usually the third wave is fully within the confines of the larger wave enclosing it, but in this case, it has fallen slightly below it.
This would make the final pattern we’re in probably a triangle. This works for timing due to the fact that we don’t have a cycle turn until April 28/29 (right after the fat lady Yellen sings). A triangle warns of only one final wave up after it’s over and that wave up is usually about the same height as the triangle itself. My target for SPX is still 2116/7.
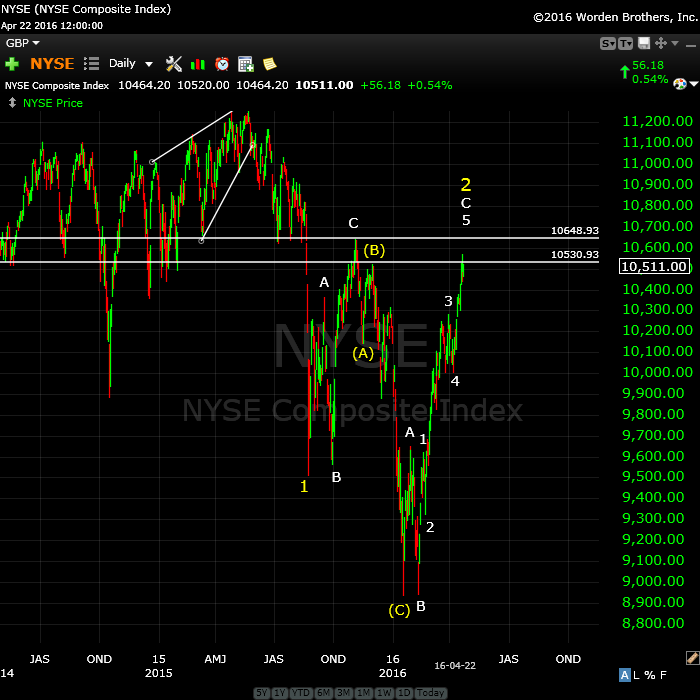
Above is the daily chart of NYSE. I keep a fairly close eye on this index as it’s by far the largest in the world (in terms on capitalization). We are at the top of an ABC corrective wave (a bit more to go). I’m expecting a termination of this 2nd wave up at ~10648. This would “correct” the truncation and end in a double-pronged second wave. Third wave down should drop to around 6100.
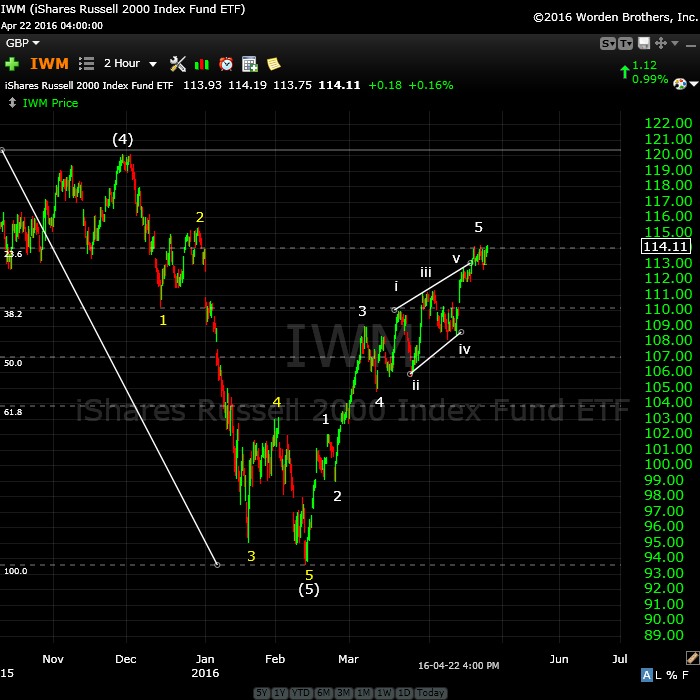
Above is a two hour chart of IWM (Russell 2000). It’s traced out a very obvious ending diagonal and just has the throw-over to complete. This is a small caps stock base and should give a pretty good indication of what’s happening overall. It has a little more of the throw-over to do and may end up even with the top of the yellow 2 wave.
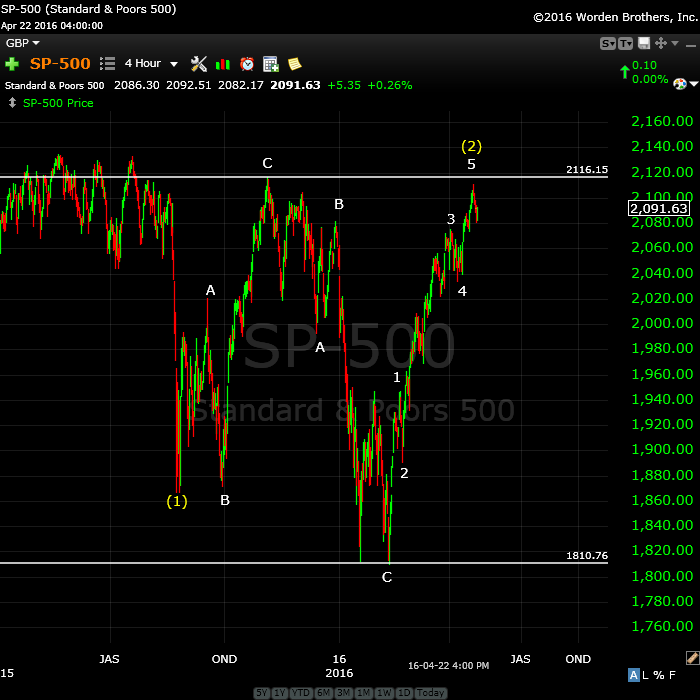
Above is the 4 hour chart of the SP500, showing the double 2nd wave top waiting to finish tracing out. This would negate the “truncation” and create a spectacular EW textbook set up for a huge third wave down.
Second waves have few restrictions. The key rule is that they can not retrace to the previous top. They should retrace between 62 and 100% (but cannot hit the 100% retrace level). I expect us to reach 2116 before a turn down.
It’s typical in a bear market for second waves to trace out a double prong (an ABC wave down in this case and a 5 wave structure up). The five wave structure, however, is not motive (subwaves won’t necessarily all be in “legal” 5 wave motive configurations).
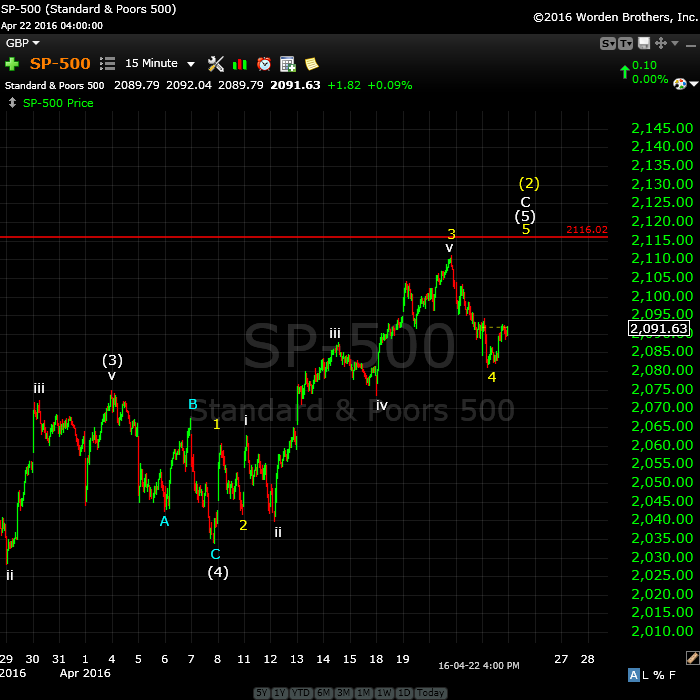
Above is the 15 minute chart of the SP500, so I can focus in on the wave structure of this final wave up. From the fourth wave bottom, we have a wave up in 5 waves. There is no overlap, so this suggests a simple 5 wave ending wave. I have re-labelled the chart to reflect the final ending wave structure in 5 waves. This wave now mirrors ES above, but we look like we’ll have a final wave up in 5 waves, rather than a triangle.
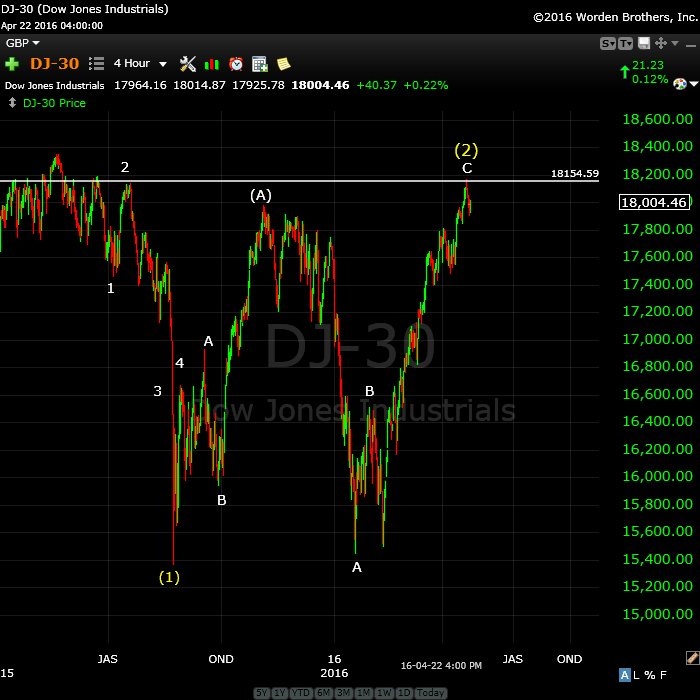
Above is the 4 hour chart of the DOW. It’s similar to all the other indices, as it should be. I predicted we’d reach the previous 2nd wave high and that in fact is what we’re done. Look for a double top with the most recent high before a turn down.
Note that just about everywhere I look at individual stocks, we’re in huge second and fourth waves spikes. This whole market is about to turn.
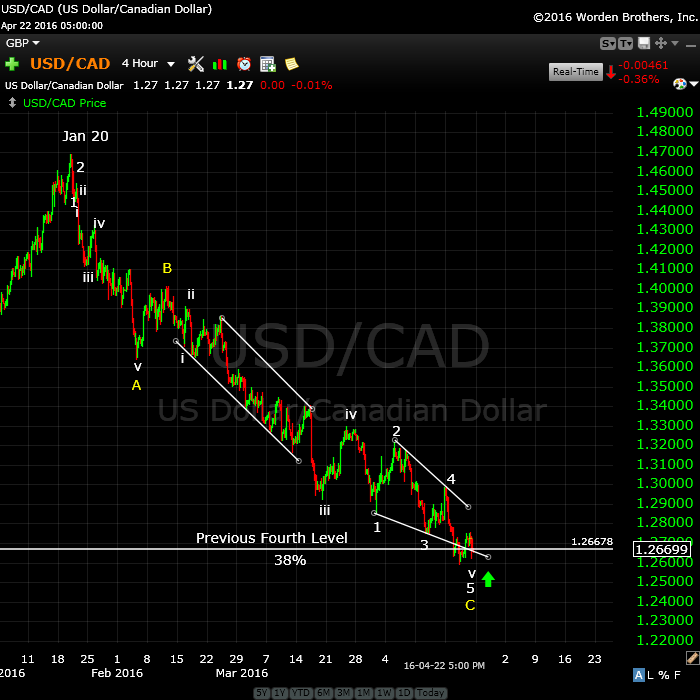
A Major Inflection Point: Above is the weekly chart of USDCAD. I have been following this for some time, and called the bottom of the third wave, expecting a retrace (although unsure as to how deep it would be).
The larger pattern is an ABC corrective wave, but the C wave is in 5 waves. We are completing the 5th wave of this pattern (an ending diagonal), which should reach the 38% retrace level (shown by the bottom white line) before turning back up. The labels have been changed slightly in the ending diagonal to reflect more precisely the ending wave structure.
Once it turns and heads up, it will head up in a fifth wave to a new high, a very lucrative trade. The euro, Australian dollar, dollar, and Canadian dollar are at similar major inflection points.
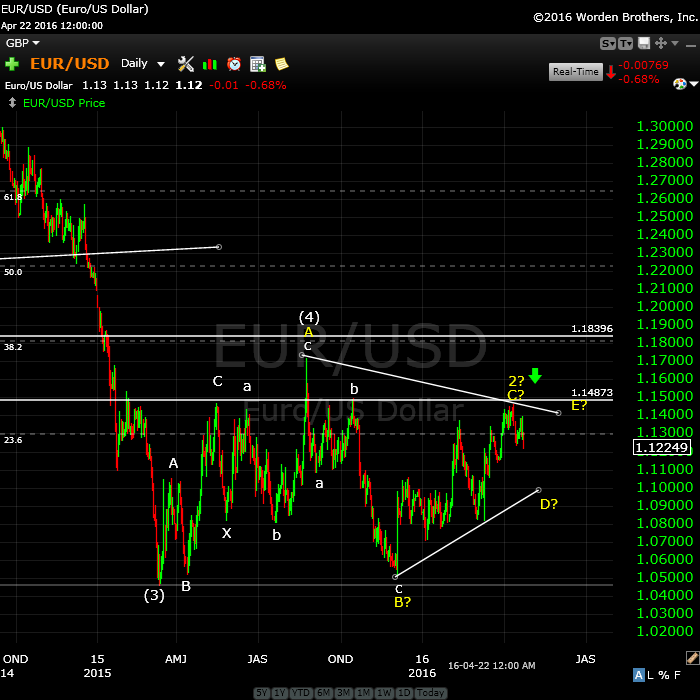
A Major Inflection Point: Here’s the daily chart of EURUSD showing the major corrective pattern from the low of March, 2104. I now don’t think we’ll rise to the previous 4th wave level, but most likely turn at a retest of the most recent high. We will either end up with a 2nd wave (yellow 2) or the C leg of a triangle (which would still need a yellow D and E leg before it’s complete).
In the case of a D and E leg, they would like form as the US equities complete the first and second waves of the third down.
The eventual turn (at any level) should send up down into a very large 5th wave. It should turn in tandem with the US equities.
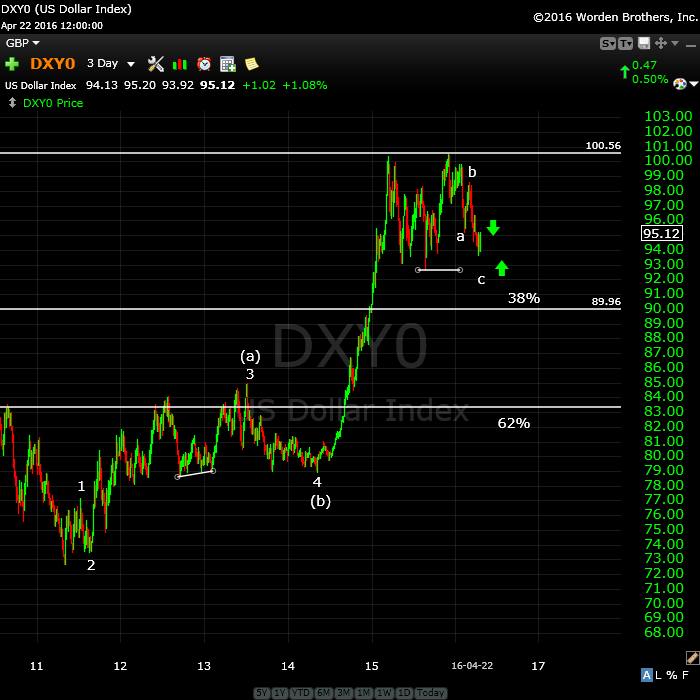
The US dollar (this is a 3 day chart) should do the same thing but in the opposite direction (up). I’m up in the air right now about the structure of this wave. Although in 5 waves, it looks more corrective to me than motive.
Short term, however, we’re heading up (after a pending double bottom).
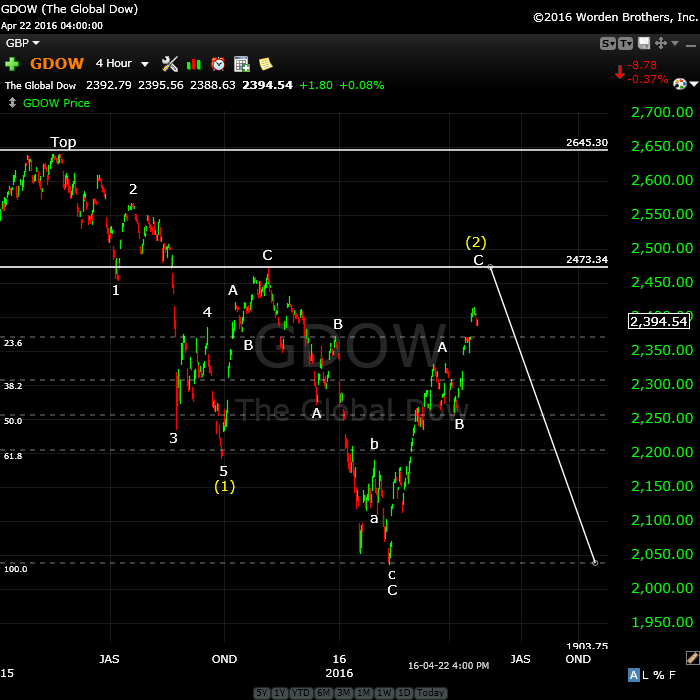
Above is the 4 hour chart of GDOW (Global DOW) showing the current count. We’re tracing out a second wave after an ABC lower part of the wave. We have one more small leg up. It will likely retrace to the wave (2) level at about 2473.
Major international indices like the GDOW and NYSE are where I do for the overall count. I can be much more committed (as I was on the SP500 first wave down, while everyone was questioning it) when I see a count on these two indices which is clear.
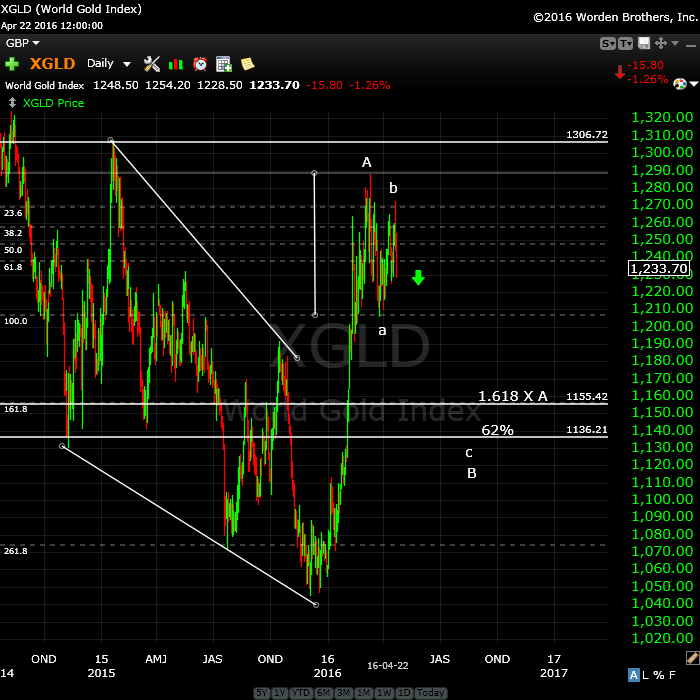
Above is the daily chart of XGLD (gold). The movement of this asset is a no brainer. I called the ending diagonal at the bottom and turn up. I said it would head up in 5 waves to the previous 4th (around 1300). I also forecast a turn down in 3 waves. Now we’ve finished the a and b waves and will head down to the 1150 area.
There are two possible targets. The lower one is the 62% retracement (in this case, the c wave will be 1.618 X the length of the a wave). It could also come down just to the 1.618 extension of the A wave (the higher horizonal line at 1155.42). From there we’ll head up in a C wave to somewhere around 1600 before heading back down again to around 750 (months away).
________________________
First Wave Down – What to Watch For
This weekend we’re dangerously close to a top of a second wave (in the fifth of the fifth, with an ending diagonal pattern).
What we’re looking for to confirm a turn is a motive wave down in 5 waves.
Because we have an ending diagonal, the first wave will likely drop to the previous fourth, which is also the beginning of the ending diagonal pattern (~2022). After that, we should get a second wave that will retrace in 3 waves about 62%. That’s the preferred EW entry point. So don’t feel you have to rush in. There’ll be a much better opportunity at the second wave level than at the top and the risk is substantially reduced.
__________________________
History: The 1929 crash
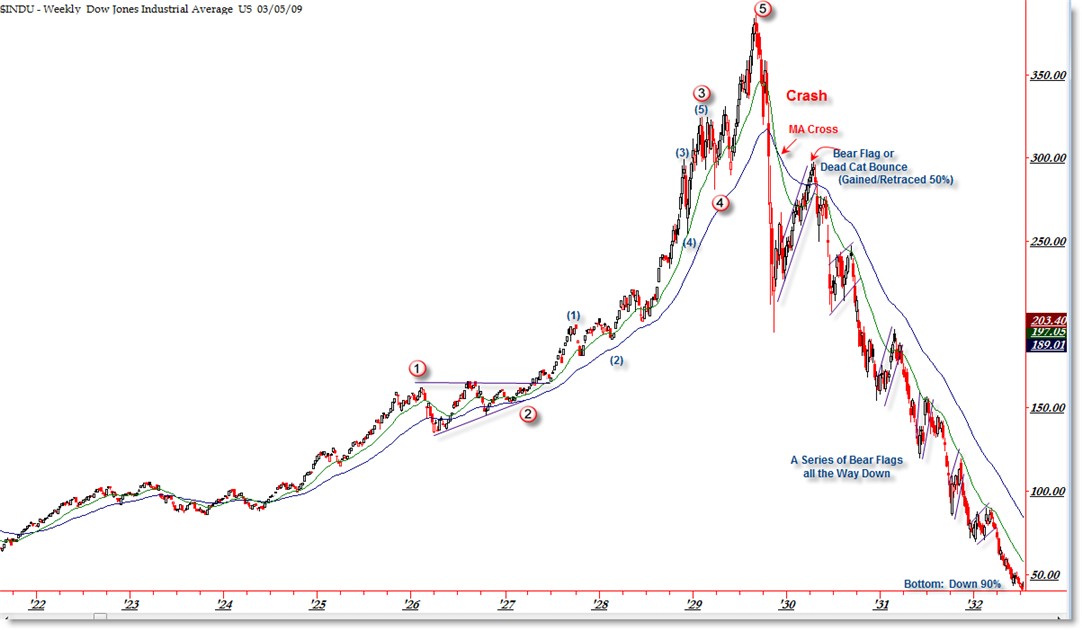
I think it’s important to look at 1929 and the wave structure (above and below), which was the same as 2007—to a point. I will show the 2007 crash below in the “What If” section.
The wave structure of the 1929 crash was in 3 waves overall. There were 5 waves down from the top (the A wave) and then a very large B wave retrace. The final C wave down was a stair-step affair and lasted over 2 years.
Let’s look a little close at the timing of the 1929 crash because the similarities to today are uncanny.
The market peaked on September 3, 1929 and then it took 2 months for the crash to actually happen (to reach the bottom of wave 5 of the A wave). The larger crash which we always hear about began on October 23, 1929. Then there was that large B wave, which lasted 5 and a half months and finally (which I explain a little further in the cycles section below), the C wave which went on for more than 2 years. This might be the scenario we’re looking at going forward.


Hi Peter,
Thanks for your detailed summary of EW approach to market analysis on many of the major investing instruments. While I am short at moment into Fed meeting, and will continue to short based upon PALS short term indicators, my thesis is that market is in the early stages of a year financial mania that won’t rest until the end of 2017. This is based upon Sat in Sag, but also on Jeff Hirsch’s Super Boom prediction which suggest we are at beginning of decade long rise in equity prices due to technology curve (once fax machines and computers, this time robots, AI, materials science, and new energy). We may get one last sell off, but I am guessing this sell off will be met by tremendous buying. Commodity rally size in last two months may be a sign of what is to come.
Well,Valley,
Good luck with that. GDOW tells me it’s impossible from a technical perspective and I can find nothing from an underlying fundamentals perspective to support it. I don’t know where the volume or breadth would come from and daily sentiment would have to completely turn around to single digits.
There’s a sound issue with the first minute of the video, for some reason, so I’m in the process of redoing that part of it.
great weekend report peter.
so can i offer a humble alternative to your conundrum. the point on the spx 15 min chart where you have yellow 1 and yellow 2, and white i, and white ii [white ii being lower than yellow 2] – could this all be a continuation of the previous wave 4? as you have it, that labelled 4 has a capital letter blue A/B/C – perhaps a triangle played out that should be labelled blue A/B/C/D/E, where blue D replaces white i, and blue E which falls short of blue wave C [a trait of E waves] where white ii is labelled…..
[cough]
that would push yellow 1 [in 3 waves] up to where you have labelled white iii. yellow 2 would be relocated where you have white iv. yellow 3 [in 3 waves] stays where you have it labelled, and yellow 4 stays the same. yellow 4 therefore overlaps the newly labelled yellow 1, with only yellow 5 to come in 3 waves. yellow 5 will therefore be the shortest wave….
ok. cough…… sniffle…..
In that case, you would have defined a new pattern, because it’s neither a triangle nor an ending wave and those are your only two options.
:-)) lol well i said “humble” alternative…
But you’re thinking about the count and looks for alternatives and that’s a good thing! 🙂
Peter, i was with you when you picked the ATH back last year, I remember it well.
I close my eyes, hold my breath, grit my teeth, as i understand so well what this means.
Many changes, great pain, my house is in order..hope all of you are!…Nick
god bless…..n
Yup, Nick, I remember it, too. I was waiting a long time for that top. 🙂
In traditional market cycle analysis, the commodity sector bottoms before an economic expansion and then leads into the expansion as price rises from an oversold condition. Recent rise in mining stocks (FCX) and metal fabrication stocks (X) could be a canary in the coal mine for the bearish scenario or it could be a bull trap. Based upon my Sat in Sag data (20s rally, 50s rally, 80s rally) all during Sat in Sag, and a Camelot redux with Hillary in the White House I am holding open the possibility of a bull market driven by increasing earnings (are current earnings understated?) and decreasing costs delivered by new technology and increased automation. Domo Arigato Mr. Roboto.
OK then. Good luck.
I’m with Peter. The sunspot forecast is down as is the longer term lunar cycle.
8 months – a trine- from 8/24/15 gives 4/23/16. In Gann theory this is a major date.
One Uranus cycle from the 1932 low brings us to mid july. 8 months from the 11/3 high brings us to 7/3/16. This is also a major bradley date.
4/25 is – in my system – more significant than 4/28. 4/30 is also a strong date.
My guess is a high on Monday, then down into 4/28. Then a typical denial rally into 4/30 before we will start the dive into early july. This would be consistent with the Fed saying there won’t be a rate hike this year due to economical uncertainties.
7/7 is a major vibratory date as it is a natural squaring out. That’s why 7/7/15 gave the inversion to the 7/20 top.
A low early july would only be natural.
End of the week Mercury turns retro, this should increase volatility.
Andre
Agree that a market down turn would give Fed reason not to raise rates this year.
First ‘natural’ turn 5/3. So abc down into 5/3 and then up into 5/10-11.
Sold 1/2 my gold stocks last week. Too many french curves up. Weekly RSI’s now showing topping action. Hope to buy back after the C wave down. Acct up over 100 percent since jan low.
3 wave- “wonders to behold!”
Peter- 1929 took about 60 days to make the first move down, around 45% or so, I think- What would be shot at time to make the 1405? I’m in the Florida Panhandle, this must be exactly what the fall of 1929 felt like.
tjames,
I’ve tried to predict the bottom before, but it’s really just a guess at this point. The first wave took 3 months to unfold, the second wave took 7 months and a bit. This should be a shear drop, but I’d be only guessing. Let’s say 6 months for waves 3,4,5. I’ll let others chime in, but we should do this in the forum, where it will last and be accessible longer than this post.
Then we’ll have a long larger B wave likely, which could last a year. I think the bottom is somewhere around 2020. We have an unbelievable amount of debt to work through, of course.
Peter,
The time price vector is a simple calculation that give a weighted average of the time and price move.
When I do this calculation on the 2007-2011 cycle, I get 3/5/20. Doing the same on the 2011-2015 cycle I get 1/9/20.
Doing this with the 2000-2009 cycle -using weeks for time – I get 11/4/19.
So 3 calculations with a range of 4 months. Very objective calculations.
Maybe helpfull.
André
Very, thanks. 🙂
I’m going to add this to the forum. I created a post on “Predicting the bottom”
Price projections this week:
Monday: open 2075, rise to 2085, close 2075
Tuesday: open 2080, fall to 2070, close 2080
Wednesday: open 2085, rise to 2095, close 2090
Thursday: open 2080, rise to 2100, close 2100
Friday: open 2100, fall to 2080, close 2085
Will keep size modest this week, as tug of war between Fed week and positive Lunars and seasonals meets the possibility of a cyclical sell off.
Futures selling Sunday evening, looks like 2075 Monday open is accurate.
So far so good, according to this weeks price projection Thursday mid morning drop in price to 2080 should be bought and held overnight and sold Friday at 11AM at 2100.
Well, that certainly fits my scenario. All engines dead ahead!
Hi Peter…great insight stumbled upon you about 2 months ago..i follow martin armstrong as well..his cycle work from my understanding isnt calling for a crash..i woder about your thoughts on this..great work by you!
Frank,
I attempt to stay away from the work of others to keep my work as objective as possible, and so I have no opinion.
oops….fogot to ask u about your long term view on the yen..has it bottomed against the dollar…THANKS again peter
MEANT TO SAY HAS THE YEN TOPPED AGAINST THE DOLLAR…
I don’t follow the yen to any great degree. However, it looks to be in a corrective wave.
Peter,
How far down would the s and p cash index have to drop to to discard the current count of a new high around 2116 which by the way your triangle in the es is looking pretty good right now- but just in case? thanks
The first point at which you know you’re wrong is if it drops through the bottom of the triangle. After that, first waves almost always revert to the previous fourth wave, which would be about 2020.
Could it be it has already started ??…n
No, Nick. You’ll know when the third wave has started, believe me. We still have to top.
NQ had not bottomed properly and SPX looks like 3 up, etc. etc.
morning all,
ok, your discussion this morning of “time” and “timing” of waves 3 to 5 is “EXACTLY” what i was dreaming about last night.
we have had just over approximately a 2.168 fib time sequence to retrace the drop in wave 1. So wave 2 [approx] has “extended” by 2.618 in terms of “time” as compared to 1. such time was probably necessary to bring back the “sentiment” level.
this would indicate to me that waves 3,4, 5 will be “equal” to 1 in terms of “time”. So if we work by the “weekly” time frame {this week being week of 4/29}, then 12 weeks from this weekly time is the weekly candle of 7/22.
i think we bottom somewhere in “price” between the 2010 low and 2011 low, as there is a great deal of volume supporting price between those levels.
yikes, i just saw peter put up a forum for this point….. i will go there too…
rich, in your work, if we are looking at 12 weeks to complete 3,4,and 5. how much time to complete wave 3 only? thanks
t,
good question……. that i am unable to answer. this is all an exercise in speculation. there is no sure way of using ‘time” factor by itself. “Elliott said that the time factor often conforms to the pattern” p.147 ew principals. . . so i am unsure. what do you think?
I added an update to the ES chart at the top of the post. As expected, this is not a vibrant market.
peter,
from the market action today, it seems reasonable to suggest that we “hit” the 2116 target through “algo” driven price “spikes” at the time of the release of the FOMC statement on Wed.??
Rich,
That would be my guess.
call it deer in the head lights and the #fed #freeze. market frozen and can’t move until fed does. nothing else matters anymore, til it does
$spy volume 12/24/15 48mm 12/28 65mm 12/29 55mm 12/30 63mm
today 4.25.16 56mm must have been some bad food at passover:(
haha.
I updated the ES chart to end of day at the top of the post.
Peter, is it possible for spx to come down to 2022 and then to 2156, lot of people suggesting that.
Rose,
I’m seeing all kinds of strange suggestions around …
EW is all about probabilities.
This wave up from Feb 11 is in 3 waves (an ABC wave). It’s corrective. As such, it can’t go to a new all time high. The C wave will be 1.618 X the A wave at 2116. That’s the most typical ending point.
What you’re asking about would be a fourth wave, or d wave, which a C wave doesn’t have.
So, while it’s possible to have another wave do what you’re suggesting, I can’t imagine what the count would be. You would also have to allow for it in all the other indices. For example, IWM has an already complete ending diagonal, so it’s all but done.
In any event, we’d need to finish the C wave first.
Peter, thanx although anything is possible, but everything looks divergent in indicators, may be at the top people are suggesting 2400, 2280 etc
I updated the ES chart at the top of the post. Not much to report. We’ve moved beyond the triangle be the looks of it and are progressing slowly.
Just before I leave, I keep noticing that the NQ side of the futures is lagging quite a bit. I’ve mentioned before that it may already have topped. The Nasdaq is down in three, though, so not sure how this will resolve itself.
This is the fourth wave for the SP500. A quick measurement suggests the fifth wave will only make 2104. It could extend, of course, based on a Yellen euphoria, but it will likely be short-lived. I’ll take a closer look at this later in the day.
peter, are you saying the potential for a “truncation”?? :-))
Nope. Looking as the SP500, I see the “fourth wave” has come down into the area of the first wave, so this wave will likely go up in 3 (an ending diagonal, no doubt). And measuring the A wave, I see that the distance from the bottom of the B wave to the top of the C wave (to come) is exactly 1.618. That would take us to 2012. I would bet it extends the last 4 points with whatever Yellen comes up with. 🙂
Grrr………i posit that FOMC shenanigans have “nothing” to do with elliott wave. Day before/and day of fomc, we get “consolidation”. Then at 2 pm on FOMC day – Bang – algos first strike to take the market down – clearing out all sell orders/stops, – then “reverse” and “spike” high – all to show the never ending “omnipotence” of the FED. that is called banker manipulation.
I am thinking the same thing Rich. Could still be counted as wave E of the triangle posted at the top?
i say we dawn some black ski masks, and go and “take out” the fed, and rough up “janet” a bit. that will “teach” her to mess up our EW count!!! yeah aaron, could be part of E…..we shall see what FOMC day will bring.
Correct in that the FOMC has nothing to with EW. Events, though, often coincide with tops and as a result of extreme mood swings. As a result, it’s interesting to me the timing of this meeting, the day before a cycle turn date.
I updated the ES chart one more time, showing the possible target for the final wave.
p,
i am still “secretly” hoping for a “truncation”. it is so rare, it would be akin to being one of the very few people to witness the “hindenburg” landing – live……… ..
jeez rich,
potentially the start of the biggest crash in history that will be talked about the decades and decades … and you want a truncation, too? lol
Anyway, there’s the start of the C wave …
too much for one lifetime huh?? :-)) although, i was one of the “few” who was there on 9/11 . my office was 315 church street [part of ground zero area]. the wtc was in the 100 blocks of church street. i had just arrived at work an saw the first plane go into tower 2…..grrr….. anyway, that day will always stay be apart of me. so i guess i will be ok with no truncation….
That’s quite the story! And it happened on the highest spike of the 2001 solar maximum. Cycles and their effects on humans …
I heard the report on the news of the first tower being hit as I drove into my parking lot that morning and ended up watching the rest live all day long.
End of the day … there goes Apple … and that takes NQ to a new low. I can now count a set of three motive waves down for NQ (that measure correctly). I would now expect it to rally 38% for a fourth wave and then down in a fifth wave.
That would give us a motive wave down and a really good start.
Now I can count and measure a full 5 waves down in NQ. Wave 5 could use a little more depth. So that will likely let NQ retrace 62% now as ES goes to a new high. We’ll see what happens.
PALS SPX Update:
Phase: positive next two weeks
Distance: positive next 10 days
Declination: bottoms tomorrow, positive next two weeks (minus equatorial crossing)
Seasonals: positive next two weeks (not much tho as early May is never too exciting)
Planets: approaching Saturn opposition could add some volatility
Summary: PALS (Planetary Adjusted Lunar Seasonals) suggest upward prices next two weeks. The only exception is a secondary cycle that I use suggesting price weakness until mid May. So it is basically slightly bullish next two weeks. Am long with small size into open on Wednesday and will play it into Fed announcement. Am going to short after Fed announcement with small size due to mixed PALS, mostly based on guessing; pre summer sell offs don’t happen too often so unless the Fed has surprise believe post announcement sell off if it occurs to be limited to 2 or 3 %.
I just added the chart of NQ showing the first motive wave down.
Have learned a lot from Worldcyclesinstitute and you Peter Temple. Elliot wave is a new area for me and am starting to understand it more thanks to you.
Hi Valley,
Good! But I realize this is about the worst environment to learn how to use it properly. There are lots of intricacies I can’t hope to cover in a comments section, and so I’m working on a video-based online course (with supporting text), which I hope to have live within the next couple of weeks.
When I first got interested in EW, I was looking for a reason traditional patterns repeated themselves over and over again. I thought there must be more to this, a reason for the persistent patterns and why the market moved the way it did. EW fulfilled that need.
For the first year or so, I was highly skeptical—until I’d watched enough markets and realized that there really was something to this. However, the group I followed (not to mention any names!) continually made mistakes by not measuring waves, mislabelling waves, and not being precise enough in their analysis. Plus, they continually provided an alternate count (which to a trader, may as well say, “We’re going up or down”—it’s of little use). There are far too many “analysts” out there giving Elliott a really bad name. Attention to detail is the key. I strive to provide an accurate count with reasoning, using supporting indices to confirm the count (very important).
For someone like you who is very detail-oriented, it seems to me that this is something that over time, would add greatly to your present system. Let me stress, though, that like any other tool in trading, it requires quite a bit of study to feel really comfortable with it. It’s taken me literally 10K hours watching and using it to get to that level (I’ve spent over twice that amount I think at this time).
So, I understand the skepticism out there, because I’ve been in the same place, but I can’t find anything else out there that provides as accurate a prediction of asset price going forward. It’s not perfect, and it depends on the user.
I would take great pleasure in getting others to see the value in a tool that I’ve been very successful with, and be able to eventually use it themselves to greatly increase their trading confidence and win percentages.
What I like about Worldcyclesinstitute and Peter Temple is the attention to detail and clarity of communication of elliot wave technical analysis that is reapplied in real time so many repetitions allow faster comprehension of the technique.
Thank, Valley, for the link words and clarification as to what’s working for you. Helps to make sure I do more of that, if time allows.
First motive wave down? So Peter, there is no chance for bulls to dance to the tune of Taylor Swift’s “Shake It off”and call this a minor correction?
Highs so far since Jan & Feb lows:
4/19/16 – NQ, QQQ
4/20 – DIA, YM, ES, SPX, IYT
4/21 – GDOW
4/22 – IBB
4/26 – XLE, XLF, IWM, TF
LizH,
Only the NDX related indices are showing a first wave down. They’ll need to retrace in a second wave while the SPX related indices reach for a new high. A fractured market. Bearish overall indeed.
I’ve updated the ES chart as at 10PM EST above to reflect what happened after hours and the projection for the NQ related indices, as a result.
I put us still in the fourth wave triangle, but completing the e wave down tonight.
I added a short blurb at the top of the post. We went sideways overnight, so I really have nothing to add until the market tells us what the next move is. We may not do anything until we hear from Yellen.
Both Thursday and Friday fall under the umbrella of the major cycle turn date, so we have a 48 hour window ahead of us.
ES has just finished forming what looks like a bullish triangle on the 5 minute so I’ll try to get that mounted as soon as I can.
I just added the 15 minute ES chart at the top of the post, showing a bullish looking triangle.
Of course, now we’re breaking down in futures … finally. At least that’s what it’s beginning to look like.
Fake-outs this morning. So we do have a bullish triangle in ES, by the looks of it.
http://www.zerohedge.com/sites/default/files/images/user5/imageroot/2016/04/20/VIX%20futs%20shares.jpg
peter, at the url above is from zerohedge – an image of the outstanding shares of VXX . if an elliott wave count was done on the outstanding shares, i would say we have an expanding ending diagonal 5 of 5?? which would indicate a “collapse” of vxx shares outstanding – thus supporting the “top of the third”. would you agree with that “rough” ewi count??
Rich,
I would prefer to label it a double pronged 2nd wave heading up into a third wave. You may simply have a first wave in 5 leading up to it.
thanks peter. ok, we will see how it plays out – i will stick with the expanding ending diagonal only because it supports the “top of the third” count for the indexes….
Rich, what does it mean collapse of vxx outstanding shares
rose,
it would mean “selling” of the VXX ETF…that would imply a surge in the VIX [risk] as a result. a surging vix usually implies volatile prices to the downside….
that is what to expect on a “market crash” is a surging vix….
thanks Rich
Ah … the NQ/NDX?Nasdaq are breaking down into the fifth wave, while the ES side waits to try to go up to a new high. Very strange, broken market.
Once they get to the bottom, they should turn up into a second wave, which will support SPX to a new high (all heading in the same direction—what a concept!)
p,
that second A/B/C wave will take more than a few days AND we have a “potential” turn date tomorrow/friday……diverging price actions – which may keep things interesting for longer…?
Rich-
The target on the SPX is only a 1.5% at most move from current prices (10:30 eastern a.m.). I have had to keep reminding myself that because of the range we have been in for the last week. Past fed meetings (and Thursday’s after) have typically produced some pretty volatile moves/days (look to december and September meetings)
ted,
i absolutely agree with you. we will hit peters target of 2116 with those volatile moves…it is all rehearsed….at 2 pm today – first a drop to clear out sell orders and stop, then a reversal and spike in prices to a new high, then a reversal back down…..yes fomc day is depressing in real price discovery, except the manipulation is hilarious to watch…
last squiggles to finish 5 up happening now? i see a final (i) done, and (ii) in process , FOMC is only 20 min away, with a final (iii),(iv) and (v)? yes/no?
If this is to me, I have no idea what asset you’re talking about. If it’s SPX, we’re starting the C wave. At 1.618 X the A wave, it measures to 2114.
lol – sorry peter, yes i was talking about the spx, and the i of c of 5 of C of 2 [done], with ii of c of 5 of C of 2 in progress…. it was better than typing a comment “are we there yet? are we there yet?”” :-))
Either we spike up until about 3 pm then fall ala 9/17/15 or Peter’s SPX buy momentum extends until close today to tomorrow. Just a guess.
Tomorrow/Friday is the turn date. Doesn’t look like this is going to do much, so we have to climb to the top, I guess. Had more of an effect on currencies.
wait for the short cover squeeze to clear overhead stops
I think we get at least half there or about SPX ~2100 by the close today.
Measurement target for wave c of ES is 2109
I think AUD, CAD, and EUR on the US pairs have topped/bottomed. They’re in a new trend. AUD is easy to see a full wave down and beginning a 62% wave 2 retrace.
ted, well the BoJ has its announcement tonight – so that could be the match for us to ignite to a high above 2111 – or we might just [dare i say it] “truncate” :-))
the price action of the spx = price exhaustion…..
In ES, I have a target for this 3rd wave of C of 2102.50 before a 4th wave retrace to 38% and then the 5th wave measures exactly to 2108 and change.
It’s all looking pretty good. Futures should get the fourth and fifth of the third done tonight. Tomorrow morning perhaps the fourth … Don’t know if we’ll get finished tomorrow. Perhaps Friday morning we’ll see the turnover. Friday’s are usually good for that 🙂
Looking ahead to the first wave down—they always go to the previous 4th wave of one lessor degree. For SPX, that would be about 2020. So it will be almost 100 points.
excellent work peter – thank you. i prefer those targets to the downside.
Peter-
Can the first waves surpass (and how probably is surpassing the wave 4) When trying to work backward from the SPX 1405 3rd wave target, it points to wave 3 and wave 5 needing to be around the 4.236 fib ratio of wave 1. Wave 3 of wave 3 certainly makes sense for that, so i did not think it was out of the question.
In short a 100 point wave 1 seems a little small for the likely wave 3 target. Wasn’t sure if this was more of a guideline vs a hard rule.
Ted,
That’s wave one of the first of the third. The first set of waves will have five waves, then there’ll be a larger degree second wave retrace. Then we’ll get into the middle of the third (another 5 waves). And then a fourth of the third, and finally a fifth of the third (another five waves). Then you’ll have a larger degree fourth and finally a fifth with three sets of five within it.
So there are lots of waves within waves to work through.
Peter-
Thanks for input, i am going to put a little bit more detail into my question and in the forum so i do not clog up the comments
I put a diagram in the forum to get you started: https://worldcyclesinstitute.com/forum/us-equities-and-futures/wave-3-projection-and-subwaves/#p55
Perfect, i was a fractal degree off from you with my question.
Long spy call exp. 4/29 $209.
Will add to call on Thursday if price reaches 2080 on ES.
Will sell call on Friday at 1PM or if 2100 reached.
Monday at open will buy put if 2100 is sustained.
Peter
If ES price would reach the ALL TIME HIGH of MAY 2015 but with out exceeding it , would that still count as a valid WAVE 2 ?
AZ
No. However, if it was one tick below it, nothing would change.
Thank You
I’ve replaced the ES chart tonight at the top of the post after the large B wave drop and show that the target has not changed.
hi peter i think this is the wave 3 of 3 the big one .if yen goes to 100 soon this will be it .from 2013 usdyen carry trade will break.year of of shemitah making more sense
lot of carry trades can break .i see C wave up in dow and snp .and there is a big chance crude breaks down now and euro too ..the triangle is crude has shown the hand for the last 2 years abcde and i see 0.64 .
MAy will be the year coz may 2015 we topped and as ur date said 27 april .asia sells on 28 here …thnx love ur work
ronit,
Thanks for the kind words. Well, that’s what I’ve been saying. But it’s wave 3 overall. 3 of three will hit after the first set of five waves down of 3. I posted a diagram in the forum.
Peter, I see the futures are down heavy this morning. Is it possible that third wave is beginning now?
scott,
my thoughts exactly. either we are still consolidating in some kind of 4th wave [still], which would mean that the “turn date” was incorrect, or we ‘truncated’ and we have begun the 3rd wave on the ‘turn date’ [as japan was the next day when the BofJ came out with ‘no change’]
Not so far. I just posted a brief comment.
A brief comment on the action. I’ll post a chart perhaps once we see a bottom, which I think will be after the bell in ES.
Peter–It seems that the cycle turn dates are problematic at best? If your EW count is correct, another major cycle failure? Central bankers, you got to love them. Gary (Denver)
ES only has 30 points to go. That’s not very far.
SPX has the same thing and it’s just a C wave if it doesn’t head any lower. All doable in a day and a night. We’ll see what happens.
Looking at futures now, we might just keep going up …
On second thought, these waves up look like 3’s, so we will likely get a drop to confirm a bottom and then start racing up to the top again … my guess.
Cycle turn is today/tomorrow, so I wouldn’t be at all surprised to see the turn tomorrow morning still …
I added an ES chart at the top of the post.
And now it looks like we will indeed just head up. It knows it’s late, so it will be motivated … haha. Seen this one before…. 🙂
Everybody wants to buy today, so they can sell in May. 🙂
It’s “close your eyes and buy” market
This was exactly what happened at the to of the Nasdaq in July of lsat year. Shot up and turned on a dime.
SQQQ CALLS ARE CHEEEEEAP!
ES only has about 18 points left to go. It only has to get to the previous high now. NDX related indices only have to get to the 62% retrace level.
Think this whole final wave for SPX can drag out now till middle next week; Sun hits Saturn Wednesday next week at a 150 degree completion angle.
This website is for educational purposes relating to Elliott Wave and natural cycles. I welcome questions or input about Elliott Wave, cycles analysis, or astrological input relating to any market. Due to a heavy schedule, I may not have the time to answer questions that relate to my area of expertise.
I reserve the right to remove any comment that is deemed negative, disparages the Elliott Wave Principle, is otherwise not helpful to blog members, or is off-topic. Posting trade specifics does NOT serve an educational purpose, is stongly discouraged, and such comments may be removed.
Want to comment? You need to be logged in to comment. You can register here.