December 29, 2013
 Offline
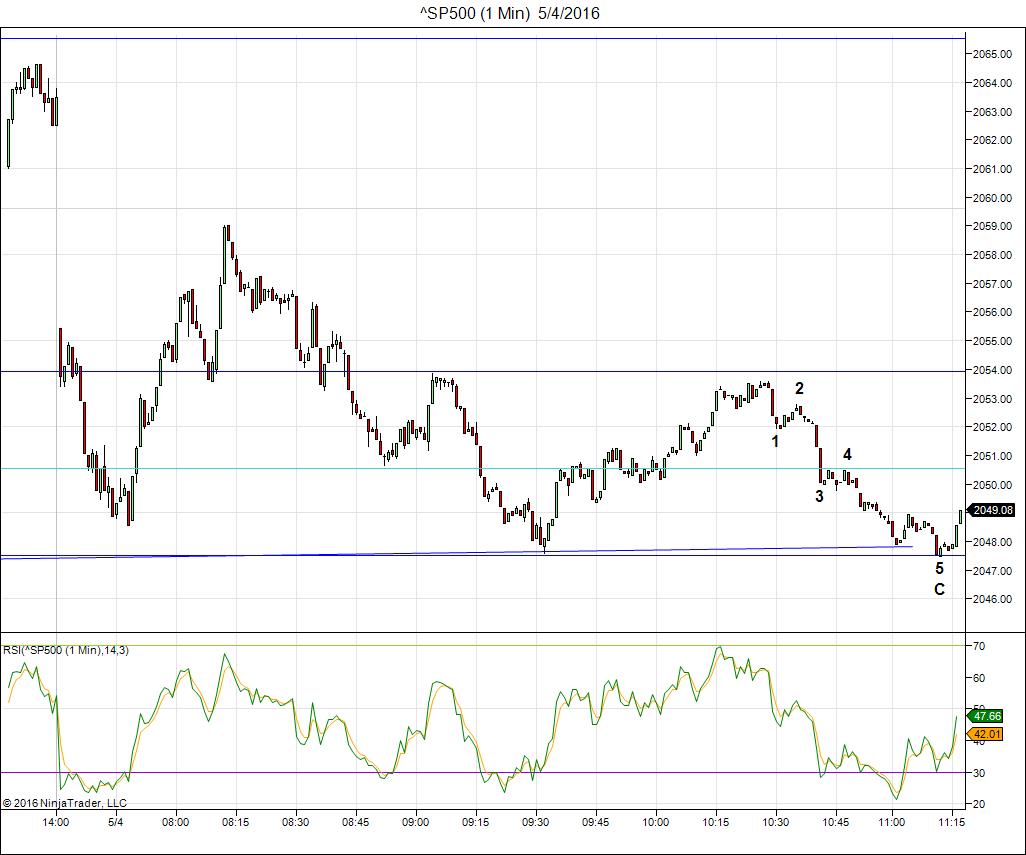
We just completed an ending wave in the SP500. You have to dive down to the one minute chart to see it. These are in 5 waves and come down usually to a double bottom. The same thing happens in reverse at a high. You will find the ending wave should appear motive and measure out more or less correctly (wave 3 = 1.6 X wave 1, wave 5 = 1.6 X wave 1).
December 29, 2013
 Offline
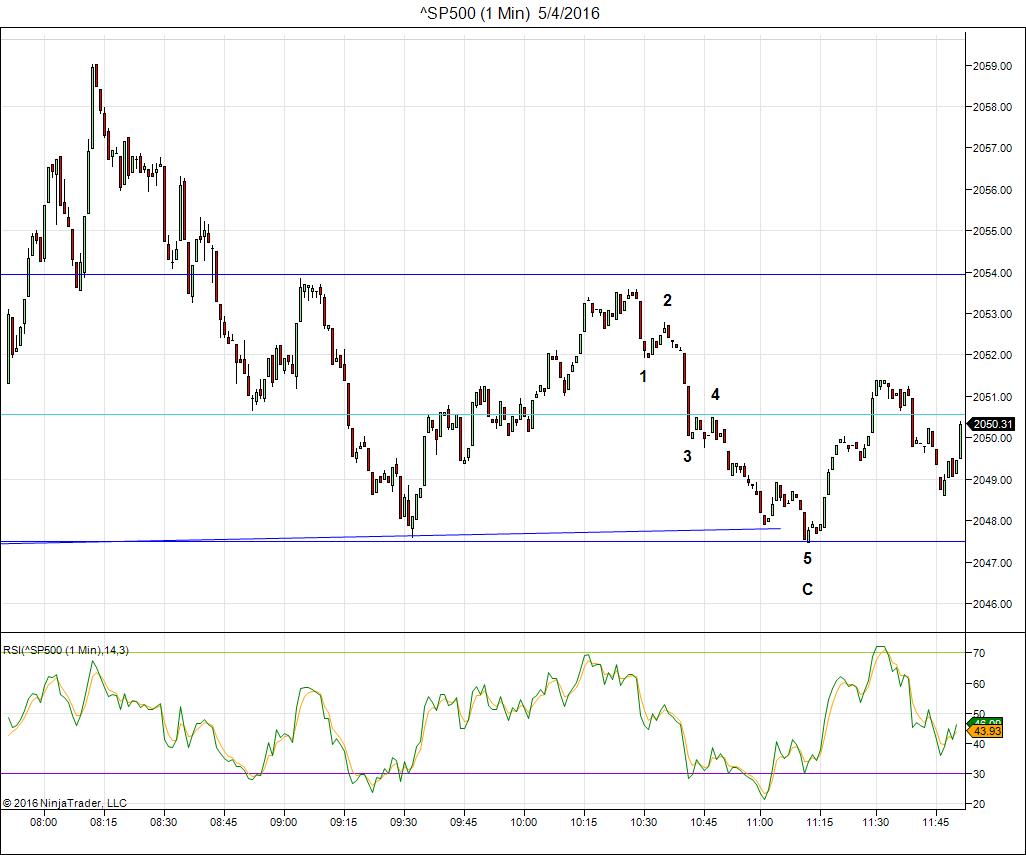
Following along, the next step in the trend change is for 5 waves up (the first wave in the new direction) and then a second wave that retraces 62% of the length of the first wave up. You want to enter this new trend at the bottom of that second wave. This pattern happens over and over again in the market at major tops and bottoms.
Now, that’s the normal progression. Now, as I look again. we’ve come down to another double bottom, which is likely due to the fact that the previous low (as I notice now, was not an exact double bottom – looks to be off by a tick or two) and it should be exact. So we’re looking for 5 waves up from here and a second wave down.
We’re on 1 minute charts, which is not the most accurate place to “pick off a trade like this” but I’ll leave it up here as otherwise it looks perfect and I would take this trade on a higher degree (5-10 minute chart).
Most Users Ever Online: 75
Currently Online:
9 Guest(s)
Currently Browsing this Page:
1 Guest(s)
Top Posters:
houseflii: 19
Platy: 14
tedward728: 4
ricardo geyer: 2
Tamon Yamaguchi: 2
Newest Members:
Kandan Kumar
Stan Greville
Michelle Hay
Gudiyatham Padi
Rick Oliver
Forum Stats:
Groups: 5
Forums: 24
Topics: 106
Posts: 179
Member Stats:
Guest Posters: 1
Members: 1380
Moderators: 2
Admins: 1
Administrators: Peter Temple
Moderators: Whazzup, Chris Pearson

 Log In
 Home
Home


