December 29, 2013
 Offline
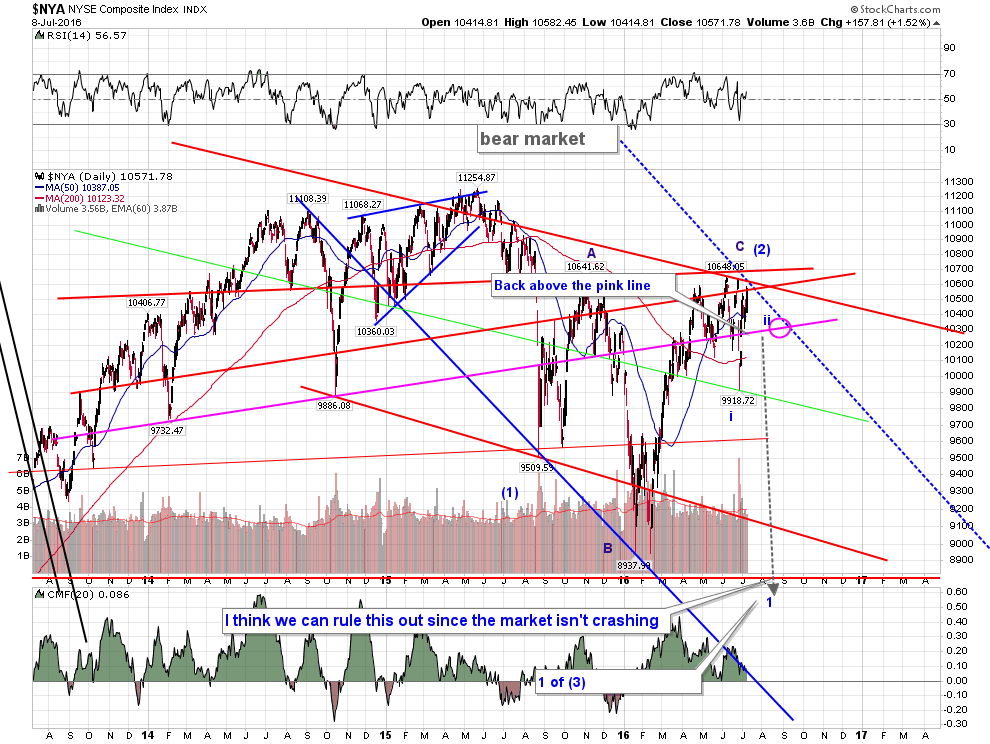
Yes, but an expanding diagonal should be on a diagonal. This is not. It’s horizontal, so therefore, it has to be an expanding triangle. That was my first take, too, before thinking about the angle.
It also has to have a 4th wave before it (and below it), so that’s another strike against a diagonal, because an ending diagonal is a fifth wave. A triangle is a fourth wave.
But nice looking chart!
April 1, 2016
 Offline
peter,
i have never heard of this “rule” of an expanding diagonal that it must travel on a “diagonal”?? where does that come from?
diagonal rules i am aware of :
must appear in a wave 5 or wave C of a zigzag or flat.
waves 1/2/3/4/5 always subdivide into zigzags.
wave 2 never goes beyond start of 1
wawv3 allways goes beyond the end of 1
in expanding variety, wave 3 is always longer than 1, wave 4 is always longer than 2 and wave 5 is always longer than 3, and wave 5 always ends beyond the end of wave 3.
a line connecting the ends of wave 2 and 4 diverge from a line connecting the end of wave 1 and 3.
[guideline] — wave 5 usuallly ends before reaching the line that connect the ends of waves 1 and 3 in an expanding variety.
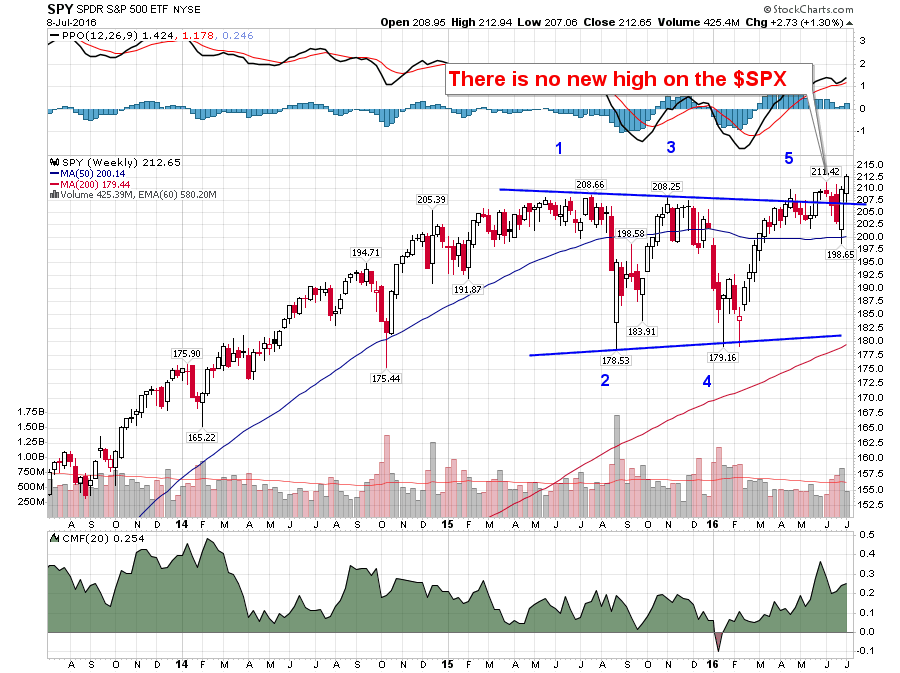
the chart i produced meets the rules and guidelines of an ending expanding diagonal.
nowhere can i find a rule this “diagonal” rule you indicated. please let me know where to find it.
thanks
December 29, 2013
 Offline
Nowhere did I say it was a “rule.” I didn’t even say it was a guideline. I pretty well know them all by heart…. 🙂
Ralph Elliott said,”Diagonal triangles are either upward or downward.” After all, it’s in the name. He also said, “There are two classes of triangles, horizontal and diagonal.”
December 29, 2013
 Offline
Here’s an addition to my point about the expanding ending diagonal. I had misplaced this quote (from Bob Prechter in “The Theorist” – his newsletter):
“To begin with, diagonal triangles are very rare. Unless the market traces out at least four waves of a diagonal , it is best to exclude it as an option. We never reached such a point. A few weeks into February, one had to abandon this count because wave three of the presumed diagonal was then longer than wave one, and R.N. Elliott never illustrated a diagonal triangle showing a third wave longer than the first. The possibly valid, tentatively proposed expanding diagonal (see text, p.37, The Elliott Wave Principle) will have a longer third wave, but, as far as I know, there is only one instance of its occurrence in the DJIA (see Figure 1-19, The Elliott Wave Principle), so the form is either non-existent or so rare that, while one may resort to it after the fact if all other wave considerations compel this labeling, to postulate one before such a time is irresponsible.”
I personally think Bob has done a disservice to Elliott by adding material to The Elliott Wave Principle that was not in Elliott’s original work and I’m starting to get more vocal about it. I will still mention ending expanding diagonals, but with a warning that nobody has ever seen one. His diagram in the book (mentioned above) is not a valid example as it wasn’t a fifth wave, and in fact appears to be part of second wave corrective wave in 1980. He apparently flagged and drew it out in real time …
I have stopped referring to Leading Diagonals, which Bob also invented, but which has no actual example and in fact, nobody has ever seen one!
I’ve been very recently going back over truncation charts he’s also printed in the book to find that neither of them is a valid truncation. So, as of recently, I don’t believe they exist, either, and will stop referring to them.
He also refers to an ending diagonal that he found in which the first and fourth wave does not intersect. Well, that’s because if you go back to the original chart (in 1976), you’ll find that all the waves are in 5. It’s not an ending diagonal, but a fifth wave.
As I’ve delved deeper and deeper into this over many, many hours of analyzing the market, I’ve found these inconsistencies in Prechter’s work, not Elliott’s. So I would offer a word of caution about taking all of the EW guidelines at face value.
Certainly expanding ending diagonals, leading diagonals, and truncations, in my experience are questionable at best.
Peter
April 1, 2016
 Offline
yes peter, thank you – i respect your words a great deal! they are honest and i think are accurate.
sometimes i find it is best to let the “pattern” form itself out – weather it “conforms” to EW precisely or otherwise.
for example, i drew the chart above already in the early stages when i had labeled blue 2 of C. the market filled out the rest of that pattern to the blue lines on its own. i was happy, and ok, it was a good chart for trading, so i keep it. it gave me a heads up as to the “direction” of brexit/bremain for example.
[most times this predictive charting fails, and i toss the chart.]
what my current chart is telling me, is that ,rather than this being a “continuation pattern” with higher prices to come, the “expanding nature” of price action indicates there is a high potential for a major “reversal” in price at current levels,[ with the pink lines being my personal “predatory hunting – stop level” lines that algos seem to respond at. all my charts have them.]
so here is the funny part, it can be argued that since the spx top at may 21st of 2015 to feb 11th of 2016, the spx has in fact crafted out a pattern very similar to that “defunct” prechter based pattern of a “leading diagonal”.
it “conforms” to his rules – zigzag, blah blah….and in fact i have one chart labelled as such. it will be the only time EVER i have labeled a 3rd wave down with an a/b/c/ 3 count rather than 5 waves. that third wave i had labeled A/B/C happend as part of the August crash of 2015. this gave me a heads up that any counter trend bounce from the feb 11th 2016 date [end of wave 5 of leading diagonal] had the very real potential to retrace almost completely prices back to 2134 level for a double top.
so my “leading diagonal” – ish chart lead me to being open to the expanding nature for C, since A was very sharply sloped and with a very high retrace, and alternatively my labelled B wave was relatively very shallow.
personally, i am open to “rare” events [in chart pattern terms] to happen now at the end of a 350ish year super cycle. if anytime in the markets to expect the “rarest” of the rare unicorns it is now – it is during this time. this is when ‘flexible’ and open to the very odd pattern in charts can serve you well.
December 29, 2013
 Offline
A triangle, of course is a continuation pattern, but it only has to “continue” to the top of the pattern itself. However, we have an E and fifth wave still to go and I’m looking for a top in September and not before. I don’t know whether the SPX will reach a new high. It would be odd because NYSE and NDX/Nasdaq won’t. It would lead to indices being out of sync and I’ve never ever seen that, even wandering through charts going back decades. But it could happen at small degree. If that happens, it wouldn’t take but a week or so to get back in sync, I don’t think.
We’re going to have to agree to disagree on rogue patterns. I’ve never seen one, nor a truncation, and don’t expect one now. This time is not different … haha.
Keep up the great work! I like seeing a determination to use Elliott waves. I’ve learned over time that they never fail. It’s me as an analyst that fails when I can’t call them correctly …
April 1, 2016
 Offline
peter,
good man – we are fortunate enough that “agreeing to disagree” is unnecessary. the markets will prove one of us correct, or both of us wrong. :-))
if the market proves my spx charts wrong, [as done by the gentlemen of old], i will take my hat off to you, and visa versa.
my spx charts are telling me that a “major” price turn is upon us [directly upcoming in 2nd week in july] having finished wave 5 of an expanding diagonal of a C of large 2nd wave.
and you see an E wave drop completing a 4th wave triangle , and then a wave 5 up, and a major turn in september. [hmm if we make a new high with this count then that implies that since feb 11th low, this wave was somehow “motive’ rather than ‘corrective’.]
so there we go. the market shall be final arbitrator, and let the “game of charts” begin! :-)) good luck!
this is so much more fun than watching mindless television!
December 29, 2013
 Offline
You don’t have to use the word “mindless,” ya know, if there is no distinction between different television offerings …. haha (just say what you think, Peter!) I used to be a writer/producer/director in commercial television and it’s just about hit rock bottom… sigh.
The wave up is definitely not motive (in any index), and it’s been my contention since May of last year that the wave down was motive, so I’m not expecting a new top and what I’m saying is that it double doesn’t make sense based on NYSE, NDX, etc.
I won’t get my report out until tomorrow, but I’ll spend some time on that and this final pattern.
btw, an ending diagonal is impossible since this is not a fifth wave. We’re still in fourth. So that’s two strikes to that pattern.
April 1, 2016
 Offline
hmmm…4th wave triangle versus 5th wave expanding diagonal. i am going to “bribe” the judges! hmm, so how ‘does’ one bribe the fed??
so i like this declination chart. notice on the feb 3rd upturn, the market made a final downthrust low 5/6 trading days later [feb 11th]. if this holds then the july 1st downturn plus 5/6 trading days takes us to the exhaustion “upthrust” from friday. we shall see if this pattern holds.
charting supremacy is on – good luck! 
they should have a charting supremacy ‘competition’ on the sporting channel considering ‘poker’ can make it to the top of the programming list –
Most Users Ever Online: 75
Currently Online:
2 Guest(s)
Currently Browsing this Page:
1 Guest(s)
Top Posters:
houseflii: 19
Platy: 14
tedward728: 4
Lon Kaufmann: 2
Tamon Yamaguchi: 2
Newest Members:
Kandan Kumar
Stan Greville
Michelle Hay
Gudiyatham Padi
Rick Oliver
Forum Stats:
Groups: 5
Forums: 24
Topics: 106
Posts: 179
Member Stats:
Guest Posters: 1
Members: 1380
Moderators: 2
Admins: 1
Administrators: Peter Temple
Moderators: Whazzup, Chris Pearson

 Log In
 Home
Home


