Update Friday, May 20, 2PM, EST
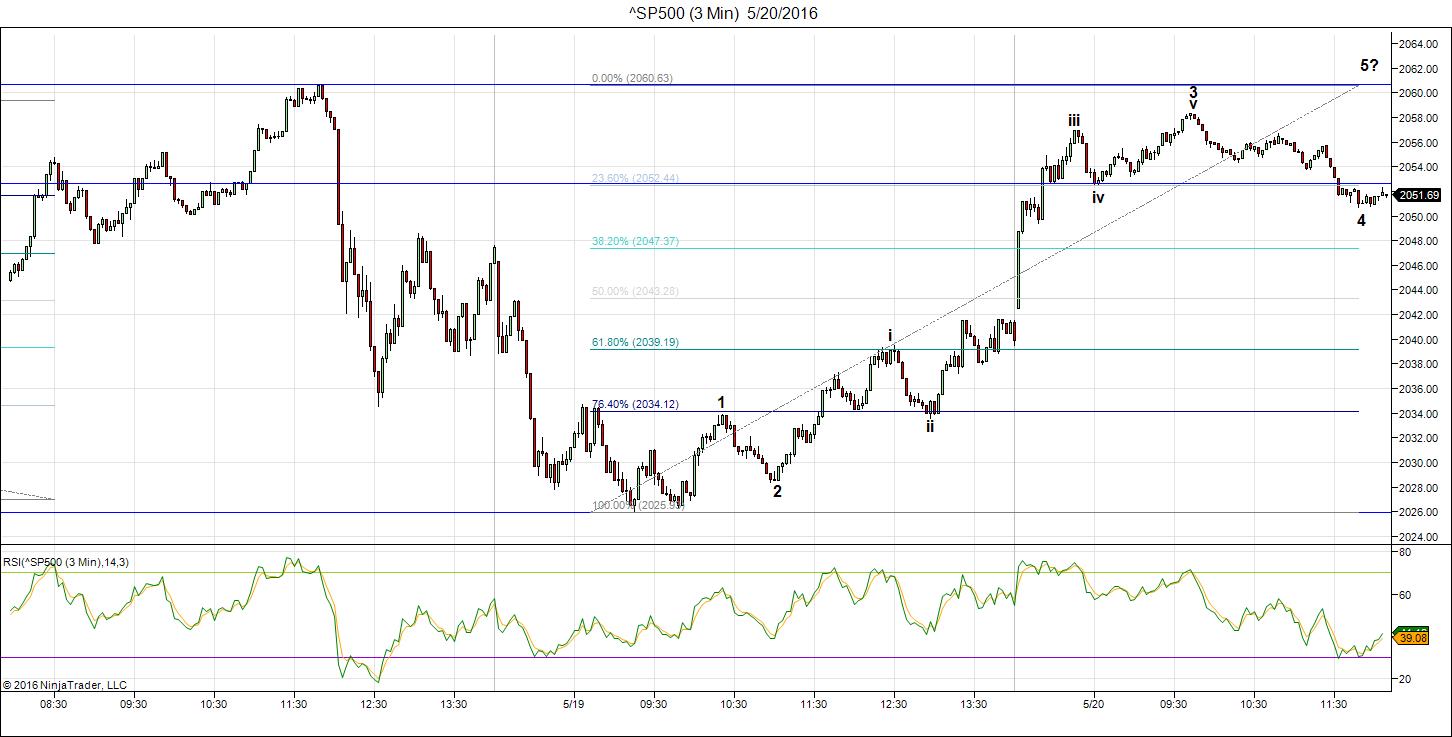
Above is the 3 minute chart of the SP500 showing my count so far. I’m still expecting a fifth wave to unfold if this count is correct.
___________________________
Update Friday, May 20, 10:30AM EST
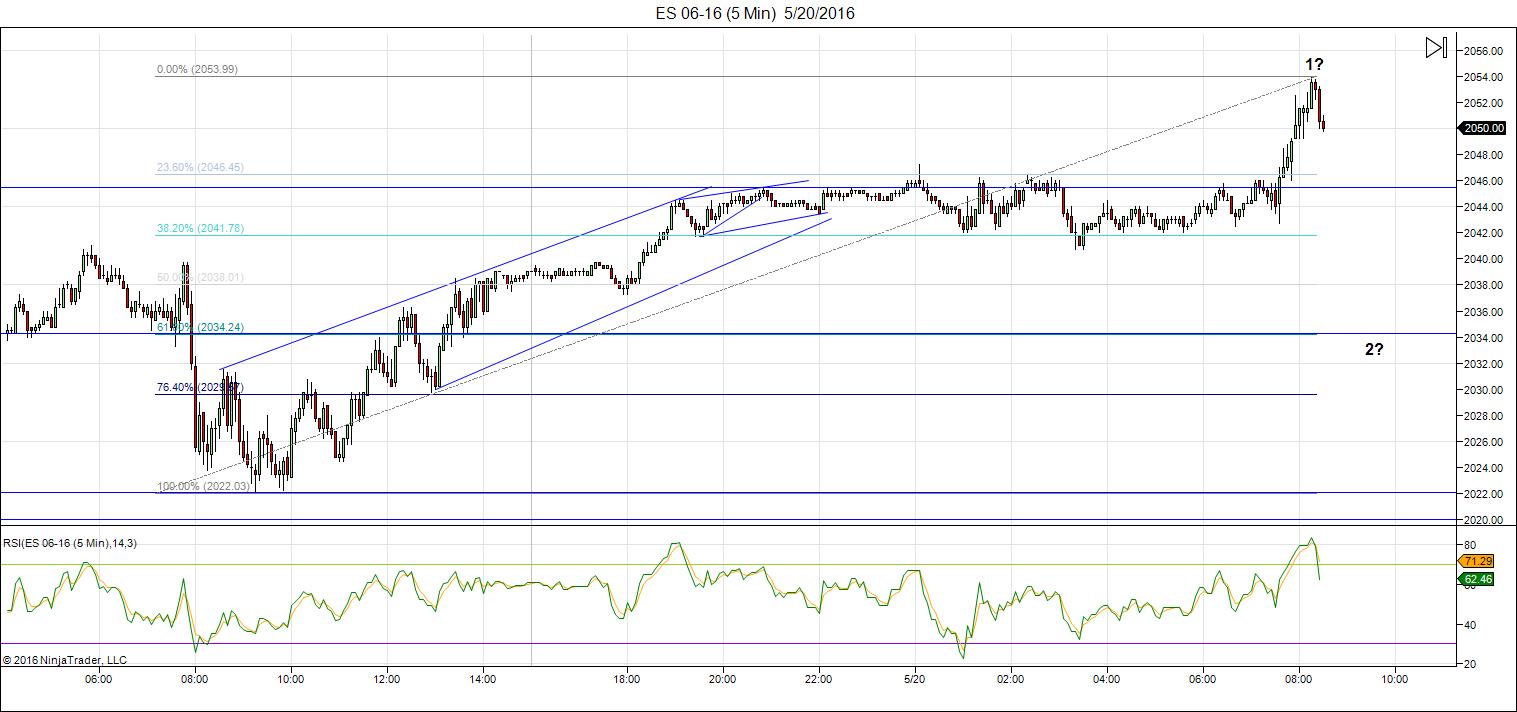
Above is the 5 minute chart of ES (emini futures of SPX) showing the wave to 10:30 AM. We now arguably have 5 waves up to about the 38% level (the typical stopping point for a 1st wave.
We now need to see a wave down ~62% to ~2034 to confirm a second wave. Then we’ll be expecting the 3rd wave up, which should be at least 1.618 X the first wave. That’s if this is going to be a typical ending wave up in 5 waves. That would be great, but unexpected, with everything we’ve gone through. We wait for more clues.
________________________
Update Thursday, May 19, After the Close
Above is the 60 minute chart of ES (emini futures of SPX). This shows the entire failed wave from the previous fourth wave at 2026 up to 2105. I’ve now labelled it as an abc configuration. The long fourth wave down follows. You can see that we’ve bottomed at the previous 4th wave, as expected.
Today we rallied, but the rally is in overlapping waves, so it should drop back down to a double bottom before heading back up in a real rally. The 5th wave up should go up in 5 waves.
Although I refer to the wave down as a fourth wave, it’s really a B wave in an ABC configuration from Feb 11. We’ve always known this was a corrective wave up. The “4th wave” is so large that it overpowers everything else (so it’s a B wave), and there is no question that we will have a C wave unfolding now. I’ll post more on this on the weekend.
_______________________
Update Thursday, May 19, Before the Open
My main computer is still down and it will go back into the shop this morning. I’m unable to post futures this morning. However, they’re down as expected and should complete this final C wave of the drop today.
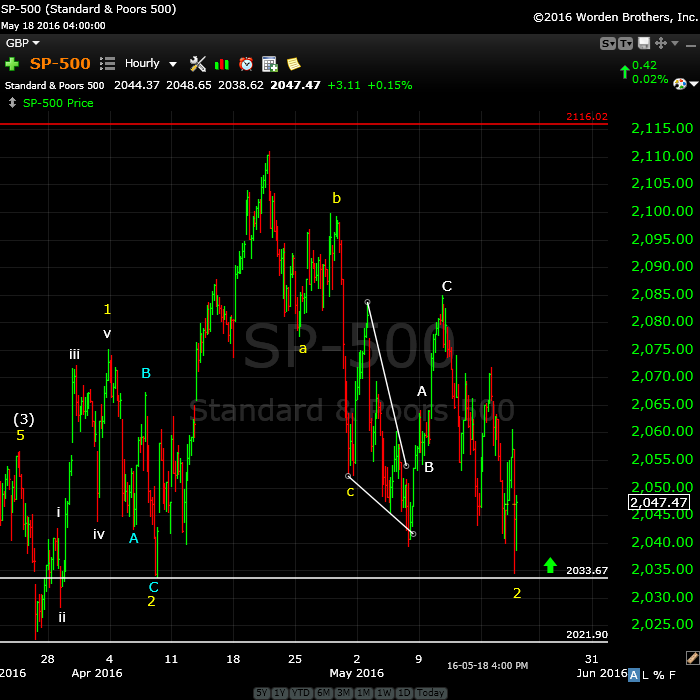
Above is the hourly chart of the SP500. I don’t know where it will finally settle, but I think it’s more likely to be 2033. The bottom of the fourth wave is ~2022. Below that would mean something else is happening, but my call is for a turn up. With the SP500, we had a valid first wave up in the left of the chart, so it can correct only to the 2nd wave bottom, which is valid under the circumstances. This would mean three waves up to the top in a fifth wave.
The Nasdaq also appears to be in a second wave position and could maintain it, which would put these two indices in sync. We’ll see what happens.
All the waves are are in 3 wave configurations. It’s interesting for me to note that the ending diagonal that we flagged (converging trendlines) was not in fact an ending diagonal (it’s not at the end of a C or 5th wave). I had reservations at the time and expected another wave up if it fact it was going to complete a diagonal. The internal waves were not correct. We didn’t get that final wave and it went on to do five waves up, which was the sign we would continue up higher.
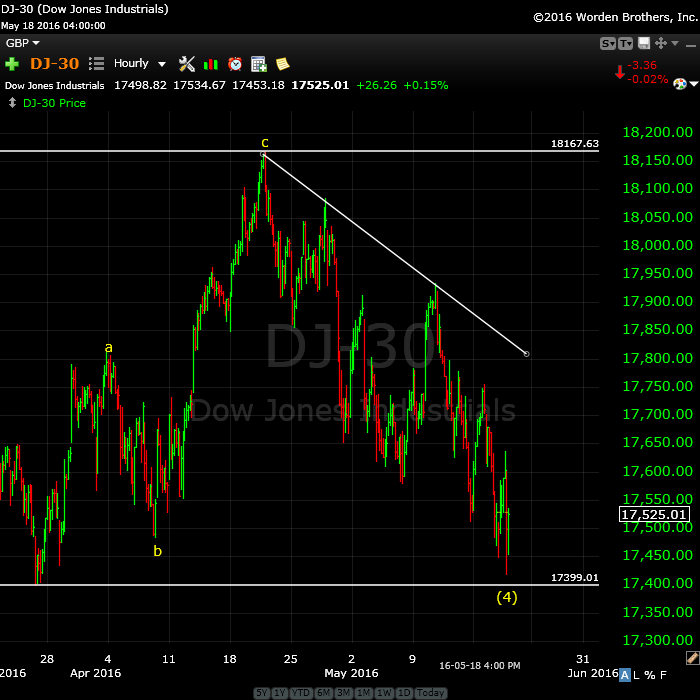
Above is the 1 hour chart of the DOW. We dropped as forecast, but I would expect a bit more downside this morning to allow us to bottom at the previous fourth wave shown. Then we should head up in a 5th wave. I would expect the DOW to meet the 17399 target or exceed it slightly.
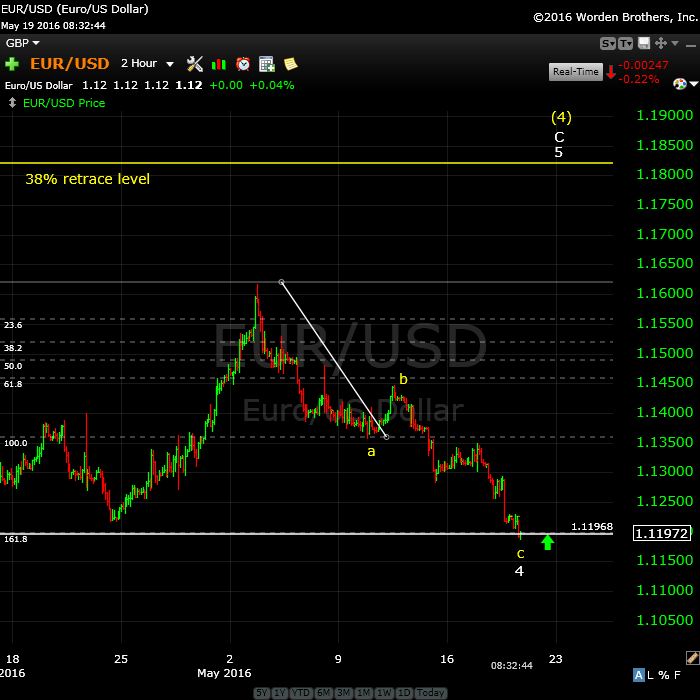
Above is the 2 hour chart of the EURUSD. This is the important chart for me today (along with AUDUSD). Both of them have reached the target (CAD is also on its way, but I think has a bit more work to do). The EURUSD chart shows 3 waves down to the previous 4th wave. I’m expecting a turn up here to head towards the 38% retrace level that I’ve mentioned before.
_____________________
Update: Tuesday, May 17, Before the Open
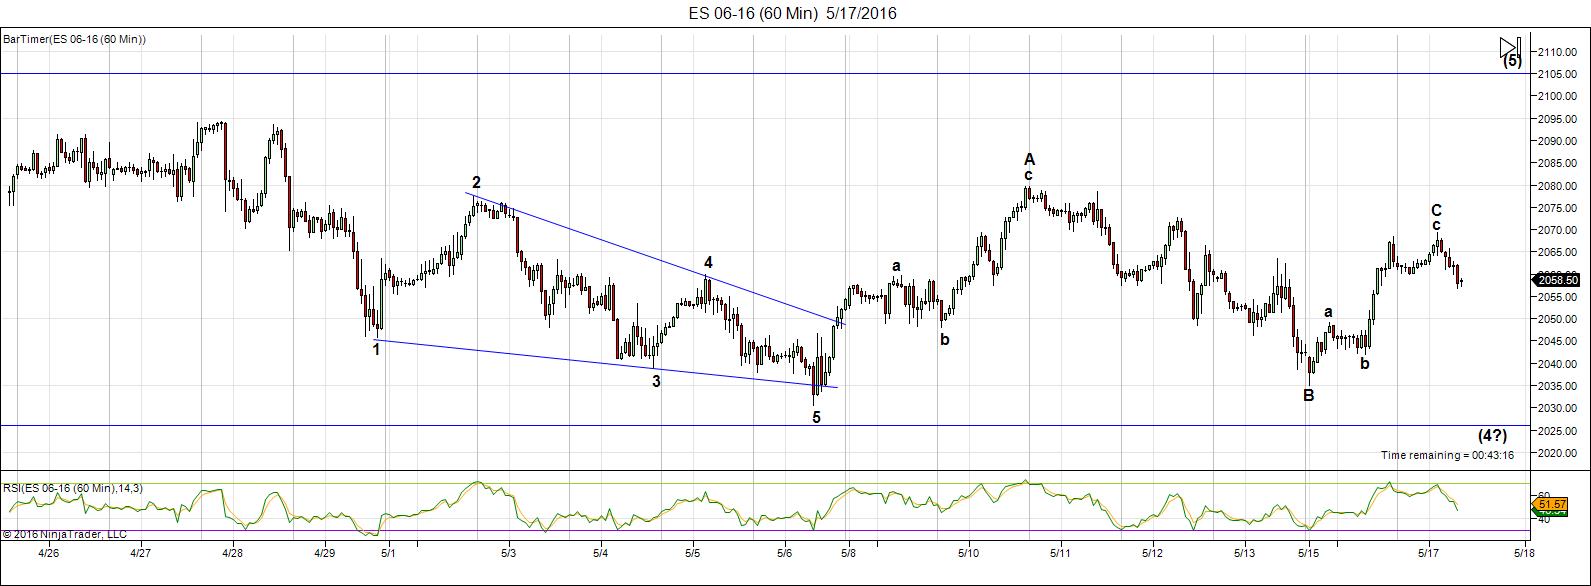
Above is the 60 minute chart of ES (SPX emini futures). Overnight, futures turned down after a double zigzag wave up. The key for me is that currencies also turned as predicted and appear to be finishing off the abc waves that they’d begun at the beginning of May.
The wave up is in three waves so I would expect the entire wave to retrace in parallel with currencies completing their abc correction (charts for currencies—EURUSD and USDCAD—are below).
___________________________
Update: Monday, May 16, After the Close
Above is the 60 minute chart of ES (SPX emini futures). Way over on the right on the chart, you can see today’s rally. Click on the chart to expand it.
The futures (YM, ES, and NQ) all had an abc bear market rally up today. Waves in 3 retrace and at the end of the day, it looks like we topped. We should retrace down the full length of this wave up.
I’ve made the comment that the waves haven’t bottomed properly. In Elliottwave, when a wave bottoms, we start the count over. Right now, we have a count that doesn’t make sense. It looks like a failed 5th wave. We got as far as (almost) completing the third wave up April 20 and, in fact, the final wave of that third wave was in 3 waves. There was no fifth wave. So we have a “failed wave” attempt at a top.
The wave down from that date has been corrective, but to “zero out” that failed wave, it’s got to bottom at the previous 4th—marked on the chart as (4).
The DOW has a similar issue in that it fell out of its triangle on Friday, but also has not bottomed properly.
So I expect today’s rally to retrace and after that, I expect a fifth wave to form and take us back to the top.
The alternative would be to keep going up, which could work OK for the SP500, because it’s in a triangle (triangle have waves in 3’s). But nothing else is in a triangle, so a fifth wave up for them would have to be in five waves. We don’t have that.
I hope this gives you and idea of what’s involved in the analysis. I can’t at the moment see any other workable alternative other than to come back down and bottom properly.
____________________________
Original Post: (Sunday, May 15)
All the Same Market. I’ve been mentioning for months now that the entire market is moving as one entity, the “all the same market” scenario, a phrase that Robert Prechter coined many years ago, when he projected the upcoming crash.
We’re starting to deleverage the enormous debt around the world. Central banks are losing the control they had and we’re slowly sinking into deflation world-wide, with Europe in the lead.
The US dollar is fully in charge of both the equities and currencies markets. They’re all moving in tandem, as I’ve been saying since September of last year. For a short while, currencies were moving contra to the US market, but for the two months or so, they’ve been moving together.
The most recent move up in the US dollar is in 3 waves, so it must retrace (chart below). EURUSD mirrors the dollar and it’s done the same thing. All the US indices, GDOW, and currencies are projecting one more wave up in equities.
US Market: All the major indices are within the previous fourth wave area, but have not reached the previous 4th wave level, which would be a logical target. There are two options here:
- a triangle (which could either be a regular 4th wave triangle, or an ending diagonal)
- a fifth wave (up in 5 waves).
There is nothing to stop us from falling our of the triangle the SP500 is now in. It could fall a bit further and create a barrier triangle (a horizontal trendline at the bottom), rather than a contracting triangle (that’s when the trendlines converge symmetrically). Or it could fall a little further to set up for a 5th wave (in 5 waves) up. With triangles, the 5th wave up is in 3 waves.
It’s up to the market here, of course, what it decides to do, but we haven’t reached a bottom yet, although we appear to be very close.
______________________________
Here’s a video overview of the market for Monday, May 16, 2016:
Market Report for May 16, 2016 |
_______________________________
The Charts Going into Monday
This past week, the highest probability was that we were in a fourth wave triangle. Friday afternoon, the DOW fell out of the triangle and it was clear that the US indices are still finding the fourth wave bottom.

Above is the 60 minute chart of ES now showing a fourth wave looking for a bottom. We could also end up with a barrier triangle, but I put that at a much lower probability. I do not see a converging fourth wave triangle now as an option. All the waves here are in 3’s, so this projects a final wave up once we hit a bottom. We appear to be very close.
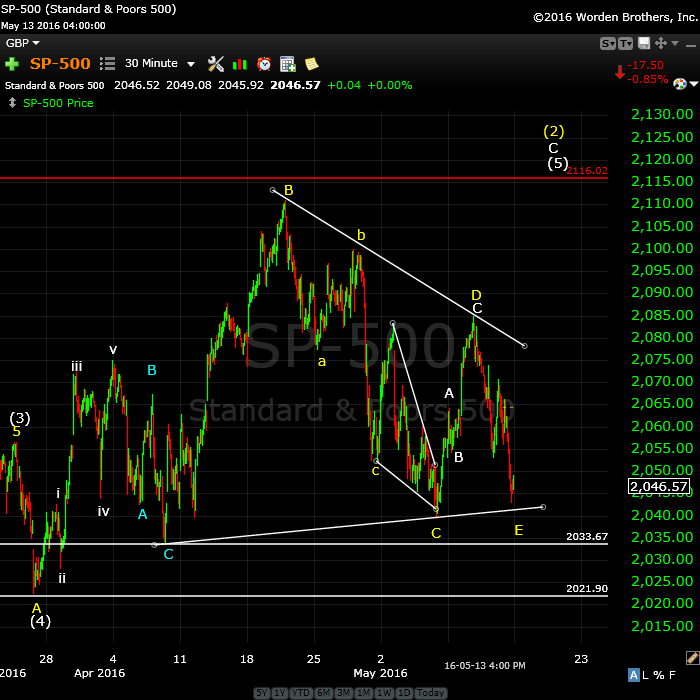
Above is a 30 minute chart of SPX. I’m not convinced that we’ll maintain this triangle. If we do, we’ll head up in 3 waves. If we come down to either of the horizontal lines, we should head up in 5 waves.
A full fourth wave ending at SPX 2023 or a bit lower would suggest a fifth wave up in 5 waves.
USDCAD and EURUSD are also in fourth waves now, consistent with that the equities are doing. USDCAD should now turn down and EURUSD up (once the 4th wave in US equities has bottomed).
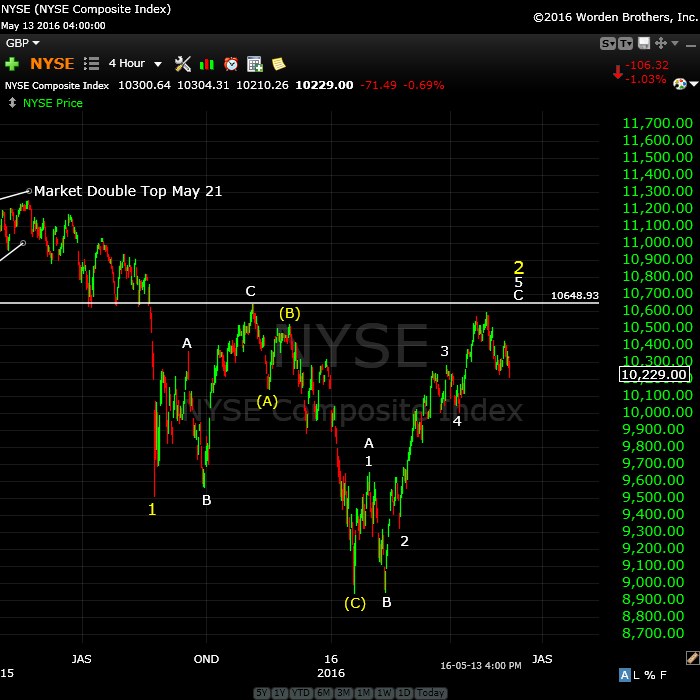
Above is the 4 hour chart of NYSE. I keep a fairly close eye on this index as it’s by far the largest in the world (in terms on capitalization). We are at the top of an ABC corrective wave (a bit more to go). I’m expecting a termination of this 2nd wave up at ~10648. This would “correct” the truncation and end in a double-pronged second wave. Third wave down should drop to around 6100.
So far, we’ve dropped in 3 overlapping waves, which projects a final wave up to a double top to complete the second wave. Then we’ll turn down into a third wave.
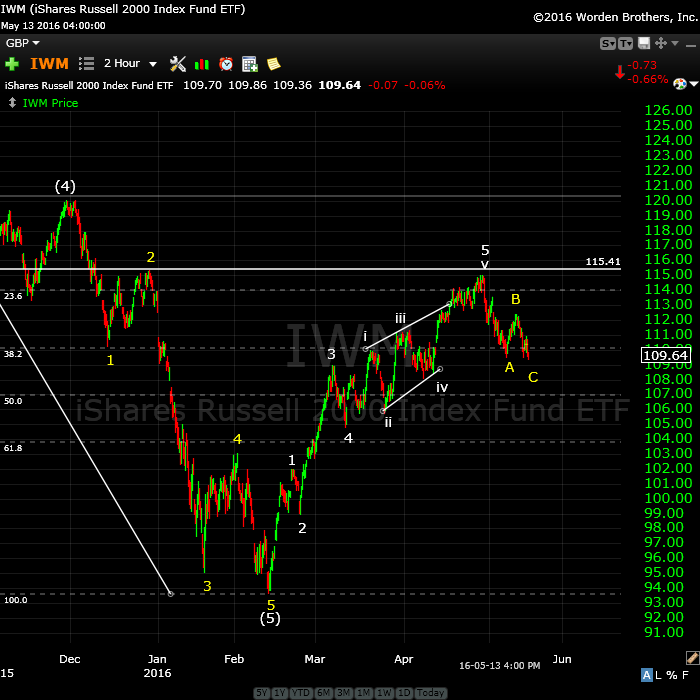
Above is a two hour chart of IWM (Russell 2000). This shows another perfectly valid way to label this wave up, but it’s actually a 3 wave move. The final C wave is in the process of bottoming before it turns up to complete a double top.
It’s traced out a very obvious ending diagonal with the “throw-over.” The first wave up has no second wave (as per the major indices), so as with the major indices, this is a corrective wave.
The current ABC wave down should now turn up to create a double top. I expect to see 5 waves up from here.
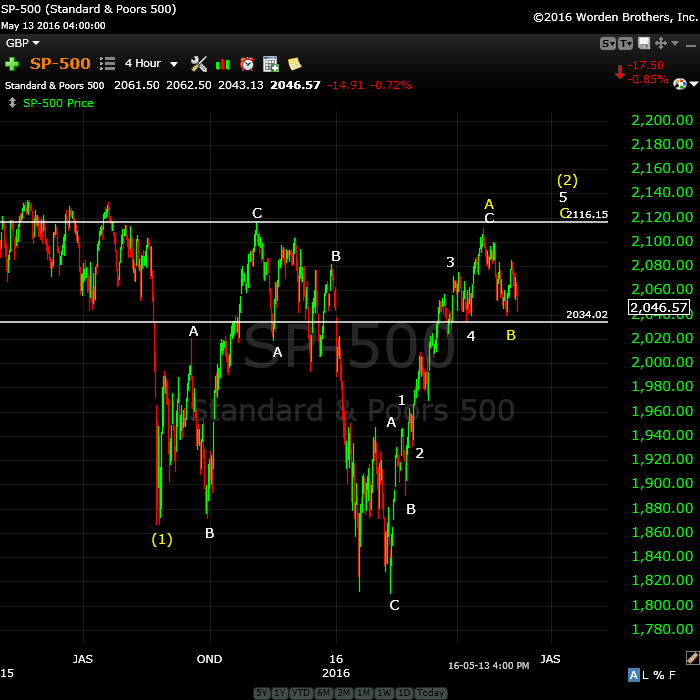
Above is the 4 hour chart of the SP500, showing the double 2nd wave top waiting to finish tracing out. This would negate the possible “truncation” from November of last year and create a spectacular EW textbook set up for a huge third wave down.
It’s typical in a bear market for second waves to trace out a double prong (an ABC wave down in this case from early November and a 5 wave structure up to where we are today). The five wave structure, however, is not motive (subwaves won’t necessarily all be in “legal” 5 wave motive configurations). I have therefore labelled this wave more correctly, showing that it is indeed a 3 wave corrective wave, with the (yellow) C wave up expected to produce a final ending wave of 5 waves.
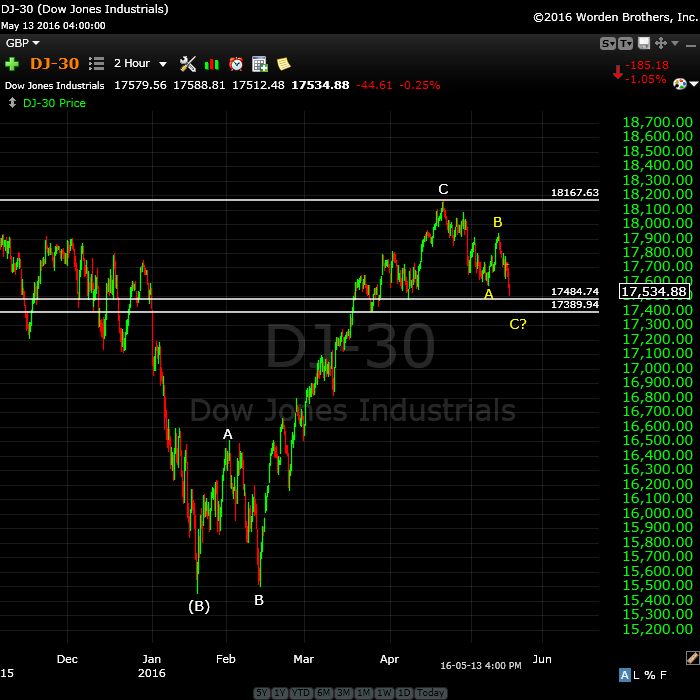
Above is the 4 hour chart of the DOW. It’s similar to all the other indices, as it should be. I predicted we’d reach the previous 2nd wave high and that in fact is what we’ve done. Look for a double top with the most recent high before a turn down. The reason I show this index is that I’m always looking to other indexes for confirmation of a move. You’ll note that the DOW did not come down to a new low in February, so this puts it clearly in a corrective abc wave up. As all the indices move in tandem, this supports the fact that SPX is also in a corrective wave.
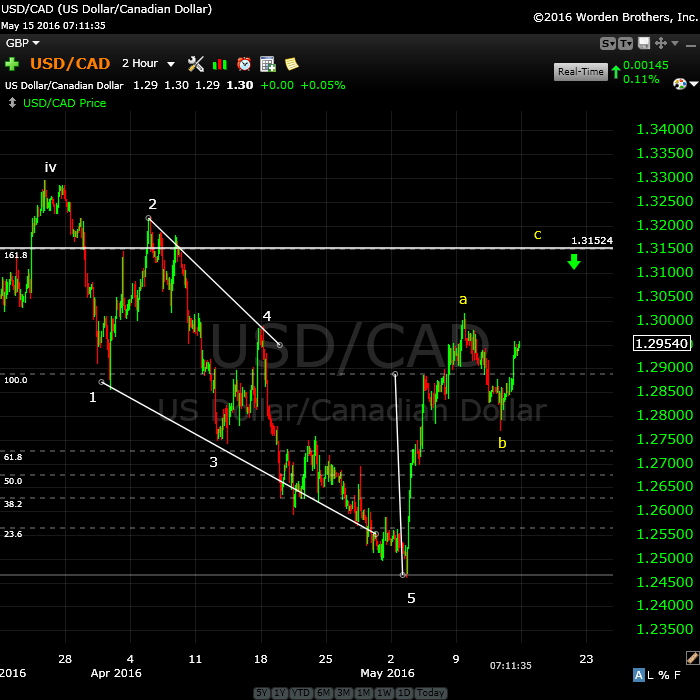
Above is the 2 hour chart of USDCAD. I have been stalking this for some time, waiting for it to bottom and we have the first signs now.
The larger pattern is an ABC corrective wave, and we have an ending diagonal, which looks to be complete. However, I expect this wave up in 3 waves to reach 1.315 before turning down to trace out a double bottom (to ~1.246). It could also drop to a lower level. Then it will turn back up into a very large 5th wave.
The euro, Australian dollar, dollar, and Canadian dollar are all at similar major inflection points.
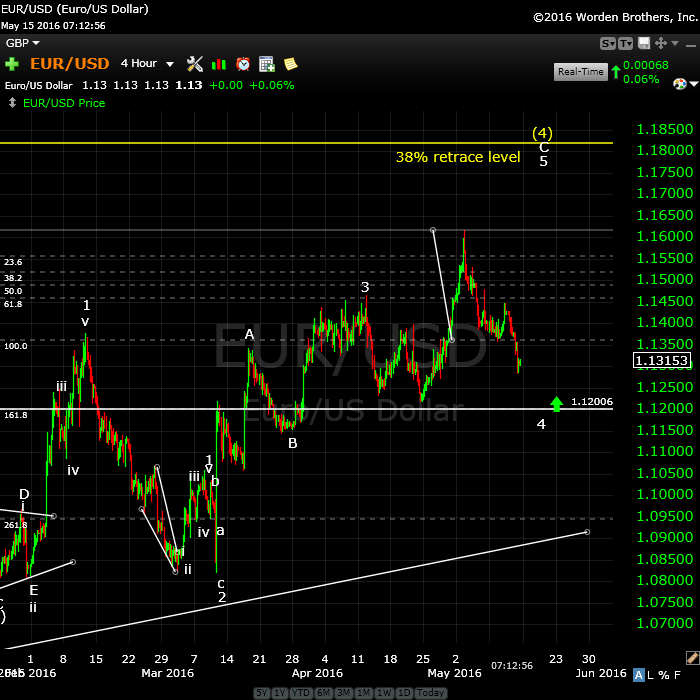
Here’s the 4 hour chart of EURUSD showing the major corrective pattern we’ve been in since March, 2104. I predict we’re going to hit the 38% retrace level (yellow horizontal line) that I’ve been suggesting for the past 8 months or so. As I explain in the video, the ABC wave heading up can be easily measured for an end point using your fibonacci tool.
It should turn in tandem with the US equities.
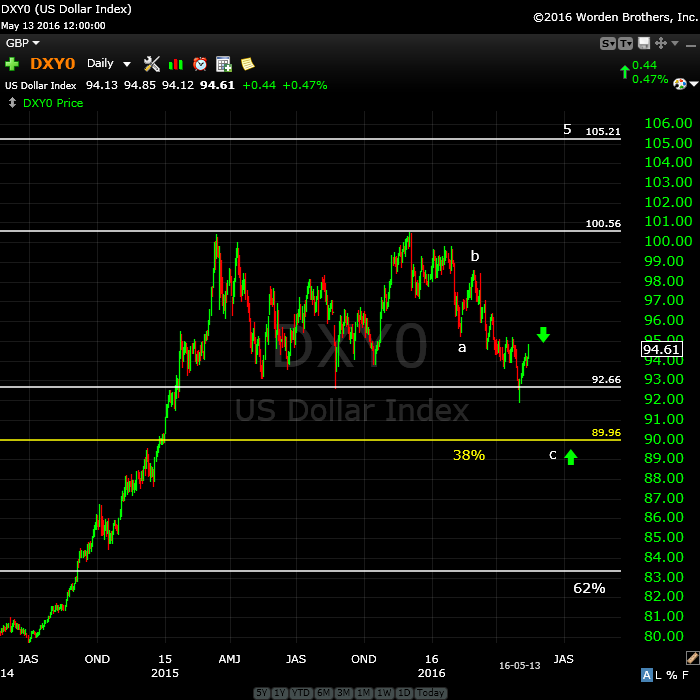
The US dollar (this is a daily chart) should do the same thing as the euro but in the opposite direction (down). The most recent wave up is in 3 wave, so we need a retrace. My preference is to see the US dollar tag the 38%retrace level (the yellow line).
I’m up in the air right now about the structure of this entire wave (from 2014). Although in 5 waves, it looks more corrective to me than motive.
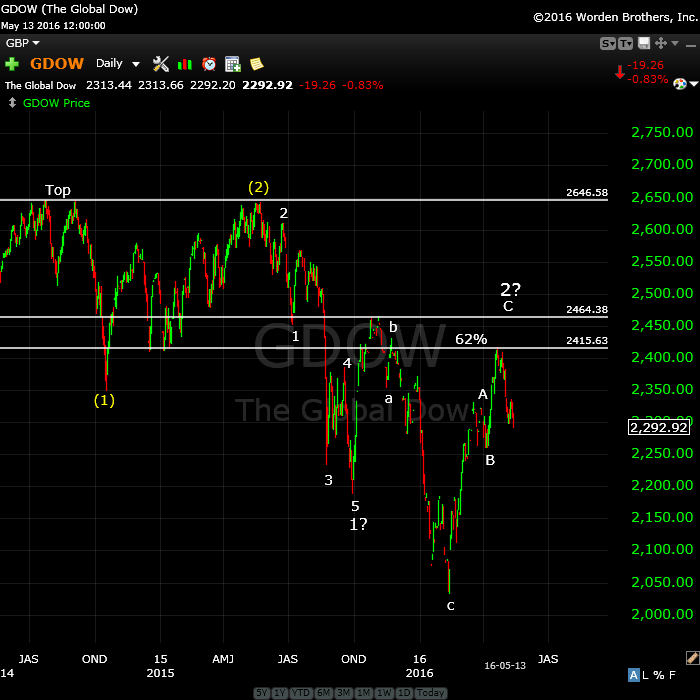
Above is the daily chart of GDOW (Global DOW) showing the current count. The short story here is that we’ve done a complete set of 5 waves down. As a result, the new trend is officially confirmed at DOWN.
NOTE: I have changed the numbering of these waves slightly from the version in the video. It changes the degree of the current wave up, but it doesn’t change the outcome. We should head down into the middle of the third wave, based upon the count shown above.
Bottom line: All the indices are lining up for a HUGE third wave down. More confirmation!
Major international indices like the GDOW and NYSE are where I do for the overall count. I can be much more committed (as I was on the SP500 first wave down, while everyone was questioning it) when I see a count on these two indices which is clear.
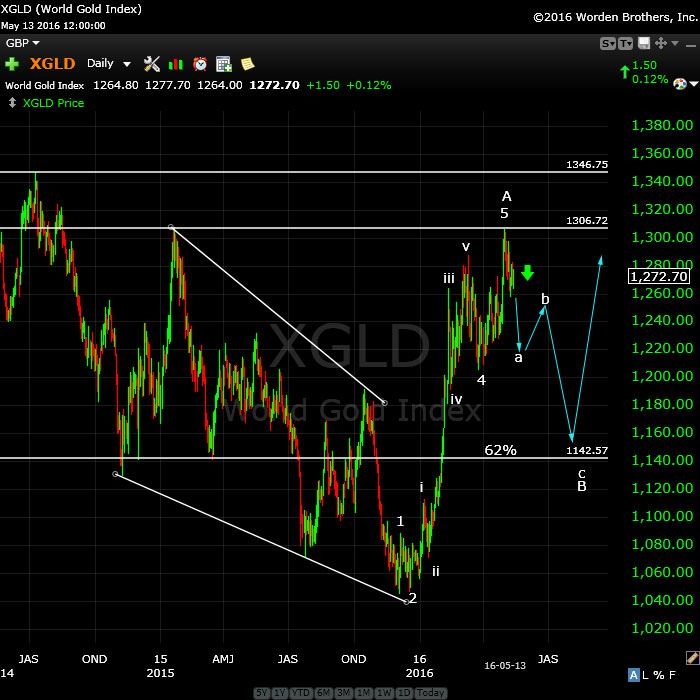
Above is the daily chart of XGLD (gold). No real change here in the past week. The bottom line is that we should turn down here. If we go much above the previous fourth (horizontal line) then I’m obviously wrong and something else is going on.
The target on the low side is the 62% retracement level, somewhere close to 1142.
________________________
First Wave Down – What to Watch For
This weekend we’re dangerously close to a top of a second wave (in the fifth of the fifth, with an ending diagonal pattern).
What we’re looking for to confirm a turn is a motive wave down in 5 waves.
Because we have an ending diagonal, the first wave will likely drop to the previous fourth, which is also the beginning of the ending diagonal pattern (~2022). After that, we should get a second wave that will retrace in 3 waves about 62%. That’s the preferred EW entry point. So don’t feel you have to rush in. There’ll be a much better opportunity at the second wave level than at the top and the risk is substantially reduced.
__________________________
History: The 1929 crash
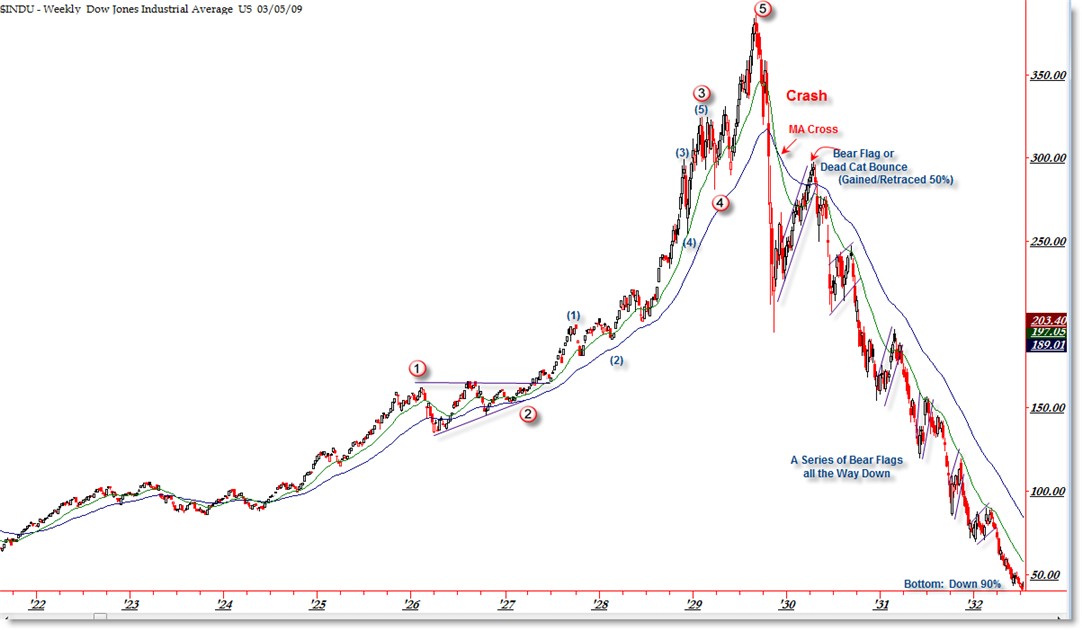
I think it’s important to look at 1929 and the wave structure (above and below), which was the same as 2007—to a point. I will show the 2007 crash below in the “What If” section.
The wave structure of the 1929 crash was in 3 waves overall. There were 5 waves down from the top (the A wave) and then a very large B wave retrace. The final C wave down was a stair-step affair and lasted over 2 years.
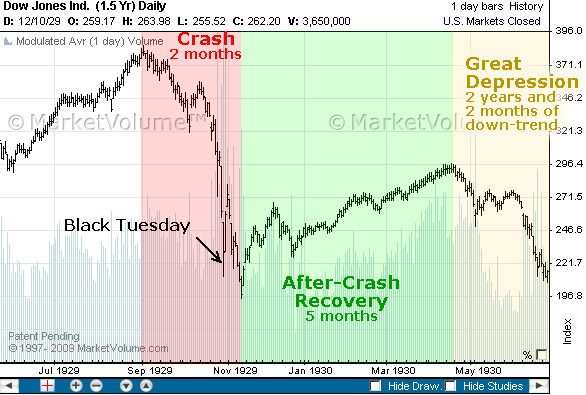
Let’s look a little close at the timing of the 1929 crash because the similarities to today are uncanny.
The market peaked on September 3, 1929 and then it took 2 months for the crash to actually happen (to reach the bottom of wave 5 of the A wave). The larger crash which we always hear about began on October 23, 1929. Then there was that large B wave, which lasted 5 and a half months and finally (which I explain a little further in the cycles section below), the C wave which went on for more than 2 years. This might be the scenario we’re looking at going forward.




Great insight Peter as always!
Great analysis of various market using Elliot Wave, thanks so much Peter Temple. Worldcyclesinstitute.com is very useful to me in learning EW.
PALS this week:
Phase: positive into FM open
Distance: neutral
Declination: positive early in week, very negative later in week
Seasonals: positive until Thursday close
Planets: post MerIC good, approaching Venus Supeior not good
Lunar/Planetary: Moon moves to pass Mars on Friday (very positive)
Summary: entering week with long position, will reduce it with each 1% increase in SPX price if this occurs, late May into June 10 has often gapped up in past so will probably not short until after June 10.
Thanks for all this info, Valley.
Thank you Peter
Thanks Peter,
I have an othter opinion I think we will drop further and maybe Opex will hold up this market for now but after that it’s down till June 6.
Good luck to all.
A bear market rally so far this morning. SPX has retraced 62% of the most recent spike high. I put the top for ES at 2058, which should be right about here.
In ES, if the C wave is going to extend, the next turn would be at 2065 (1.618 X A wave). 2058 was an extension of the A wave but we’ve slightly passed it.
So far this rally is in 3 waves. Although impressive, as far as I can tell, it should fail.
Peter,
When you say it will fail do you mean it will revisit the friday bottom before marching higher.
Bill
That’s what I’m expecting. Three waves retrace. Plus the euro and dollar have hardly moved all day and are both in 3 wave patterns. I have a minor turn date as well for tomorrow, which I would think would be a low.
Timely Article!
http://www.zerohedge.com/news/2016-05-16/markets-have-no-purpose-any-more-mark-spitznagel-warns-biggest-collapse-history-inev
After making over $1 billion in one day last August, and warning that “the markets are overvalued to the tune of 50%,” Mark Spitznagel knows a thing or two about managing tail risk.
The outspoken practitioner of Austrian economic philosophy tells The FT, “Markets don’t have a purpose any more – they just reflect whatever central planners want them to,” confirming his fund-management partner, Nassim Taleb’s perspective that “being protected from fragility in the financial system is a necessity rather than an option.”
“This is the greatest monetary experiment in history. Why wouldn’t it lead to the biggest collapse? My strategy doesn’t require that I’m right about the likelihood of that scenario. Logic dictates to me that it’s inevitable.”
More at link ~~
It’s a really big question as to what today’s wave is. Futures and cash are very different in structure. Futures are clearly in 3 waves, so this wave is corrective.
I know we’re eventually going up in fifth wave of some sort, but not all the indices seems to have bottomed properly. So I don’t feel comfortable that this is a first wave up. The DOW now is out of sync with the SP500, as it dropped out of its triangle, but hasn’t bottomed to allow for a motive count up. It’s all a bit of a mess.
We’ll retrace from here, but at the moment, I’m not sure how far.
I’ll spend time tonight trying to figure out the next move. We could retrace this entire rally.
Thanks Peter,
personally I’m “lost in translation”
Dimitri,
I think it’s a fake out rally. I’ll post a chart of ES shortly with where I think we’re going. I think my prognosis on the weekend is correct. We haven’t bottomed properly and we’ll do that tomorrow. I also have tomorrow as a minor cycle turn date, so that would make sense from that perspective, too.
This wave in futures is up in 3 waves. I would say the same about the cash indices although it’s harder to see it there.
I posted a chart of ES with an explanation of what I’m seeing.
fake out rally – agreed. such large put options and bearish positions have been taken lately, that any time the market makers believe it to be a quiet news cycle (volume) they ramp it up w/ consistent buy programs all day to panic the sheep out and reposition themselves. just like the gold $gld dump in 2 minutes today.
Why dont they just let the rally happen and get over it instead of playing games
So your weekly calls will expire worthless last Friday and market makers get to keep the premium. Or the SPY May 20 207 Calls you bought last Tuesday for $2 is now just $1. 🙂
Liz, that is why I mostly use 3X etfs. Less decay than options. I am able to sleep at night and not worry.
Look at Investors Business daily—-about 10 of every 12 months the market averages have an option week rally. At least 2 1/2 days. Anywhere from 200-500 points. From Friday’s interday low until todays high the averages have already done nearly 250. IMO—likely two more days up. How far, no idea. Just wait and see. Start looking down on Friday.
SPX can rally up to 2094 without any damage to the monthly fork ( 2007 H , 2009 L , 2015 H ) .
If price exceed April high of this year , then SPX will not stop at 2116 but will test or even can exceed the ATH of May 2015 to reach the final high @ 2160.
Yes, I know that does not work with Peter’s count … but this is what I see … so for now let us hope price will not go higher than 2094.
hi peter how can we discuss with u on specific cycles privately..
i think the crisis is emerging in euro bunds and cds of eu banks have been breaking out…
the whole rally in crude could reverse in a fash fall to 35 dollors in a matter of days …may is a deflation month…
Peter my question is from feb low C the whole thing looks ABC ..that is jan to feb then feb 11 C up with whole thing from august forming ABC …
USdYUAN is also on a breakout . we could get this with spike in dollor say 10% up move in dollor impulsive .thnx for ur inputs .i was looking at trigger event
ronit,
If you want to do a half hour consultation via skype (where we can share screens), there is an app in the sidebar that lets you schedule a time. There is a fee of $150 involved. It also provides a place to provide a short description so that I can be fully prepared with charts.
Hi Stuart
Tks for the feedback.
I do not use EW count , only Forks !
The key is April high , so let us wait and see if we will get there or not .
Regards
AZ
had the flu yesterday – what did i miss? :-))
peter, take a look at the wave structure from the 2111 high. can you see a “leading diagonal” – which is the why behind the 3 wave moves down? for me, from the 2111 high has the 3 wave look of a leading diagonal…..
hmm…so it looks to me “if” this was a leading diagonal – that we are in the “c” wave of 5 down for the first wave down. this should take us to the 2000ish level to hit the trendline down…..
leading “expanding” diagonal….to be more precise….
Don’t know what asset you’re talking about here. But I didn’t see any ending diagonals in major indices.
I added a chart of futures this morning at the top of the post.
Something akward,
Yesterday SP closed on 2066,66 May 1(6) and April (6) we also closed on 2066,66…it’s a sign we are on the other side now the big boys are shorting… Lol…
Daily are oversold but bolinger band at 2105. Vix daily bolinger band gettimg very narrow
Peter, thanks a lot for sharing all your thoughts with us! Very much appreciated! It’s interesting to see how all indices are lining up together.
I’ve got a question: what would happen if the congress passes the ‘9/11 Bill’ to Saudi Arabia? Would the Elliot Waves still be valid at that time?? Have you seen something like this before (that the Waves are not completed)?
Events have little effect on waves. It’s the other way around. The mood of the herd (which is what Elliott waves represent) determines events. Even 9/11 had virtually no effect.
This sell off is set up on low volume. Rally till end of month on low volume as indicators very os. It can hit 2105. Dont know if it suffice the req of peter. 2115. Spx. Donot know anything about emoni
There is the option that the wave up yesterday in the indices was the first wave of five waves (the start of the fifth wave). If this is the case, the SP500, should turn at the 62% retrace level, which is about here (I make it 2054 for the turn).
The 62% retracement level in ES is 2048. If we turn up here, we could go into a third wave up. I still have issues with the bottom of this 4th wave. But it’s so large, it seems to me more of a B wave in the bigger picture, and the rules for waves are not as stringent. So be careful. Based on the lack of momentum right now, I think it could go either way.
Also futures did go to a new high last night, so the wave up could arguably called a wave in 5, but it’s certainly not textbook.
We’ve broken through the 62% level, so that option is off the table. It was much lower probability.
I’ve lost my main computer this morning (have to get it into the shop) so I’m running a little bit blind intraday.
I now see a triangle option for the Nasdaq and NDX. This is becoming an extremely complex wave we’re in.
What I’m expecting to happen is that all the indices bottom at the previous 4th wave level, so we can start the 5th wave up. This is also a minor Pancholi cycle turn date.
I think the SP500 will maintain its triangle, but it will be the only one, if it does. I have the trendline at 2042.
It seems that your first option is still valid: ES looking for a bottom at about 2027. Than turn up to look for the 2116. First thoughts are (most of the time) the best ones 😉
Something simple…..weekly chart…..the 50 sma has only crossed the 100 sma twice
in the last 20 yrs to the downside……until May 2016
Chart of the DOW up top showing a little bit more downside to go to reach the fourth wave bottom. All the indices show a similar gap.
Hey rose
I notice your watching indicators 🙂
What to you make of the narrowing bollinger
Band on the Vix ? Where do those bands sit in
In terms of the Vix price ?
Second question : is the Vix price above or below
That narrow band range ( might sound like a dumb question)
I forget the old rule on the Vix and don’t have my notes
I think it was either a 5% or 15% band rule . Where you watched
For a break above or below the band followed by a reversal .
So last question : what is the percent on your bollinger bands
That you see the narrowing ranges showing up and is
That a daily chart ?
Which indicators are giving you the oversold reading ?
And finally , are you seeing any bullish divergences showing
Up on any of your indicators ?
Joe
Ps , thanks Peter for your updates 🙂
All lunar tuners line up positive early next week and stay that way for 10 days. So, if price goes really low next few days, will buy 3x etf spxl looking for rebound into early June.
vix: http://stockcharts.com/public/1092905/tenpp/4
dow;http://stockcharts.com/public/1092905/tenpp/1
spx:http://stockcharts.com/public/1092905/tenpp/1
daily , 60 min all oversold, it will be nice to have low volume rally
Joe: I have a question for you. ETFs say twm , qid. all the cylcles converging end of june/july, where eric hadik is also expecting a low, some rally till oct and down til jan 20, but if you hold these etfs they give everything away, what they did from feb, all the etfs gave away all the gains , if say at end of june spx is 1750, is it wise to sell them, if market rallies say to 1900 or so
http://www.zerohedge.com/news/2016-05-17/someone-really-wants-market-crash
somebody wants to crash the market
SPX up in 3 waves, ES overlapping waves. I have yet to see a bottom. SPX can go as low as 2022 (the wave 4 major inflection point), but may only go to ~2033.
Peter,
Do you think we have seen the low and now on our way up
Bill
No, and we look like we’re topping, in indices and currencies.
I am starting to filter in 3 batches today of short 3x etfs. If we are going to get lower lows, I would expect from thurs thru Monday morning. Good luck to all
This looks like a September 17th 2015 revisit on the FED meeting. That is, a smash after the minutes from last month are released.
Gary G.
I was going to say it seems like a repeat of Friday, only weaker … and then we tanked. These were all corrective waves up.
I would expect to see a bounce of about 62% of this drop and then another wave down.
hmmm….so the bottom of the bollinger band on the daily time frame for the spx is at 2034. it will provide support for prices, although the bottom band is now negatively sloping. this “usually” indicates that any bounce is potentially muted, with a high potential of prices falling outside the lower band.
so 2 times prices tested the 20 dma [bollinger band middle] 2 times reject. 20 dma is negatively sloping now. 2 times prices tested the 50 dma – 2 times rejected – hmmm…. 200 dma is @ 2011.
20 day about to cross negatively through the 50 dma……hmmm…
Peter, for calling it the end of the wave (4), do we need to touch your target (17402), or a little higher will do, like we just did? Or it has to be at least your target, and we could still go lower? Thanks again for your inputs!!
It has to at least make it there. It could go a little lower, but most of the time you’ll find it does a double bottom. If it goes appreciably lower, then something else is going on. But all the waves up top are corrective, so we should have a 5th wave up to go.
Peter,
How low are you expecting looks like we have done retracing already.
Bill
hmmm…seems the next level of support in dow is 17150 – with 17600 level being resistance
2043 seems like a good level to add some early June calls. If price reaches 2115, nice 3 percent gain.
We’re more or less at the wave 4 low. Currencies still have to bottom – their targets are in the charts in the blog post. They don’t have far to go.
US indices have done a wave up in 3 from the recent bottom this afternoon, so I’m still expecting a small wave down tonight to bottom properly.
If all goes well, we should start wave 5 up tomorrow.
I just got my dead computer back so I’ll post a couple of charts tonight with target numbers for bottoming.
Great to hear that the CPR did work 🙂
Well, unfortunately now there’s something wrong with the internet setup, so we’ll try again tomorrow ….
Hi rose
I’m not sure I understand your question .
In regards to leveraged etf’s ? I did not look up the symbols as of yet .
Leveraged etf’s attempt to track the specific index whether inverse
Or not based on the daily moves. I have noticed they tend to
Trade similar to the Vix . I know that sounds wrong but
Look at the Vix compared to an inverted leveraged etf , the divergences
Are huge near market lows or highs . The only thing I can take from it
Is I avoid leveraged etf’s with one exception . I would trade them only
In a 3rd wave or a C wave . Other than that I avoid them because they
Give it all back in waves 2 and 4 or wave B. Also while I do look at and use
Shorter term charts I base all my indicators on daily and weekly charts
For position trades . A 10 day or 20 day moving average gives me 2 weeks
To 1 month of forecasting ability . The market on average tends to rise for approx
10 to 13 trading days and fall for 10 to 13 trading days based on the indicators I look at .
A 23-26 trading day cycle tends to sync with the new and full moons yet not always exact.
It can be 1st Qtr moon or 3rd Qtr moon also. A 60 minute chart will show divergences to
Early as far as I’m concerned yet if: if the daily 10 or 20 day or even both are showing the divergences
And then I go into the 60 minute charts I’ll then use the shorter term indicators for my triggers to take the
Trade . Hence I start longer term and then go shorter term. The order is therefore long term to short term
Always. 36 day bar chart , monthly bar chart , weekly bar chart ( longer term trading) daily bar chart – 4 hour or 2 hour
Then 60 minute 13 minute then below 13 minute it becomes which minor bar chart shows me the cleanest wave
Count . I may use a 1 minute bar chart but it is only for very very short term intra day trading .
As for your question on etf’s ? Any etf’s that are leveraged in my opinion should only be purchased in anticipation
Of a wave 3 or wave C. Lastly if you look at previous market declines you will see that after about 39-41 trading days
The bottoms tend to form if some degree . That’s roughly 2 months . You may argue that and say from May 2015 to August 2015
Was high to low ? in that case your looking at 90 days but how many actual days was the bulk of the move ?
That’s my point and that’s where I’d be in a leveraged inverse etf and I’d be avoiding all waves except wave 3 or C.
I’d be watching my indicators in the same fashion as the Vix . Most indicators don’t trend the move in a range
Treat the etf’s the same way .
A bit long winded yet I hope that helps
Joe
Charts are posted up top for this morning.
hmmm…. so prices have indeed fallen outside the “negatively” sloping lower bollinger band of the spx.
200 dma is at 2011. dji next level of support is 17,150.
so the 20 day MA @ 2066 is about to cross negatively through the 50 dma at 2059. this is usually the “negative” indicator i look for to “confirm” a top is in place.
I count one motive wave up for EURUSD. Looking for a 62% retrace and then a turn up.
Looks like we bottomed at 2027? If I’m reading your chart correctly we should begin to see 5 waves up to 2116?
I think so. The euro is showing signs that’s the case.
We’re not out of the woods yet. I would not at all be surprised to see SPX test the 2022 target, but that has to hold. The EURUSD wave up and subsequent 62% retrace is encouraging. The dollar should turn down. It rules the market. If it does turn down (and euro continues up), we’re looking for 5 waves up at small degree in the indices and then a 3 wave 62% retrace with another turn up.
You’re a real Master! Most analysts are shorting the market now, but I believe you are absolutely correct in your forecast. Respect.
A master indeed… To bad most are blind and cannot see!
Cheers,
W
Tks … it’s early. But now I have a fixed computer, I think! Was out for past 2 hours.
Thanks, johan. I’ll tell ya, I’ve seen some strange counts over the past 24 hours by people that should know a lot better.
As mentioned yesterday, I slid in 3 batches of ETF shorts. One batch of UVXY , two separate batches of SPXU. Sold one batch of UVXY, still have 2 batches of spxu to sell later on. Looking at this graph I have spoken about. I will be completely out today and going long going into Friday only, where I will be going short over the weekend. Good luck to all. Please note. I ONLY USE THE 3X ETFS for for short term trading purposes only. UVXY max 3-5 days spxu UPRO max 7- 9 days. Due to the decay. They are not to be used for ex 1 month or more. I use them because, I like to sleep at night and not worrying about my options expiring worthless.
Out of longs from close to the 2024 ish level. Decided to buy BATCH OF SPXU 29.30 FOR TOMORROW MORNING.
Peter,
On the SPX – 5 Min , am I right to say we have now 5 waves up ?
AZ
No, not yet. And I don’t like the look of it. Don’t be surprised to see us come right back down for a double bottom.
Thank You
AZ
The first wave is the culprit. It’s in 3 waves and we don’t have a double bottom. Two reasons to be cautious.
AZ,
Now that I have my main computer up and running, I can see a little better. We may be OK, but it’s early. SPX needs to do 5 waves up probably to 2049 and then 3 waves down 62% and turn back up. That will cement the new trend. You want to enter (from an EW perspective) at the bottom of the second wave (that 62% drop).
Yes, I agree Peter … Thank You again
AZ
It looks like we’re coming back down, but looking around, I think we’ve all but bottomed. SPX might still hit that target yet. I much prefer to see a good, solid double bottom.
Peter some counts r spx bottomed now 2300 because election yr does not have coeection. When spx hit 2022 they were saying 1500. But peter thanks for all the guidance really appreciate it
There is so much BS out there. Like an election could have some effect on the market, which is traded internationally, is all moving together right now, and since the planets are such a huge influence, that somehow they would know that.
You’re welcome. 🙂
For over three weeks equities have been pulling back from the high on April 20; a high that tested the same level seen in the S&P 500 at the August and November highs – 2,110. A break of 2,033 will confirm that the herd has turned. The 200-dma and horizontal support converge near 2,012-2021. However, a break of 2,040 will trigger a bearish head-and-shoulders pattern that measures a minimum decline to 1,970.
From Lindsy Model
A 14month cycle low is due in May/June and should be pulling equities downward but in the eighth year of a Presidential term, following an April high, equities typically get a bounce from mid-May into early June. That bounce is followed by a long decline into Nov/Dec.
Thank you for your reply Stuart. As mentioned last week to my reply to John, I was also looking for 1980 level. I bought one 1/3 batch of spxu late last night. I have bought spxu for average cost of all three 28.86 this morning. Still looking for at least a retest of yesterday lows or lower Monday morning, with a biorhythm graph of the world that seems to correlate nicely with the over all markets. I agree with you Stuart, that we will see us shooting out the gate to slaughter some hard core bears to new highs.
Don’t get too excited about this rally. It’s got overlapping waves. Me no likey. 🙂
The EURUSD chart that I thought was a motive wave doesn’t now hold up to my eyes. It’s a one minute chart, so it’s hard to analyze. But the structure doesn’t look quite right to me, so I would guess it will come back down to a double bottom.
I see XGLD (gold) is finally starting to move down.
This website is for educational purposes relating to Elliott Wave, natural cycles, and the Quantum Revolution (Great Awakening). I welcome questions or comments about any of these subjects. Due to a heavy schedule, I may not have the time to answer questions that relate to my area of expertise.
I reserve the right to remove any comment that is deemed negative, is unhelpful, or off-topic. Such comments may be removed.
Want to comment? You need to be logged in to comment. You can register here.