December 29, 2013
 Offline
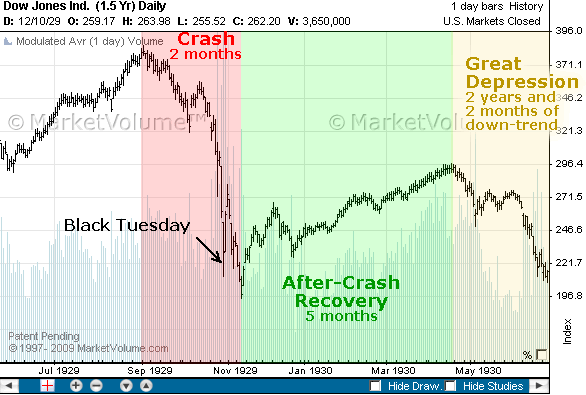
Here’s a chart of the 1929 drop to give some idea of timing then. The predicted drop this time will be much larger, of course, because this it the largest debt bubble in history, so it’s a bit of a guess as to the bottom, but perhaps we’ll get some better projections from astro people roaming around.
Most Users Ever Online: 75
Currently Online:
1 Guest(s)
Currently Browsing this Page:
1 Guest(s)
Top Posters:
houseflii: 19
Platy: 14
tedward728: 4
ricardo geyer: 2
Tamon Yamaguchi: 2
Newest Members:
frank müller
Mudali Krish
Ben Bragg
Charlie Michael
Geoff Jefferson
Forum Stats:
Groups: 5
Forums: 24
Topics: 106
Posts: 179
Member Stats:
Guest Posters: 1
Members: 1328
Moderators: 2
Admins: 1
Administrators: Peter Temple
Moderators: Whazzup, Chris Pearson

 Log In
 Home
Home


