Update Friday, May 6, ~ At the close
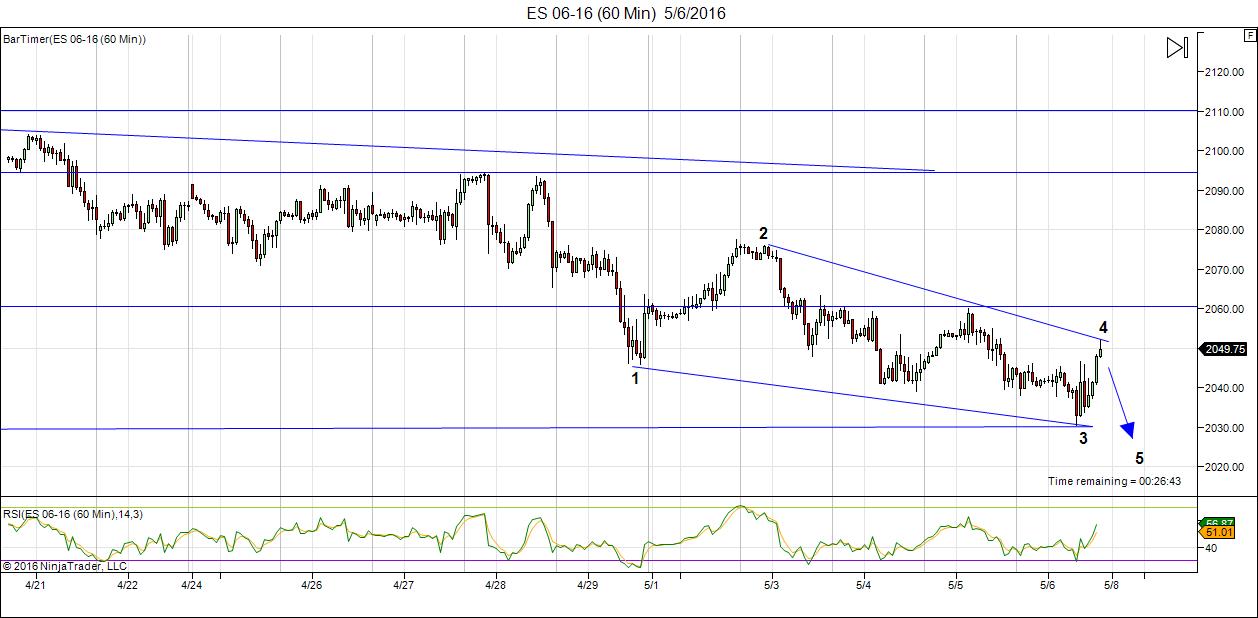
Above is the 60 minute chart of ES showing what looks like an ending diagonal. If so, we’ll see one more wave down. The wave up today is in three waves, so it should come down. I’ve been able to count 5 waves in its C wave.

Above is a 1o minute chart of SPX just before market close (4PM EST) so you can see the ending diagonal pattern a bit better. The waves up today were in 3 waves (you can see the abc configuration). Waves in 3 always retrace. So we need to get to a new low.
An ending diagonal drops to a throw-over wave (it should exceed the lower trendline). In this case, our target is 2033 for SPX. Ending diagonals are the final waves in a sequence. It will end in a dramatic reversal and the first wave up will go to the beginning of the ending diagonal pattern (in this case, about 2083).
The larger wave down from the top is overlapping. So this is a corrective wave down. The bottom line is that the direction is still up. We’re looking for a bottom for this wave. It looks like we’re going to finish this fourth wave. I suspect the wave down will last through Sunday, which means we may bottom Monday morning.
A full fourth wave ending at SPX 2033 or a bit lower would suggest a fifth wave up in 5 waves.
USDCAD and EURUSD are also in fourth waves now, consistent with that the equities are doing. USDCAD should now turn down and EURUSD up.
___________________________
Original Post (May 2): Not much has changed in the past week. We’re still targeting the previous top of this large degree second wave, getting ready to topple over into a the largest third wave in history.
However, Friday’s action in the US equities markets, and the reaction they got on the blog, have pushed me this weekend to concentrate on some Elliottwave basics—the really basic—the difference between corrective and motive waves.
There are not a lot of rules in Mr. Elliott’s Principle. There are quite a few guidelines, but the hard rules are few and CAN’T be broken. If you learn them and stick with them, you’ll seldom go wrong. And yet I see people breaking them all the time … over and over again.
These are the hard rules for impulsive (motive) waves
- An impulse always subdivides into five waves.
- Wave one always subdivides into an impulse.
- Wave 3 always subdivides into an impulse.
- Wait five always subdivides into an impulse or a diagonal.
Today’s video concentrates on the most recent wave up and pulls it apart for you so that you know what I look for in my analysis and where most people go wrong.
If you’ve been with me for any length of time, you know my mantra: “Trade what you see, not what you think.”
Trading what you think is going to happen will get you in lots and lots of trouble and lose you lots and lots of money. Trust me on that one. I made that mistake way back when, too.
Finally, be patient. The wave pattern will end when it’s good and ready. It will turn over into a series of huge, motive waves down. You can see the size of the waves is already threatening to increase. You ain’t seen nothin’ yet!
From the Elliott Wave Principle: “Third waves are wonders to behold. They are strong and broad, and the trend at this point is unmistakable. Third ways usually generate the greatest volume and price movement, and are most often the extended wave in a series. Virtually all stocks participate in third waves. They also produce the most valuable clues to the wave count as it unfolds.”
Preliminary Targets (at 2.618 X the length of the first wave down)
- SPX: 1405
- DOW: 10,460
- NDX: 2370
All the Same Market. I’ve been mentioning for months now that the entire market is moving as one entity, the “all the same market” scenario, a phrase that Robert Prechter coined many years ago, when he projected the upcoming crash.
One of the frustrating elements though, is that when the market turns, it takes longer than usual to do so, because the entire world (in terms of the major indices, and by extension, the mood of the masses) is turning at the same time.
The entire world is moving to the tune of debt and the deleveraging that has to happen. All bubbles burst eventually and this one is one that will go down in history, because it’s the largest debt bubble in history.
The direction of US equities is still up. On Thursday/Friday (28/29), we had a cycle turn, but it wasn’t the one we were waiting for. The market “faked us out.”) However, there are no more major turns possible. This is the fourth of the fifth and the next major turn will be down.
______________________________
Here’s a video overview of the market for Monday, May 2, 2016:
Market Report for May 2, 2016 |
_______________________________
The Charts Going into Monday
Note that there aren’t huge changes from last weekend. We’re simply progressing in this final wave and are virtually at the final target. I’ll start with ES to give you an idea of where we left off at the end of the day on Friday and then we’ll take a look at the bigger picture. Everything is pointing to the same end point and a major turn.
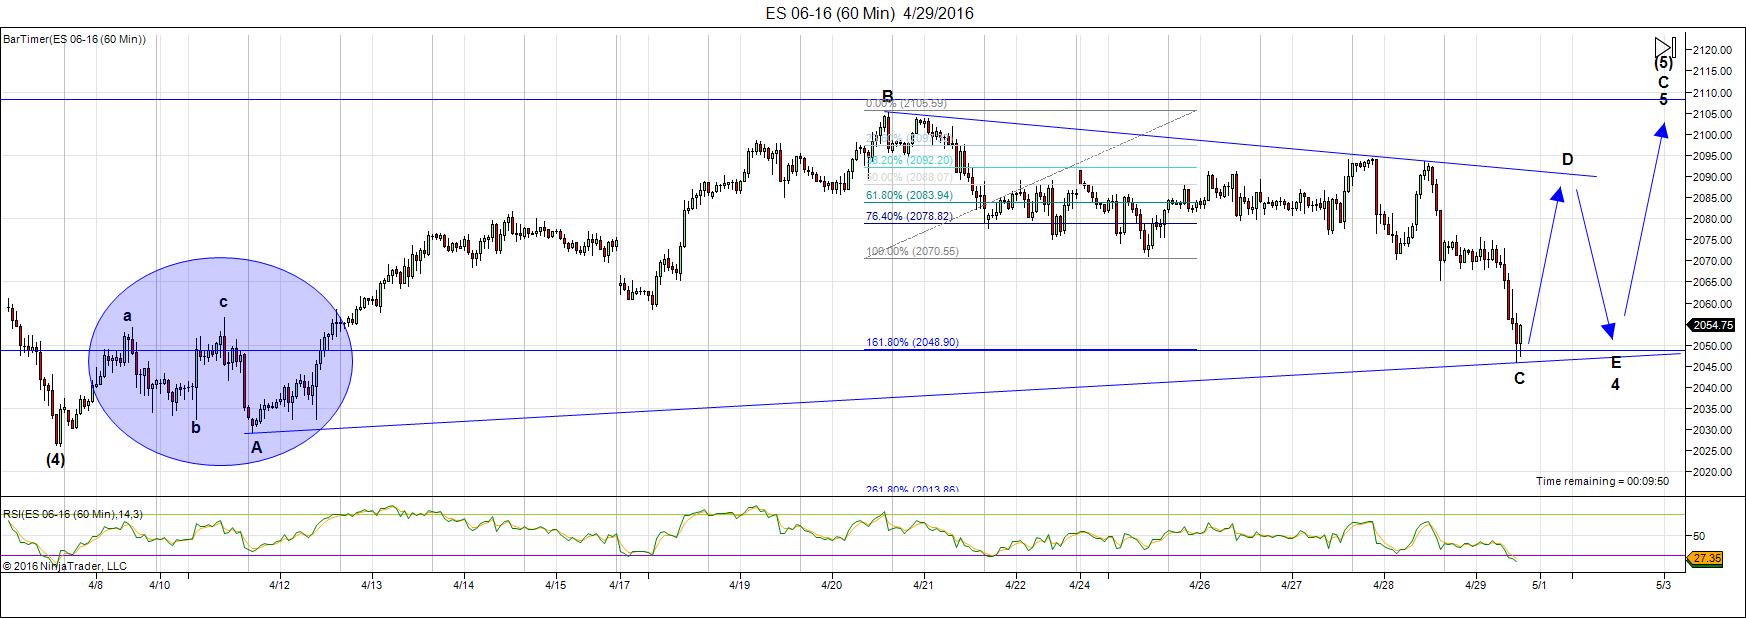
Above is the 60 minute chart of ES (emini SPX futures). The fourth wave triangle I’ve labelled here (after Friday’s action) completely resolves the issue I was having with the area in the blue circle). While I had originally labelled it a 1-2, 1-2 motive sequence and predicted a fifth wave up, I had mentioned that I had reservations because the c wave up in that circle was in three waves. However, you can’t have a three wave sequence within a motive wave. Rather, it suggests a triangle (either a 4th wave triangle or an ending diagonal). Well, we have a triangle, finally! This is the most likely scenario going forward.
I say it’s the most likely partly due to the fact that the SPX has a shorter amount of time to get to the top, the futures, of course, go round the clock. Often you’ll see a triangle in futures as cash indices take a more direct route to the same end. So, we may not see a triangle play out in the cash indices, even though that’s how I have them labelled at the moment.
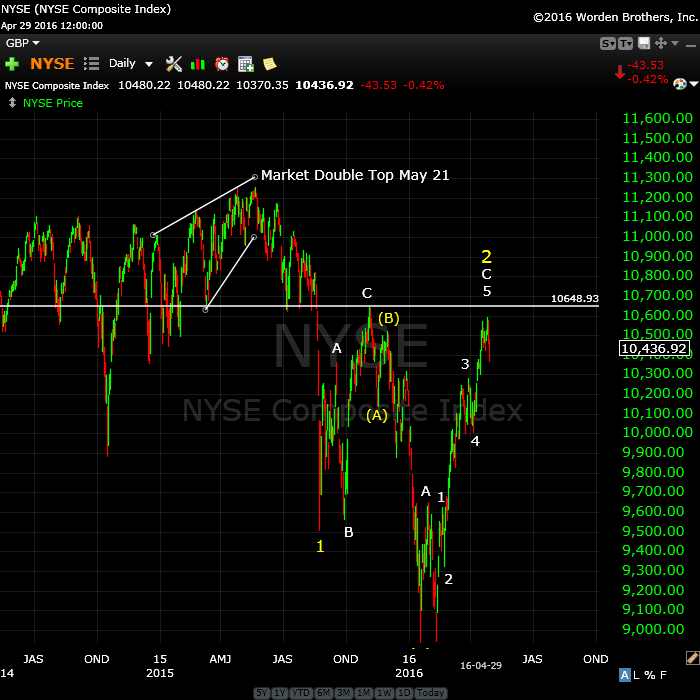
Above is the daily chart of NYSE. I keep a fairly close eye on this index as it’s by far the largest in the world (in terms on capitalization). We are at the top of an ABC corrective wave (a bit more to go). I’m expecting a termination of this 2nd wave up at ~10648. This would “correct” the truncation and end in a double-pronged second wave. Third wave down should drop to around 6100.
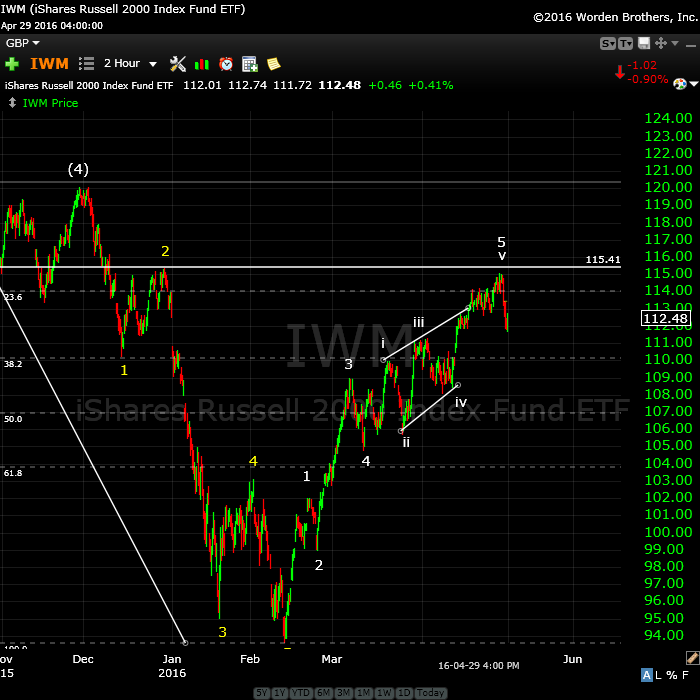
Above is a two hour chart of IWM (Russell 2000). It’s traced out a very obvious ending diagonal and just has the throw-over to complete. This is a small caps stock base and should give a pretty good indication of what’s happening overall. It has a little more of the throw-over to do and may end up even with the top of the yellow 2 wave.
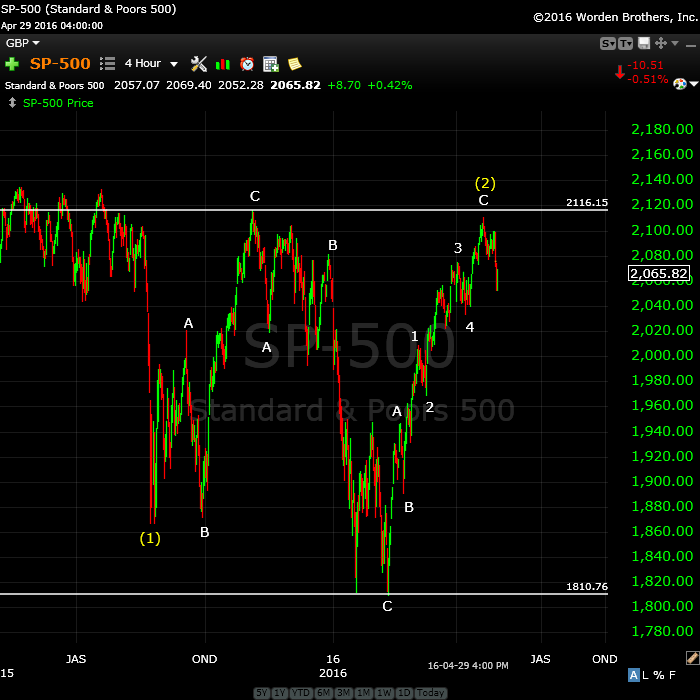
Above is the 4 hour chart of the SP500, showing the double 2nd wave top waiting to finish tracing out. This would negate the “truncation” and create a spectacular EW textbook set up for a huge third wave down.
Second waves have few restrictions. The key rule is that they can not retrace to the previous top. They should retrace between 62 and 100% (but cannot hit the 100% retrace level). I expect us to reach 2116 before a turn down.
It’s typical in a bear market for second waves to trace out a double prong (an ABC wave down in this case and a 5 wave structure up). The five wave structure, however, is not motive (subwaves won’t necessarily all be in “legal” 5 wave motive configurations). I have therefore labelled this wave more correctly, showing that it is indeed a 3 wave corrective wave, with the C wave sporting 5 waves (more on this in the video).
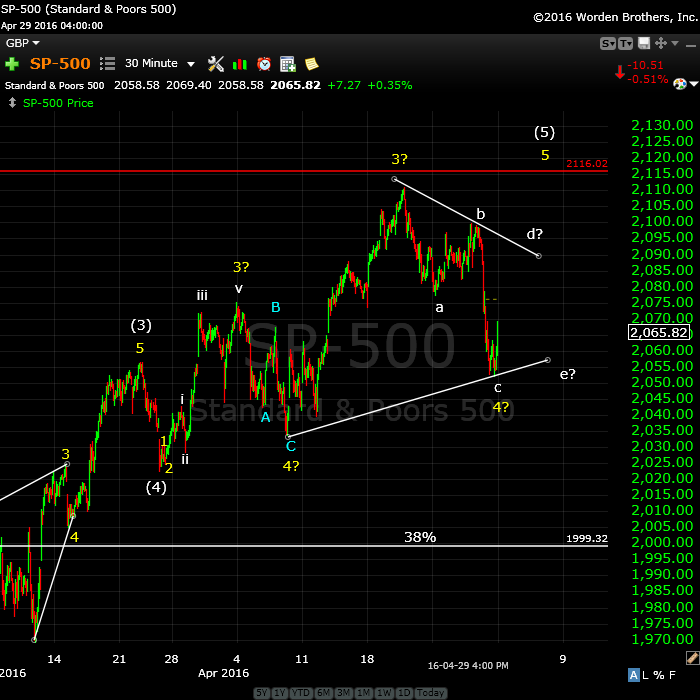
Above is the 15 minute chart of the SP500, so I can focus in on the wave structure of this final wave up. On Thursday/Friday, we got a C leg drop in what appears to be a 4th wave of some type. The C wave could go lower still. At its present level, it works best as a triangle. However, if it drops further, we’ll label it a large fourth wave. It can easily drop to the previous 4th (yellow to the left) or even the 38% retrace level (from the bottom at Feb 11) before ruffling my feathers.
The video goes over why this is a corrective wave. We’re still waiting for it to hit the previous high at 2116. The chart is showing multiple counts as I’m not sure where this fourth wave will eventually end up. We will know more by Monday.
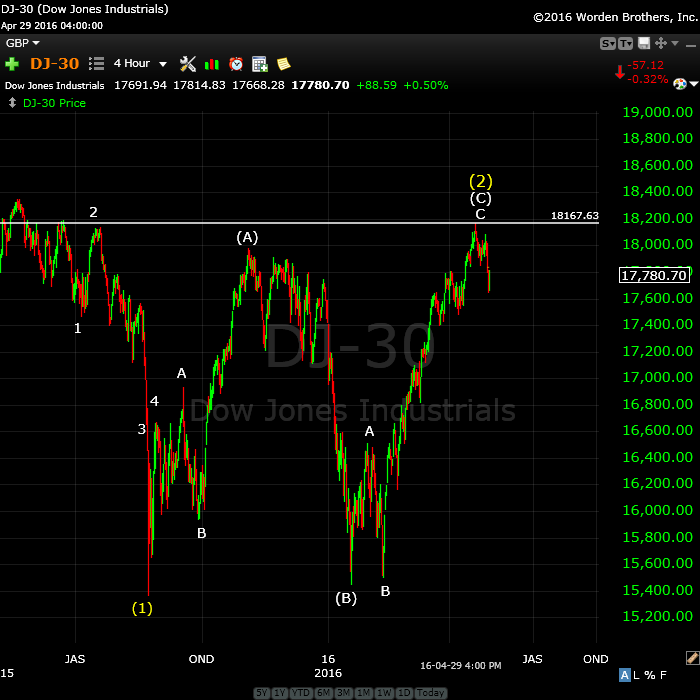
Above is the 4 hour chart of the DOW. It’s similar to all the other indices, as it should be. I predicted we’d reach the previous 2nd wave high and that in fact is what we’re done. Look for a double top with the most recent high before a turn down. The reason I show this index is that I’m always looking to other indexes for confirmation of a move. You’ll note that the DOW did not come down to a new low in February, so this puts it clearly in a corrective abc wave up. As all the indices move in tandem, this supports the fact that SPX is also in a corrective wave.
Note that just about everywhere I look at individual stocks, we’re in huge second and fourth waves spikes. This whole market is about to turn.
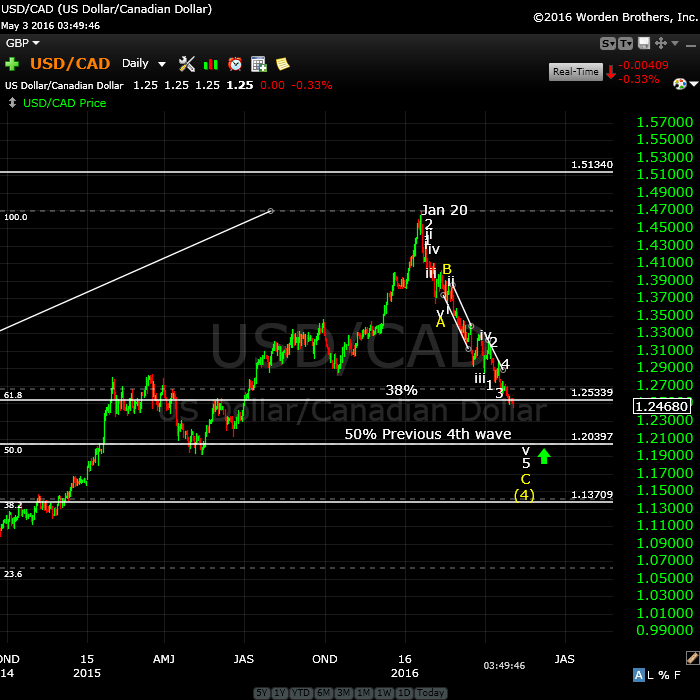
Update May 3: Above is the daily chart of USDCAD. I have been following this for some time, and called the bottom of the third wave, expecting a retrace (although unsure as to how deep it would be).
The larger pattern is an ABC corrective wave, but the C wave is in 5 waves. We are completing the 5th wave of this pattern (an ending diagonal), which has reached the 38% retrace level, but is stretching to the previous 4th wave level. I expect it to get there. It’s also the 50% retrace level.
Once it turns and heads up, it will head up in a fifth wave to a new high, a very lucrative trade. The euro, Australian dollar, dollar, and Canadian dollar are all at similar major inflection points.

UPDATED MAY 2: A Major Inflection Point: Here’s the daily chart of EURUSD showing the major corrective pattern from the low of March, 2104. The triangle configuration hinted at with the converging trendlines is no longer, so I predict we’re going to hit the 38% retrace level, that I’ve been suggesting for the past 8 months or so is my preferred turning point.
It should turn in tandem with the US equities.
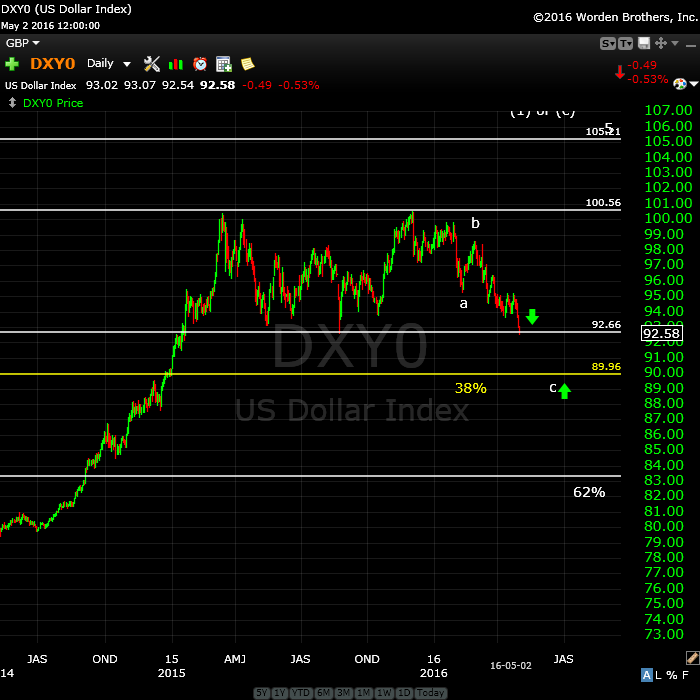
Updated May 3: The US dollar (this is a 3 day chart) should do the same thing but in the opposite direction (up). I’m up in the air right now about the structure of this entire wave. Although in 5 waves, it looks more corrective to me than motive.
Short term, however, we’re heading down to the 38% retrace level (which would be the expected place to end this correction).
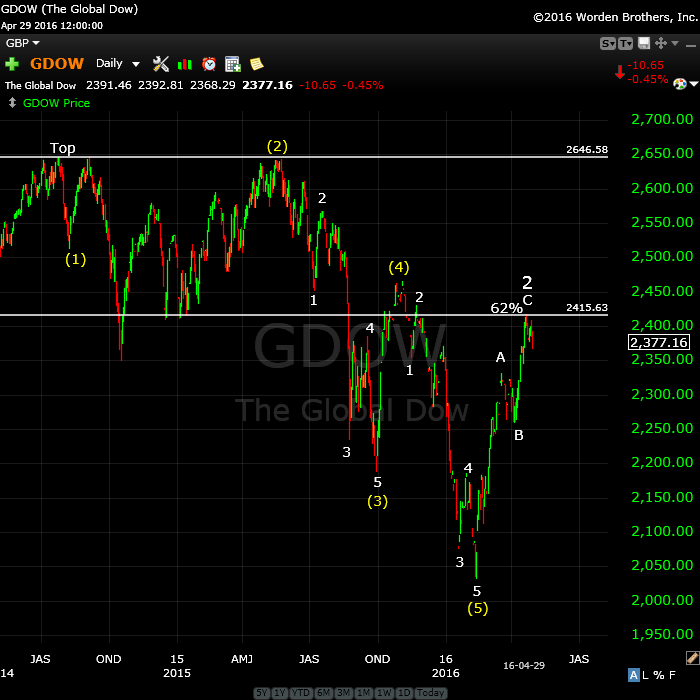
Above is the 4 hour chart of GDOW (Global DOW) showing the current count. This is the BIG STORY for me this week. I’ve completely re-labelled this chart.
As I started to think about it in relation to the US indices, something seemed “off.” So I did a bit of sleuthing and found out that the wave (2) yellow high did not actually reach the previous high (marked “Top”). Therefore, the first wave down is the one heading south from Top. The short story is that we’ve done a complete set of 5 waves down. The new trend is officially confirmed at DOWN. The second wave we’re in now has retraced exactly 62%.
Bottom line: All the indices are lining up for a HUGE third wave down. More confirmation!
Major international indices like the GDOW and NYSE are where I do for the overall count. I can be much more committed (as I was on the SP500 first wave down, while everyone was questioning it) when I see a count on these two indices which is clear.
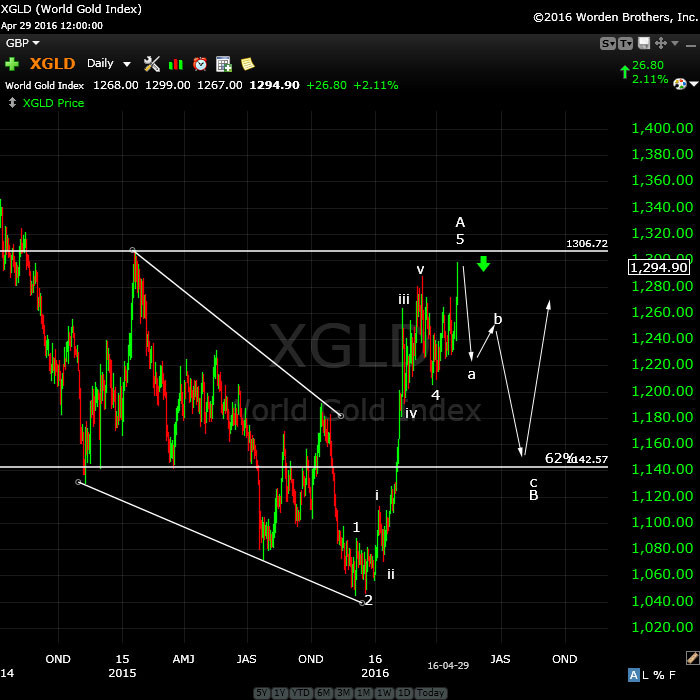
Above is the daily chart of XGLD (gold). I had said the movement of this asset is a no brainer. Note to self: NEVER SAY THAT!
We had a bit of a fake-out late in the week, as XGLD went to a new high, but not beyond the previous 4th wave high, which is the ultimate target. Looking closer as the subwaves (which I’ve now marked), you’ll see that there are 5 waves within the motive set (an over-arching 5 waves) of waves up. The bottom line is that we should turn down here. If we go above the previous fourth (horizontal line) then I’m obviously wrong and something else is going on.
There are two possible targets. The target on the low side is the 62% retracement level, somewhere close to 1142.
________________________
First Wave Down – What to Watch For
This weekend we’re dangerously close to a top of a second wave (in the fifth of the fifth, with an ending diagonal pattern).
What we’re looking for to confirm a turn is a motive wave down in 5 waves.
Because we have an ending diagonal, the first wave will likely drop to the previous fourth, which is also the beginning of the ending diagonal pattern (~2022). After that, we should get a second wave that will retrace in 3 waves about 62%. That’s the preferred EW entry point. So don’t feel you have to rush in. There’ll be a much better opportunity at the second wave level than at the top and the risk is substantially reduced.
__________________________
History: The 1929 crash
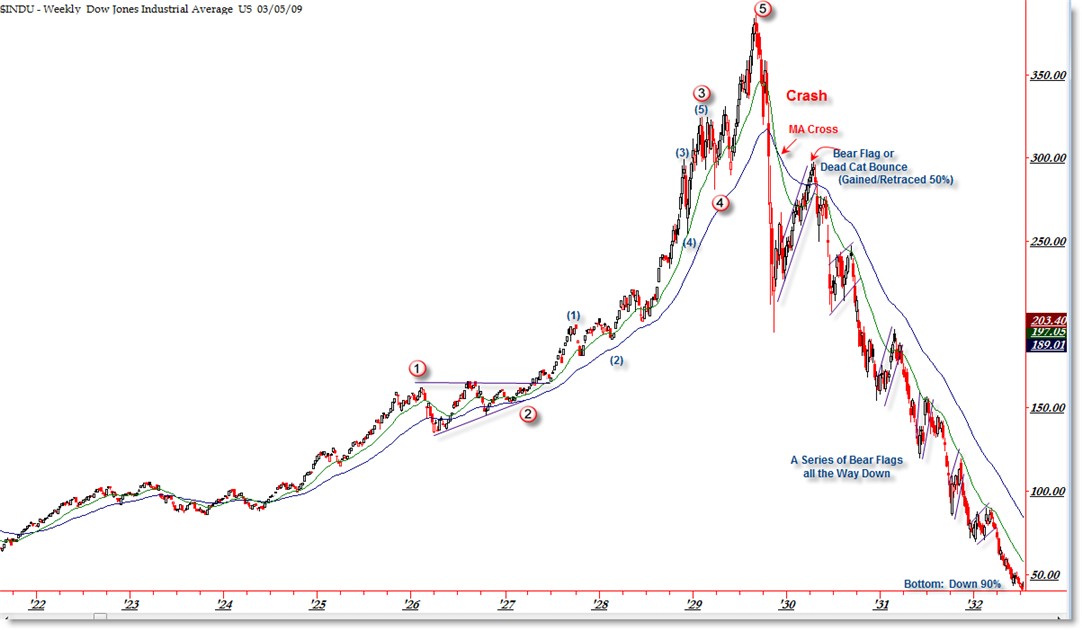
I think it’s important to look at 1929 and the wave structure (above and below), which was the same as 2007—to a point. I will show the 2007 crash below in the “What If” section.
The wave structure of the 1929 crash was in 3 waves overall. There were 5 waves down from the top (the A wave) and then a very large B wave retrace. The final C wave down was a stair-step affair and lasted over 2 years.
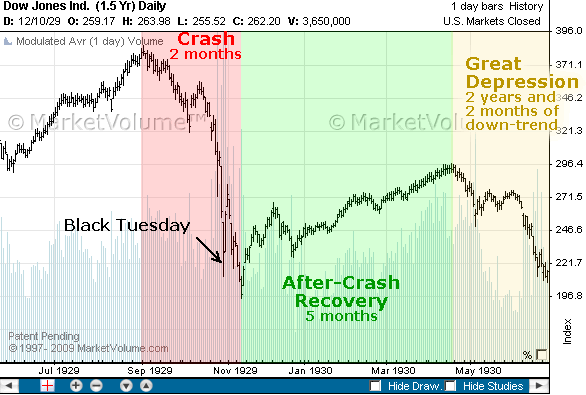
Let’s look a little close at the timing of the 1929 crash because the similarities to today are uncanny.
The market peaked on September 3, 1929 and then it took 2 months for the crash to actually happen (to reach the bottom of wave 5 of the A wave). The larger crash which we always hear about began on October 23, 1929. Then there was that large B wave, which lasted 5 and a half months and finally (which I explain a little further in the cycles section below), the C wave which went on for more than 2 years. This might be the scenario we’re looking at going forward.




maybe NFP will give us the push we need to jump start this move up we need. it has done it plenty of other times when markets were bearish going in. just like may 8/2015. 1 year ago. i remember it well because i had short positions going in that were crushed with a 30 point NFP pop . https://www.tradingview.com/chart/?symbol=SPY
Good info. Scott, thanks!
Peter-
With the pending Gap down (and potential move back up), does this now look like the 4th wave might be completed today and the fifth wave starting? What do we need to look for as for that kind of confirmation?
And more specifically would there be anything that is different than the 5 waves up that you were looking at yesterday in the wave d of the triangle scenario.
so we traded near the low of yesterday – which is usually a “continuation” pattern – meaning the market intended to go lower.
on the open it is will be outside the lower bollinger band on the daily time frame, and the 50 day moving average. it would “seem” a good place to have a shake out “spike” low and reversal – although it seems all to “clean” and managed. it would be good to see some panic selling a “spike” in the vix…..so it may come monday rather than today?? or we could very well be in wave 3 down now??? my hunch is that we are…
sorry, i was indicating the spx in the above comment……
So much for the triangle. ES has dropped lower and looks to be at the previous 4th wave low. So, we’ll end up doing a simple 5 waves up by the looks of it. We’ll have to see where we open but that looks to be the case.
Comment added to the top of the post. I’ll add a chart of SPX after the open.
I added a daily chart of ES so you can see where we are.
ES started up before the open but is in 3 waves. SPX hasn’t dropped far enough at the open, so I would expect both ES and SPX to drop to confirm the full fourth wave (to the previous 4th).
Look at the indices take off! SPX is still in a triangle configuration, but ES is not, which is OK. We’ll have to see if this bottom in SPX holds. So far, still 3 waves up.
Actually, ES is not quite at the previous 4th wave. I can still place it in a triangle. It’s shy about 5 points. So perhaps that’s still the game. Hard to say until we see whether we can put together a small set of waves to the upside or not.
fully confused now…… So from the daily we are not looking at a wave 5 but for a (2) C around 2160?
The short term is still unclear so I can see why you’re confused. We’re still looking for a “5th wave” within the context of the C wave up. The point I was trying to make is that there is absolutely no way this wave up from Feb 11 is a motive wave, and that’s likely to have confused you.
Let’s wait till the weekend and I’ll clear it up for you. I want to see where we end up today, because we’re in no man’s land at the moment. I don’t know if we have a traditional 4th wave or a triangle or what this is. If we double bottom in SP here, I would still opt for a triangle. If we go a little lower, then we should get five waves up.
The important thing is that all these waves down are a mess (all overlapping). There’s nothing motive there at all, so the medium term direction is up. We just need to find a bottom.
I cringe when I say this, but it would be nice to have a central banker around … just for one more wave up … lol.
whitemare,
I changed the chart at the top of the post. Sorry to have confused you. This chart is of the SPX so you can see what we’re looking at and hopefully, what the short term dilemma is.
Very little has changed from yesterday. We’re all but stopped.
hmmm…it looks like the underlying is being sold – alongside the hedge…?? methinks this is ‘un’good….
SPX, NQ, and ES look to me like ending diagonal, which would need one more wave down to bottom.
I just posted a chart of ES showing the potential ending diagonal on this wave.
We indeed appear to be topping. So, if this wave continues down, it should go to a slight new low (a throw-over, below the lower trendline) and will likely complete the fourth wave down. I would expect it to take through Sunday to do that. It should come down in three waves. That would give us a bottom on Monday morning, and a shot at 5 waves up to a top after that (the long-awaited fifth wave).
The triangle would no longer be an option.
lol – peter, you see up, and i see down,,,,now you see down – and i see up!!! i think i will commit myself to a sanatorium….. i see a potential ‘little’ up to 2066/67???
The target on ES would be ~2028, but we’ll likely go lower. It would end with a dramatic reversal to the upside.
lol, ok – i will politely agree to disagree….earlier in the week, i was commenting on the bottom of the bollinger band at 2040. we hit that today at 2039. as well we bounce off the 50 day moving average.
it is possible we see an anemic retrace toward the middle of the bollinger band to retest that area…..?? i am unsure?? but we will need some panic selling and a spike in the vix to get so far below the lower bollinger band on the daily………i hope we spike sell, but it may be path of least resistance up…
While /ES hit my 2039 target from last Friday and early this week’s 2030 target, looking at the ending diagonal, I don’t think we’re out of the woods yet. Maybe Tuesday or Wed we’ll hit a lower low.
Peter,
could I propose to retrace your Ending diagonal so that the low on the 4th May would be wave 3 and the high on the 5th May would be wave 4.
In this case yesterday’s low was the “over-throw” of the wave 5 in the morning with the “dramatic reversal” reversal in the afternoon.
This “dramatic” wave up from yesterday low looks motive ?
Well, you could, but it would be wrong, quite obviously.
Peter,
could you explain why is it wrong, please ?
The highs of 28th of April, 2nd and 5th of May are on the same line.
The lows of the 29th of April and the 4th of May trace the line that was tested several times later before the “throw-over”.
I just want to understand.
Dimitri,
Watch the video, which is just up.
btw, you can always post a chart in the forum. I get instant notification and will respond. It’s often easier to understand than text.
Dimitri,
Let me add a couple of points that are not in the video. I can see how you might think the shorter version might be the ending diagonal.
The problem with it in SPX is that your 5th wave is in 5 waves. The end wave has to be in 3 waves. So your fifth is more likely the end wave of the double zig zag (my 3rd wave). The other important point is that your version ended in the middle of nowhere. In other words, either this fourth wave is a triangle, or it’s going down to the previous fourth. I’ve never seen a fourth wave end in the “middle of nowhere.”
I’m expecting the end wave to come to end at the previous 4th wave, or slightly below it, which is the typical (or almost always) end point for a fourth wave. This is more likely a large B wave, as the entire wave up from Feb 11 is a corrective wave. However, you’d expect a B wave to drop to either a previous 4th or 38%.
One more thing. In an ending diagonal, the third wave is almost always a complex wave.
You’re getting fairly sophisticated in terms of EW so maybe these finer points will help with what I see as the difference. Hope so. Keep learning. It never stops with EW.
Thanks a lot, Peter.
It’s really more complicated than I thought.
After knowing the difference between 3’s and 5’s, is really about knowing the patterns, cause they always play out more or less the same each time. If you know what pattern you’re in, you can trade it profitably. Sometimes the market is between patterns and that’s a “crap shoot,” but when the market shows you the pattern, then you know exactly where you are and what’s probably going to happen next.
Dimitri,
Apologies on this comment. They are not more complicated than you thought. I was reading way too much into this count. I had to go back to the book on this one. I’m so used to throw-overs, but they aren’t necessary. So your analysis was correct.
Thanks Peter,
I appreciate your openness.
Monday, May 9, is Mercury Inferior Conjunction (MIC); and moon rise is about time market opens at 9:30 AM in NYC. Usually MIC and a day or two after are days when bear is in charge.
valley,
i like it – that’s my b-day!! so big crash come monday??? personally, i think the top is in, and i do think we are witnessing an overall market “cardiac” arrest. so in that respect, [for me] this is a very dangerous market – which is why “anemic” is the only word that seems to describe price action………stocks are sitting on a ‘breakaway’ gap lower is how i read the tea leaves… :-))
Hi Valley, I sold out of longs right at the end of the day. I decided not to use options , instead I am using 3x ETF. Just a little concerned with the time decay on the options. Hoping to switch over to options first thing Monday morning with the possibility of a pop up in the markets. Over all, I have to admit I was perplexed with the markets this week. Valley, I am using a graph, that looks like a fractal. The fractal looking graph was originated by a fellow who passed a way many years ago. The intent was NOT for the stock market at all. It’s original purpose was for a biorymn for the world as a whole. I back tested all the way to Aug 24/2015. The graph peaked August 14 before the severe correction . At this time. We peaked late today with the fractal graph. The graph today looks almost exact as it was back in Aug. If this is correct, we should have a severe correction within the next 10 days. Who knows for sure. We will have to wait to see if I am correct or not. Valley, that is just one of several indicators that I use. As you are well aware of, ew, technicals you can throw them out the door due to mercury rectrograde. All the best
If I am correct and that is a very big Maybe, we should bottom around the third week of May. May 20 – 25th. Than a very large rise in the markets afterwards. But let’s take it one step at time, let’s see if we do indeed get this severe correction first. All the best every one
Thanks for sharing Dave,
Can you tell us more about the fractal or show something in the forum please?
We do have a big astrological crossroad on May 9 or 10.
Nice weekend to all.
Sorry Dave, I meant to say the graph in relation to the fractal.
John, this is strictly an experiment. Nothing more. After mercury rect is over with, I would like to converse with Valley in private on this matter before giving out graphs on this blog. My greatest fear, is that newbies will throw all their money using these graphs and getting burned. Let’s fist see if I am correct first, using this fractal graph for the next two weeks. The only reason I brought this subject up, is Valley asked me what indicators I use. John I hope you understand, I do not want any neg karma if this is going to be misused. All the best John
Venus combust the sun 5/8/2016 . will hide directly behind the sun 6.6.2016 no guidance. https://www.youtube.com/watch?v=sHd1n7m11Xc&feature=youtu.be
Thanks Dave,
I do understand your point of view and I would appreciate if you can make your comments in the comming weeks.
I know the power when Mercury is retograde and how it can fool everybody.
I already mentioned Mecury retograde May 2010 was also in the sign of Taurus like it is now and the chart pattern looks the same. I m also still watching the chart pattern correlation 2008 as it was correct all most on the day in Januari and bullseye in Februari but after that the synchronisity disappeard but this month can be verry interesting and it also has a possibility to pick up again.
So this week will be very interesting just like future dates May 19,21( retrace or decline) ?
Cheers.
New post: https://worldcyclesinstitute.com/the-end-is-nigh/
This website is for educational purposes relating to Elliott Wave, natural cycles, and the Quantum Revolution (Great Awakening). I welcome questions or comments about any of these subjects. Due to a heavy schedule, I may not have the time to answer questions that relate to my area of expertise.
I reserve the right to remove any comment that is deemed negative, is unhelpful, or off-topic. Such comments may be removed.
Want to comment? You need to be logged in to comment. You can register here.