Update Friday, May 6, ~ At the close
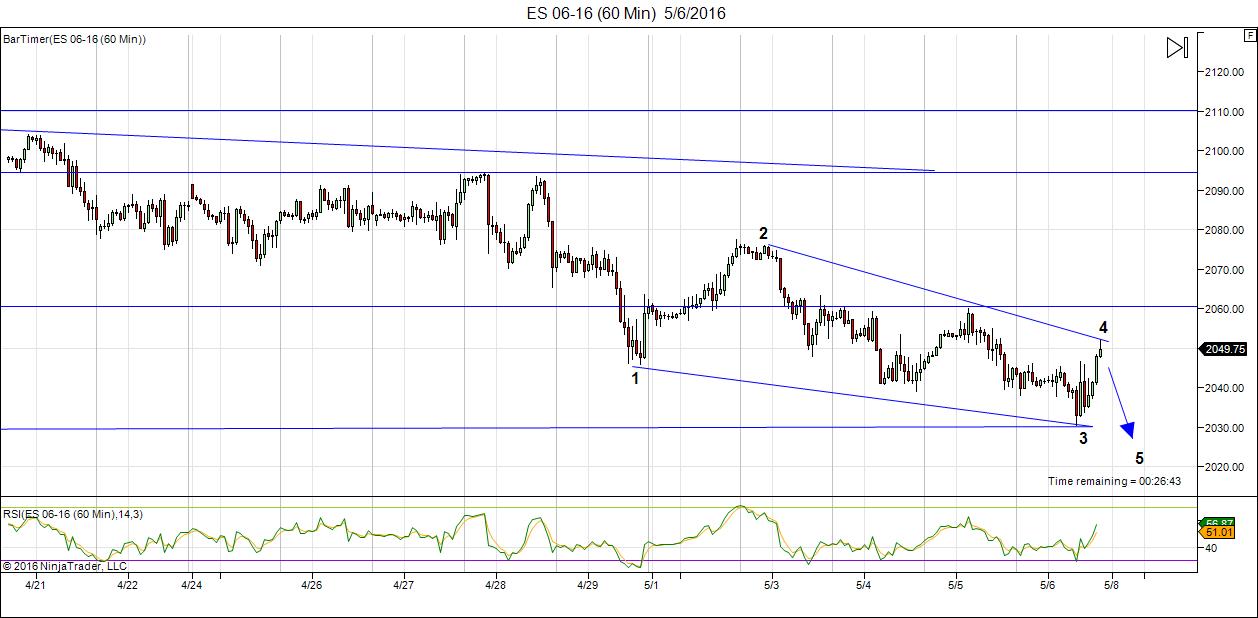
Above is the 60 minute chart of ES showing what looks like an ending diagonal. If so, we’ll see one more wave down. The wave up today is in three waves, so it should come down. I’ve been able to count 5 waves in its C wave.

Above is a 1o minute chart of SPX just before market close (4PM EST) so you can see the ending diagonal pattern a bit better. The waves up today were in 3 waves (you can see the abc configuration). Waves in 3 always retrace. So we need to get to a new low.
An ending diagonal drops to a throw-over wave (it should exceed the lower trendline). In this case, our target is 2033 for SPX. Ending diagonals are the final waves in a sequence. It will end in a dramatic reversal and the first wave up will go to the beginning of the ending diagonal pattern (in this case, about 2083).
The larger wave down from the top is overlapping. So this is a corrective wave down. The bottom line is that the direction is still up. We’re looking for a bottom for this wave. It looks like we’re going to finish this fourth wave. I suspect the wave down will last through Sunday, which means we may bottom Monday morning.
A full fourth wave ending at SPX 2033 or a bit lower would suggest a fifth wave up in 5 waves.
USDCAD and EURUSD are also in fourth waves now, consistent with that the equities are doing. USDCAD should now turn down and EURUSD up.
___________________________
Original Post (May 2): Not much has changed in the past week. We’re still targeting the previous top of this large degree second wave, getting ready to topple over into a the largest third wave in history.
However, Friday’s action in the US equities markets, and the reaction they got on the blog, have pushed me this weekend to concentrate on some Elliottwave basics—the really basic—the difference between corrective and motive waves.
There are not a lot of rules in Mr. Elliott’s Principle. There are quite a few guidelines, but the hard rules are few and CAN’T be broken. If you learn them and stick with them, you’ll seldom go wrong. And yet I see people breaking them all the time … over and over again.
These are the hard rules for impulsive (motive) waves
- An impulse always subdivides into five waves.
- Wave one always subdivides into an impulse.
- Wave 3 always subdivides into an impulse.
- Wait five always subdivides into an impulse or a diagonal.
Today’s video concentrates on the most recent wave up and pulls it apart for you so that you know what I look for in my analysis and where most people go wrong.
If you’ve been with me for any length of time, you know my mantra: “Trade what you see, not what you think.”
Trading what you think is going to happen will get you in lots and lots of trouble and lose you lots and lots of money. Trust me on that one. I made that mistake way back when, too.
Finally, be patient. The wave pattern will end when it’s good and ready. It will turn over into a series of huge, motive waves down. You can see the size of the waves is already threatening to increase. You ain’t seen nothin’ yet!
From the Elliott Wave Principle: “Third waves are wonders to behold. They are strong and broad, and the trend at this point is unmistakable. Third ways usually generate the greatest volume and price movement, and are most often the extended wave in a series. Virtually all stocks participate in third waves. They also produce the most valuable clues to the wave count as it unfolds.”
Preliminary Targets (at 2.618 X the length of the first wave down)
- SPX: 1405
- DOW: 10,460
- NDX: 2370
All the Same Market. I’ve been mentioning for months now that the entire market is moving as one entity, the “all the same market” scenario, a phrase that Robert Prechter coined many years ago, when he projected the upcoming crash.
One of the frustrating elements though, is that when the market turns, it takes longer than usual to do so, because the entire world (in terms of the major indices, and by extension, the mood of the masses) is turning at the same time.
The entire world is moving to the tune of debt and the deleveraging that has to happen. All bubbles burst eventually and this one is one that will go down in history, because it’s the largest debt bubble in history.
The direction of US equities is still up. On Thursday/Friday (28/29), we had a cycle turn, but it wasn’t the one we were waiting for. The market “faked us out.”) However, there are no more major turns possible. This is the fourth of the fifth and the next major turn will be down.
______________________________
Here’s a video overview of the market for Monday, May 2, 2016:
Market Report for May 2, 2016 |
_______________________________
The Charts Going into Monday
Note that there aren’t huge changes from last weekend. We’re simply progressing in this final wave and are virtually at the final target. I’ll start with ES to give you an idea of where we left off at the end of the day on Friday and then we’ll take a look at the bigger picture. Everything is pointing to the same end point and a major turn.
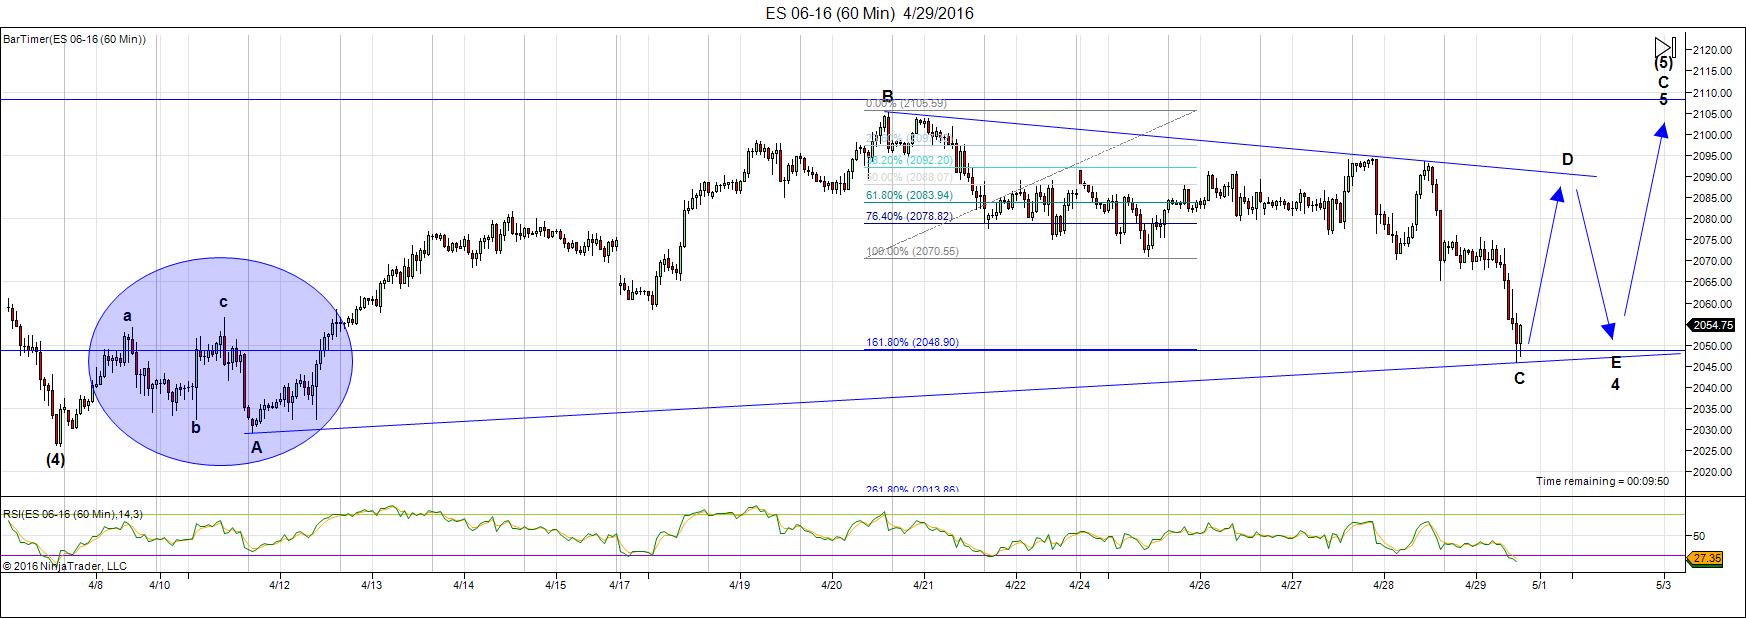
Above is the 60 minute chart of ES (emini SPX futures). The fourth wave triangle I’ve labelled here (after Friday’s action) completely resolves the issue I was having with the area in the blue circle). While I had originally labelled it a 1-2, 1-2 motive sequence and predicted a fifth wave up, I had mentioned that I had reservations because the c wave up in that circle was in three waves. However, you can’t have a three wave sequence within a motive wave. Rather, it suggests a triangle (either a 4th wave triangle or an ending diagonal). Well, we have a triangle, finally! This is the most likely scenario going forward.
I say it’s the most likely partly due to the fact that the SPX has a shorter amount of time to get to the top, the futures, of course, go round the clock. Often you’ll see a triangle in futures as cash indices take a more direct route to the same end. So, we may not see a triangle play out in the cash indices, even though that’s how I have them labelled at the moment.
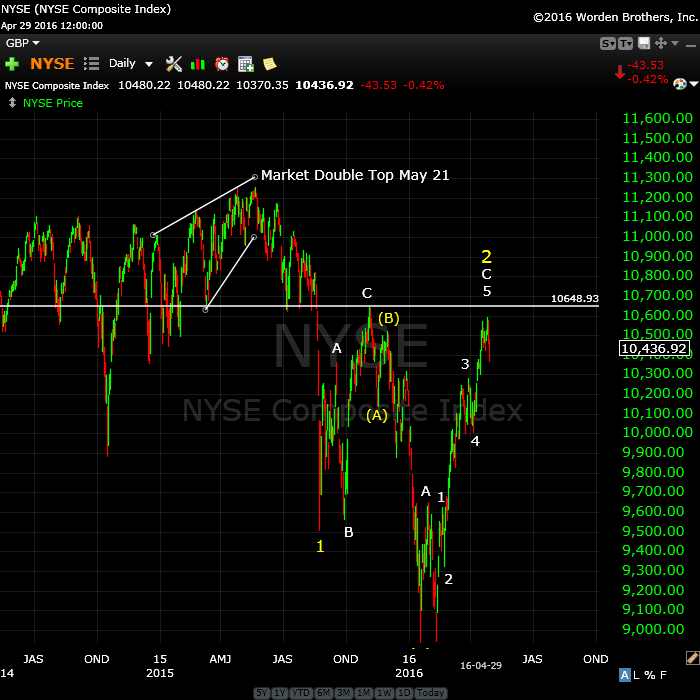
Above is the daily chart of NYSE. I keep a fairly close eye on this index as it’s by far the largest in the world (in terms on capitalization). We are at the top of an ABC corrective wave (a bit more to go). I’m expecting a termination of this 2nd wave up at ~10648. This would “correct” the truncation and end in a double-pronged second wave. Third wave down should drop to around 6100.
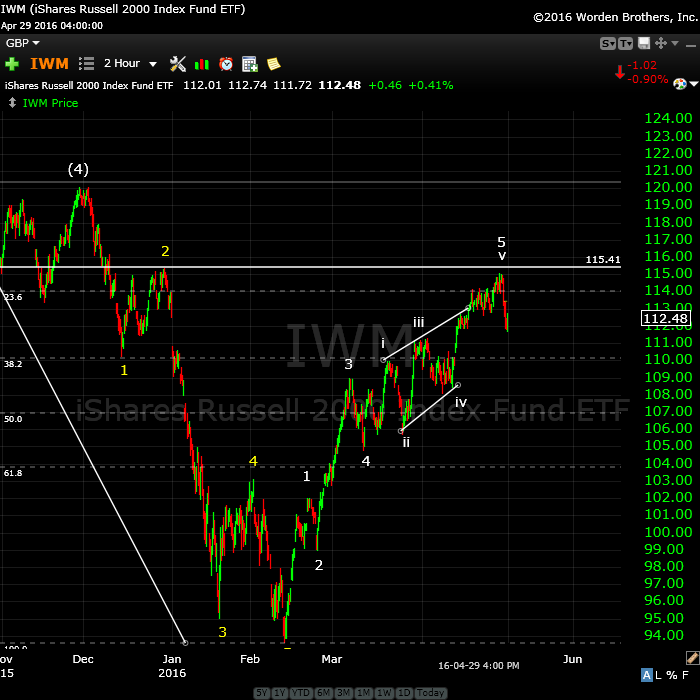
Above is a two hour chart of IWM (Russell 2000). It’s traced out a very obvious ending diagonal and just has the throw-over to complete. This is a small caps stock base and should give a pretty good indication of what’s happening overall. It has a little more of the throw-over to do and may end up even with the top of the yellow 2 wave.
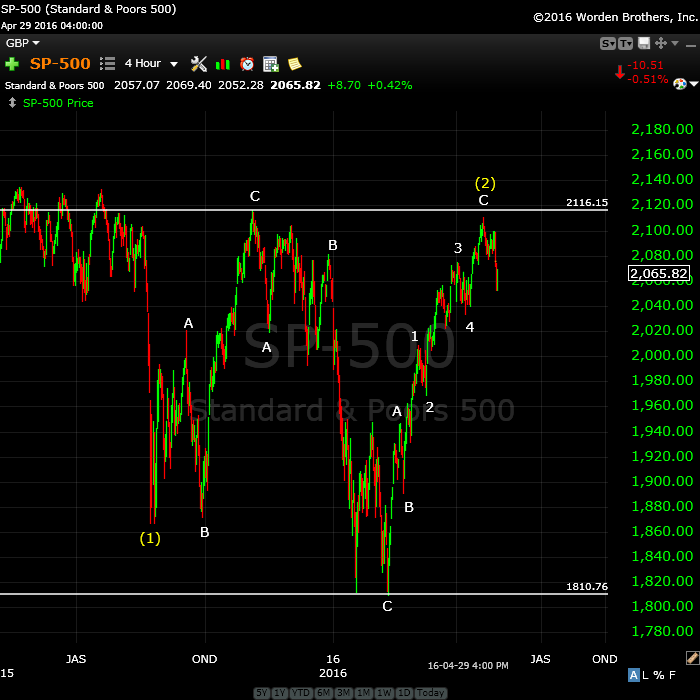
Above is the 4 hour chart of the SP500, showing the double 2nd wave top waiting to finish tracing out. This would negate the “truncation” and create a spectacular EW textbook set up for a huge third wave down.
Second waves have few restrictions. The key rule is that they can not retrace to the previous top. They should retrace between 62 and 100% (but cannot hit the 100% retrace level). I expect us to reach 2116 before a turn down.
It’s typical in a bear market for second waves to trace out a double prong (an ABC wave down in this case and a 5 wave structure up). The five wave structure, however, is not motive (subwaves won’t necessarily all be in “legal” 5 wave motive configurations). I have therefore labelled this wave more correctly, showing that it is indeed a 3 wave corrective wave, with the C wave sporting 5 waves (more on this in the video).
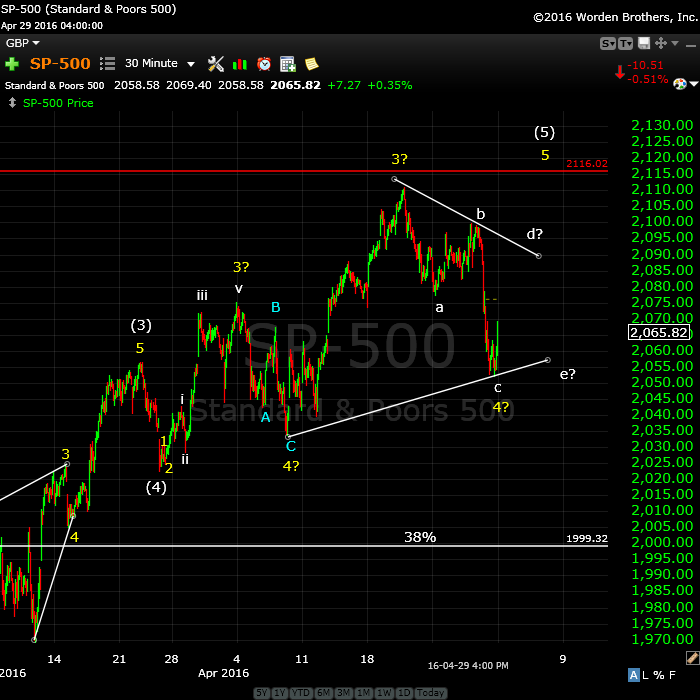
Above is the 15 minute chart of the SP500, so I can focus in on the wave structure of this final wave up. On Thursday/Friday, we got a C leg drop in what appears to be a 4th wave of some type. The C wave could go lower still. At its present level, it works best as a triangle. However, if it drops further, we’ll label it a large fourth wave. It can easily drop to the previous 4th (yellow to the left) or even the 38% retrace level (from the bottom at Feb 11) before ruffling my feathers.
The video goes over why this is a corrective wave. We’re still waiting for it to hit the previous high at 2116. The chart is showing multiple counts as I’m not sure where this fourth wave will eventually end up. We will know more by Monday.
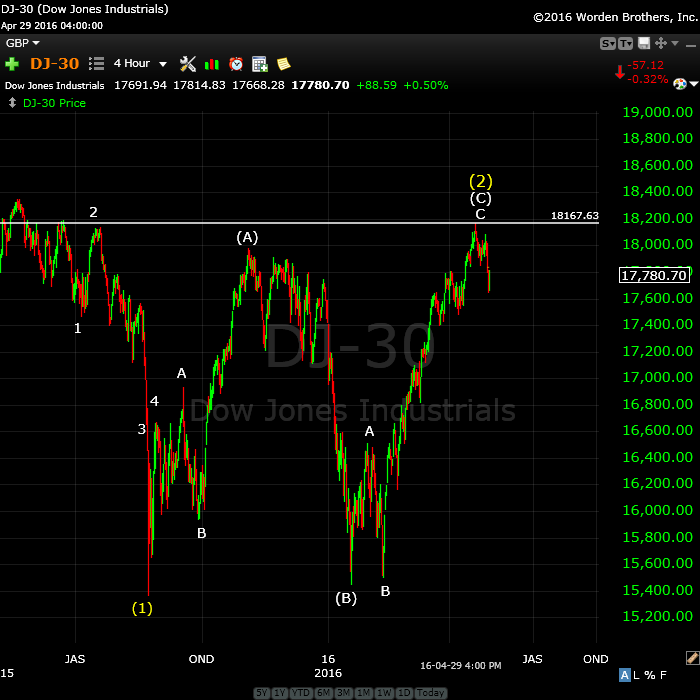
Above is the 4 hour chart of the DOW. It’s similar to all the other indices, as it should be. I predicted we’d reach the previous 2nd wave high and that in fact is what we’re done. Look for a double top with the most recent high before a turn down. The reason I show this index is that I’m always looking to other indexes for confirmation of a move. You’ll note that the DOW did not come down to a new low in February, so this puts it clearly in a corrective abc wave up. As all the indices move in tandem, this supports the fact that SPX is also in a corrective wave.
Note that just about everywhere I look at individual stocks, we’re in huge second and fourth waves spikes. This whole market is about to turn.
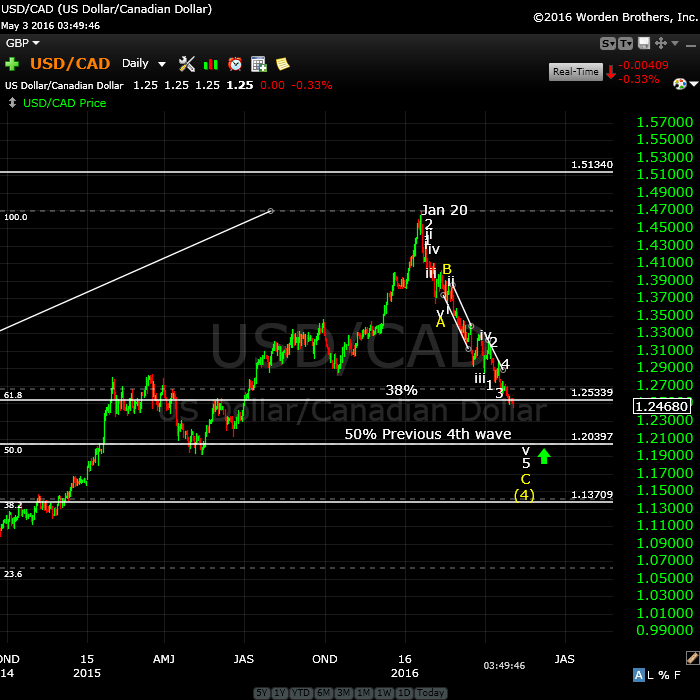
Update May 3: Above is the daily chart of USDCAD. I have been following this for some time, and called the bottom of the third wave, expecting a retrace (although unsure as to how deep it would be).
The larger pattern is an ABC corrective wave, but the C wave is in 5 waves. We are completing the 5th wave of this pattern (an ending diagonal), which has reached the 38% retrace level, but is stretching to the previous 4th wave level. I expect it to get there. It’s also the 50% retrace level.
Once it turns and heads up, it will head up in a fifth wave to a new high, a very lucrative trade. The euro, Australian dollar, dollar, and Canadian dollar are all at similar major inflection points.

UPDATED MAY 2: A Major Inflection Point: Here’s the daily chart of EURUSD showing the major corrective pattern from the low of March, 2104. The triangle configuration hinted at with the converging trendlines is no longer, so I predict we’re going to hit the 38% retrace level, that I’ve been suggesting for the past 8 months or so is my preferred turning point.
It should turn in tandem with the US equities.
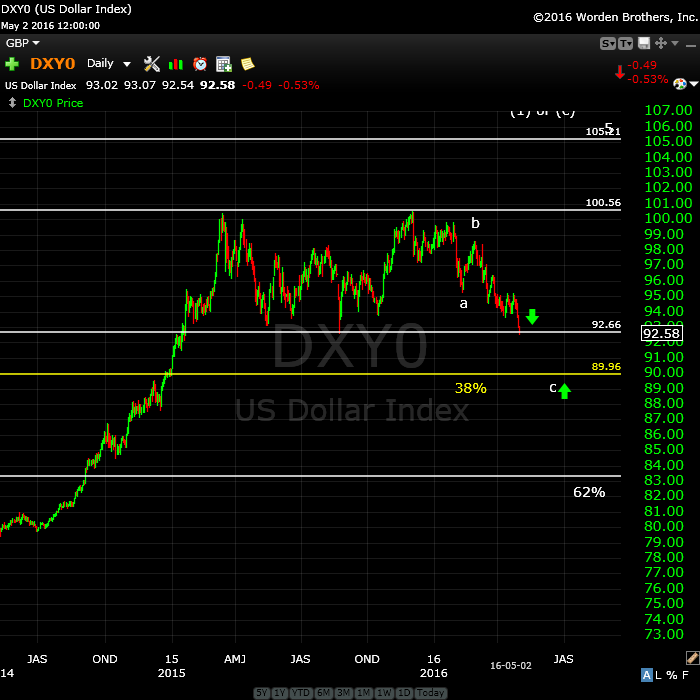
Updated May 3: The US dollar (this is a 3 day chart) should do the same thing but in the opposite direction (up). I’m up in the air right now about the structure of this entire wave. Although in 5 waves, it looks more corrective to me than motive.
Short term, however, we’re heading down to the 38% retrace level (which would be the expected place to end this correction).
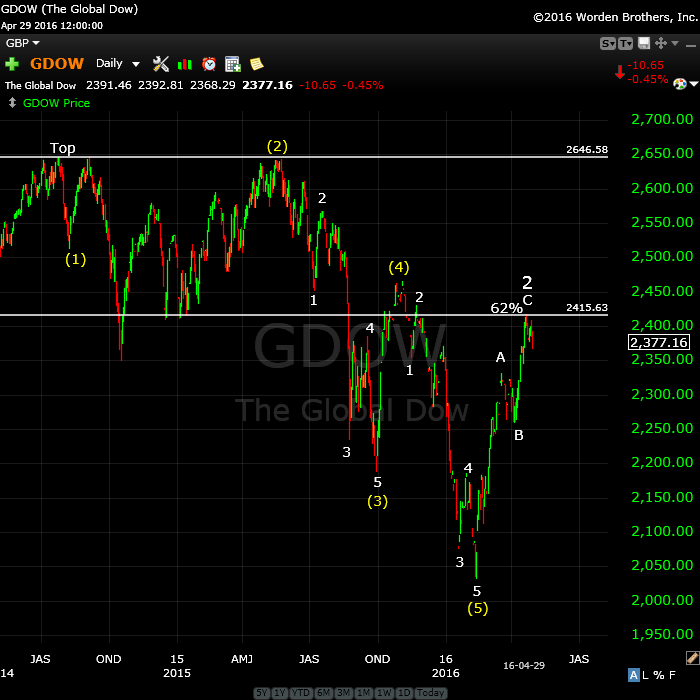
Above is the 4 hour chart of GDOW (Global DOW) showing the current count. This is the BIG STORY for me this week. I’ve completely re-labelled this chart.
As I started to think about it in relation to the US indices, something seemed “off.” So I did a bit of sleuthing and found out that the wave (2) yellow high did not actually reach the previous high (marked “Top”). Therefore, the first wave down is the one heading south from Top. The short story is that we’ve done a complete set of 5 waves down. The new trend is officially confirmed at DOWN. The second wave we’re in now has retraced exactly 62%.
Bottom line: All the indices are lining up for a HUGE third wave down. More confirmation!
Major international indices like the GDOW and NYSE are where I do for the overall count. I can be much more committed (as I was on the SP500 first wave down, while everyone was questioning it) when I see a count on these two indices which is clear.
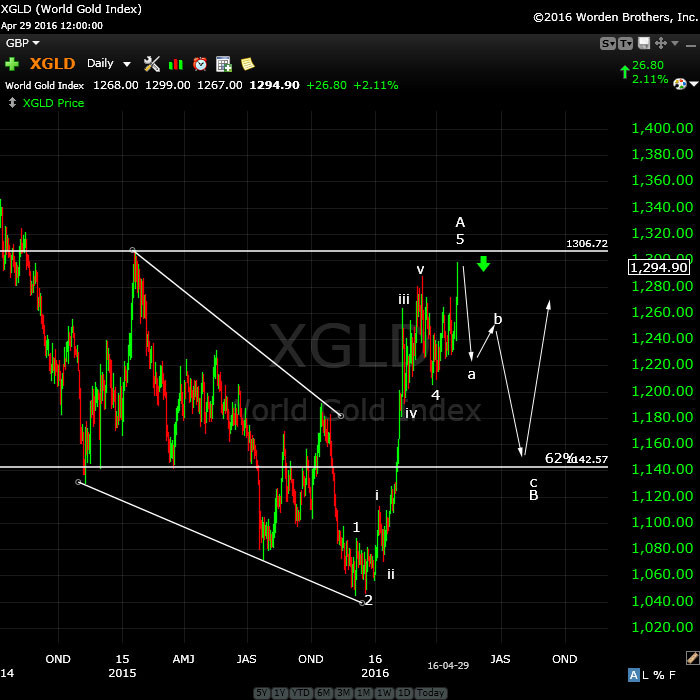
Above is the daily chart of XGLD (gold). I had said the movement of this asset is a no brainer. Note to self: NEVER SAY THAT!
We had a bit of a fake-out late in the week, as XGLD went to a new high, but not beyond the previous 4th wave high, which is the ultimate target. Looking closer as the subwaves (which I’ve now marked), you’ll see that there are 5 waves within the motive set (an over-arching 5 waves) of waves up. The bottom line is that we should turn down here. If we go above the previous fourth (horizontal line) then I’m obviously wrong and something else is going on.
There are two possible targets. The target on the low side is the 62% retracement level, somewhere close to 1142.
________________________
First Wave Down – What to Watch For
This weekend we’re dangerously close to a top of a second wave (in the fifth of the fifth, with an ending diagonal pattern).
What we’re looking for to confirm a turn is a motive wave down in 5 waves.
Because we have an ending diagonal, the first wave will likely drop to the previous fourth, which is also the beginning of the ending diagonal pattern (~2022). After that, we should get a second wave that will retrace in 3 waves about 62%. That’s the preferred EW entry point. So don’t feel you have to rush in. There’ll be a much better opportunity at the second wave level than at the top and the risk is substantially reduced.
__________________________
History: The 1929 crash
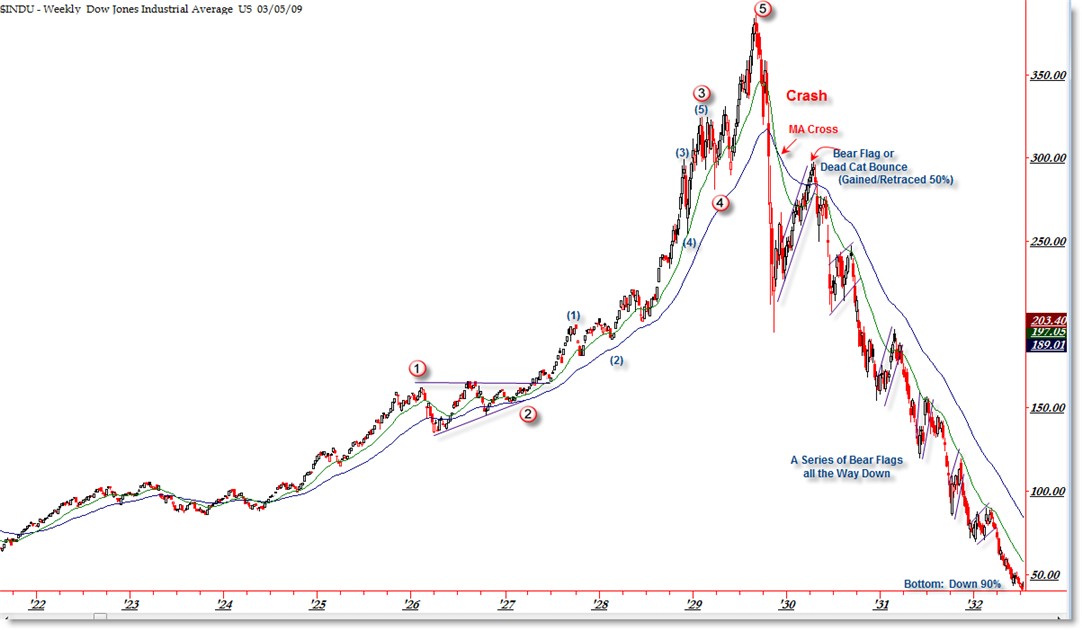
I think it’s important to look at 1929 and the wave structure (above and below), which was the same as 2007—to a point. I will show the 2007 crash below in the “What If” section.
The wave structure of the 1929 crash was in 3 waves overall. There were 5 waves down from the top (the A wave) and then a very large B wave retrace. The final C wave down was a stair-step affair and lasted over 2 years.
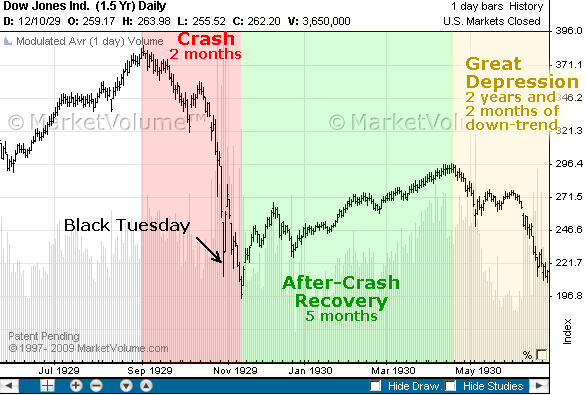
Let’s look a little close at the timing of the 1929 crash because the similarities to today are uncanny.
The market peaked on September 3, 1929 and then it took 2 months for the crash to actually happen (to reach the bottom of wave 5 of the A wave). The larger crash which we always hear about began on October 23, 1929. Then there was that large B wave, which lasted 5 and a half months and finally (which I explain a little further in the cycles section below), the C wave which went on for more than 2 years. This might be the scenario we’re looking at going forward.




Thanks, Well presented ….Nick
Peter,
Good morning, got a couple of questions for short term, 1. if a triangle, how far up does the s and p need to move from the 2065 close to lesson the odds of another low creating a 4th and removing the triangle, and 2- how many days SHOULD it take to reach 2116? Enjoyed the video this Sunday morning.
I can’t answer the second question. Right now, the wave up is in 3 waves and at the previous 4th wave high. This is the spot at which it’s likely to head down. If it completes 5 waves up and reaches above this level, it lessons the likelihood that it will head back down, but doesn’t remove it.
Honestly, right now it could go either way.
Peter,
That is what I like about you. You are straight forward and honest.
Admit when you are not sure up or down as above and stick your neck out when you are sure.
You can surely look forward to my subscription soon.
Vince
Thanks, Vincent. Appreciate the kind thoughts.
Thanks, Peter. I look forward to your videos (I think there was a segment that repeated this week) and your blog posts every week.
You’re right, Mike. Thanks for the head’s up. I’ll go fix.
I’ve revised the video so there’s no repeat. Sometimes I spend so much time of the work, I end up running through the technical mounting process without doing the checks I should. I always appreciate knowing when there’s a problem.
Hi Peter
Could you please share with us Andy’s next changeOfTend day ?
Thanks!
goldbug2009,
My agreement with Andy only allowed me to share 2-3 dates, so I’m out of dates at the moment. I can tell you that there are two really major dates in May when everything turns. Best I can do. Otherwise, his service is available and it’s excellent—highly accurate.
I subscribed to Andy’s service per your recommendation. Thank you! I just received May and have the turn dates. How can you tell which ones are major dates?
Charlie,
Good for you! They’re the ones on the front cover. You’ll also see them in the spreadsheet and see how this next month, everything seems to turn at the same time (all the same market).
Thank you Peter for your wonderful insight and wisdom on these crazy markets..
Frank, you’re welcome.
Thanks, Peter Temple. Worldcyclesinstitute.com is a great site to learn elliot wave. Will be looking for 3s and 5s.
🙂
I went long Friday after the double bottom. 2/3 batches 3x etfs. Volume dried up on the double bottom, usually a safe time to buy. 1/3 batch will buy Monday morning if we re-test the bottom we had Friday. Sold my original short position from two weeks ago Friday. Break even with the spx, but lost slightly on the decay of the etfs. I agree with Valley for the near term scenario with the spx going to slightly new highs. From the may 9 – 12th I will be going aggressively short with options. As I believe we will see some strong selling as we had earlier on this year. Later on in May I will be going aggressively long, when every one will be shouting this is it. ( Market crash ) All the best every one.
Correction on the date I will be going short. May 6th with options for two weeks.
Best of luck every one.
Hi Dave,
I sold one of my spy calls 5/6 exp with profit, and have kept one into Tuesday. Will probably sell remaining call if we reach another one percent on the upside. Don’t want to be invested on New Moon Perigee combination on Friday, nor Mondays Mercury Inferior.
I agree Valley, with not being invested for not to much longer this week. I failed to get my last 1/3 batch this morning. I may sell one of my batches tomorrow if we get anther follow thru as we got today. Certainly no later than Thursday, than perhaps short. I will be dollar costing averaging into options Thursday thru Friday on the short side. All the best every one.
Thanks, Dave. PALS uses mostly lunars (phase, distance, declination), seasonals, and major planetary (mercury inferior and superior, venus same) although I am playing with lunar planetary (moon planet alignments). May I ask what your top one, two, three or more non technical assessment tools with regard to short term price moves? For example, one of my most useful is market tends to bottom four calendar days after maximum distance apogee, and peak at open on day of minimum distance perigee.
This Friday is perigee, which is why I am leaning toward neutral or short after Thursday’s close.
Thanks for all your contributions, Peter!
An important turn date coming is Monday May 9 right around trading open for SPX. Two major astronomical events, Jupiter going Direct and Mercury transit of Sun (happens roughly 13 times per century).
The Sun -Sat transit I mentioned last week maxes out probably Weds of this week and this could be the D wave high, to be followed by the E low and the wave 5 high on May 9…….. possible.
I’m expecting cash to do some sort of 2nd wave down off the open before heading back up again ..
SPX has arguably completed 5 waves up so here is where I’d expect a retrace. It’s also at about the 38% mark. 38% is important because if this is a triangle, that’s about where, after a retrace, the C wave might end up being 1.6 times the length of the A wave going up.
38% is typically close to a turn point for that reason, triangle or not, so it’s an important fib level to watch for a turn.
SPX hasn’t corrected much, and that’s a red flag for me. This is obviously going to be a very bumpy ride. We’re right at the top, a fairly evenly matched market, so day trade at your peril. If it’s a triangle, there aren’t much in the way of guidelines, so it can be all over the place. The waves will all be in 3’s. The places to trade are at the top and bottom trendlines, not in the middle.
I think SPX is at 38% now (2075) and at the top of 5 waves, so perhaps a larger drop here.
SPX should drop to somewhere around 2061. ES around 2055.
hmmm something non ew to ponder – so on 4/20 we extended outside the 2 standard deviation daily trading range [ie, bollinger band]. we touched the “middle” of the daily time frame bollinger band on thursday last week as support. [middle of band is currently 2075]. friday we broke below. today may 2, so far we have backtested the middle of band as resistance.
the lower end of the bollinger band currently at 2037.20. this may be a potential target????
The action so far seems consistent with a triangle in SPX (and even ES). This would then be the B wave down that we’re struggling to complete.
That obviously wasn’t the B wave … that’s still to come.
This should be the B wave finally, and will likely head down overnight.
I updated the EURUSD chart in the post (near the bottom) because it’s getting obvious to me that we’re going for the 38% retrace level, which is what I originally thought would happen … way back when …
Solarham.com shows k index has been elevated last 24 hours, currently at 6. K index is measure of geomagnetic instability and may correlate to market down turns.
I’ve shared some thoughts on ES tonight at the top of the post.
Waiting for the selling pressure to ease up to buy my last 1/3 batch for a couple of days. I will how ever sell out my position if we fall thru the 2042 2044 level. I will be going short with options rather than 3 x ETFS. Valley, I will respond to your question a little later on due to my on going projects. Let’s see if this trade works out first. All the best every one
I will be going short, no later than this Friday. I will be dollar cost averaging with three batches of options starting late Thursday. I am concerned with the world markets over the next 2 weeks. This time frame coming up will be a great time to load up to go long for new highs coming shortly. Mercury rectrograde period is notorious for giving lots of head fakes ,for both the bears and bulls.
Every time you have called for a rally, I have disagreed only to be wrong. So here I go again. The regular seasonals plus the presidential cycle seasonals are down now. The summation index is on a hard sell. Some cash indices on their gaps down this morning look like 3 of 3’s. The overlaps are a real problem on the futures, not so much on the dash.
kent, i am onboard with your analysis. i agree. we shall see how this plays out.
it is all about 111.
Ah … the definition of insanity.
The predicted drops in ES and SPX went a little further than anticipated, but didn’t do any technical damage to the count. In fact, in ES, the top trendline target remains the same.
It seems we’ve simply confirmed the triangle’s lower trendline, but we’re still waiting to define the one on the topside.
In a bear market, the surprises will usually be to the downside. All the waves down so far are in 3, so the direction is still up.
I was short ES last night and went long this morning.
Awesome, Peter T, and thanks for the heads up yesterday…
🙂
I would not be surprised if we see a flash crash cycle
We have mercury retograde is the sign taurus just like 2010.
Good luck to all.
Thanks, John. Good info.
Are we getting close to the ultimate cycle turn? Based on turn dates and EW it looks like one more trip to the top then a waterfall?
Yup, you got it. 🙂
Peter, are you looking for an ES top around Andrew Pancholis next Key Date turn mentioned in his May report?
Sometime in May – depends on whether we’ve finished the triangle and hit the target. I don’t at this point know how long that will take. But we should have a better idea by the end of the week.
5/9 is a 1929 crash date. Close to the Mercury retrograde midpoint. The rule is that what doesn’t turn at retrograde will turn half way.
We’ll see. Maybe the jobreport will be a diaster. Wouldn’t surprise me.
Hello Andre’ are you the same Andre that has shared info with reddragonleo ? are you tradingjazz? do you have a twitter acct?
Scott,
No, I’m not him.
Andre, where do you see that 5/9/2016 is a 1929 style crash date? Astrology setup starting 5/8/2016? https://twitter.com/AstroNewsReport/status/727237359897612288
Scot,
Is just the 122.143 crash angle
US futures down pretty sizable this AM, is there a chance we miss the upward to 2116?
hmmm, so prices continue to break down. on a non ew basis, since 2/16 we have used the middle of the bollinger band as support for higher prices in the spx. friday was the first day since 2/16 that we closed below this middle support level. monday we retested the middle level as resistance, and was subsequently, rejected. yesterday we again closed below. it seems reasonable that the market will touch the bottom of bollinger band in short order [currently at 2040ish] . this lower band should act as support for the market……. we shall see…..
Peter,
Any update with latest breakdown, are you still expecting highs this week.
NO change, from my perspective.
I didn’t say anything about “this week” but we should eventually hit a new high. Target for the D leg for SPX is about 2097. (it’s changed slightly). We’ve hardly moved.
Peter,
When you get a chance please post your updated charts and thoughts. Thanks in advance.
In addition to the EW count the follow through on the broken trendline was weak, and the hourly MACD is showing a positive divergence, looks it was a good morning to take a short term long trade.
I think we will go down into the new moon fase May 6-9 ,after that we will see a recovery rally but I do not see new highs personally.
After that the big plunge into June.
^Ditto. Still seeing ES 2039 or 2036.
I updated ES at the top of the post.
mentioned on april 20. i added to my short position near 2100. didn’t make sense to me to wait for 2116 when we were less than 1% away. i missed out in january when i tried to execute the perfect trade. it seems more times than naught. major astrological alignments setting up for a very bearish next week. potential crash dates 5-9, 5/11. low 5.19. i will buy some protective call hedges near term to protect my june short stake.
BTW, I have another interview coming up on trunews.com on Monday. I don’t know what it’s about yet, but I’ll post it on the site once it’s published.
great last interview. love breadth of your work beyond markets. you are truly gifted Peter. I shared it with my Astrology and Numerology circle:) @scott_minnesota Cycles are interwoven with the vibrational flow of the universe around us.
Thanks, Scott,
My passion these days is in exposing what governments and banks do to us. That has to do with the alignment of man-made cycles (inflation/deflation) with natural cycles. I don’t know if we’ll get into that, but it fascinates me, and it’s worldwide, of course. My next little video (perhaps up by this weekend, script is written) is trying to explain the complexity of these man-made cycles in very simple terms. We have a ponzi scheme that benefits a few and when we get a negative natural cycle, it all falls apart. A travesty.
Inflation (for the benefit of governments and banks) has destroyed the economy of the people. Yet again.
And will destroy everything until we all stand up and make a big fist and put it somewhere where ‘the sun doesn’t shine’ of those that are EVIL! 😉
cHEERS,
w
I put a post and a chart in the forum showing the ending wave we just had in SP500.
https://worldcyclesinstitute.com/forum/todays-market/ending-wave/#p67
would your target on the double bottom be 2116 now? or is your count revised?
No, no changes. Was just pointing out what to look for to confirm a turn. 5 motive waves always means a trend change.
I added another chart to that forum post to show the progression to a new wave up in 5 and a second wave down (which would be the entry point) … if you weren’t dumb like me (and have gotten in earlier). 🙂
Well, that setup made me a liar … but that’s what I look for and I would have taken that trade because the risk on a second wave is very low. You get out if it drops below the 76% retrace level.
hmmm…i am always suspicious of a market that is “walked down”. i would rather see some panic selling to shake out longs, and then a reversal. this “walk down” makes the hairs on my neck stand on end…..
This C leg of the triangle has to turn soon or we will be left with a traditional 4th wave. There’s still lots of leeway for a fourth wave. The C wave of a triangle is always the most complicated wave, so that part is not unusual.
NQ (which I thought looked like a motive wave down) has hit a new low, so it has too many waves and now will also need to go to a new high.
completely walked down since last friday. vix contango is destroying anyone playing options. outright thieves.
So … haha … getting back to where I left off. This rally in SPX looks good, but I’m looking for 5 waves up and a second wave down to about 62%. We’re still very much in a triangle configuration and I think that’s the ultimate pattern, due to the make-up of the original wave up. But it’s certainly a frustrating bear market just waiting to get the go-ahead to break down.
My potential wave 2 entry point on ES is 2041.50
My risk would be a point or so … maybe down to 2040 max.
So, on one ES unit, a risk of $72 against a potential $2232 based on a target now of 2088.
Hi Peter, just wanted to say I really appreciate your updates here! Also your presentations are very clear. Thanks a lot!
So if I get it right, if this pull back is not going below 2000, we are ‘surely’ going to see 2116, and afterwards the big crash? Does it make a difference if it’s not an ending triangle anymore? Result will be the same I suppose (up till 2116 and than go down)…
My target of 2116 is based on the larger degree pattern being a double-pronged second wave. The ending pattern could change the target, but not by a whole lot, imho. Going below 2000 SPX (which is the 38% retrace level) would be a problem for this count for sure. It would likely mean we’ve topped.
We appear to be “on the way” FINALLY (!). This third wave up in SPX should go to 2059, with a fifth going to ~2065. The entire wave up to `2093 should be in 3, with an A wave of 5 likely and a C wave the same. I put the SPX target for the D wave at 2093 (that may change along the way, but I’ll keep us up to date).
It should be a simple wave than the C wave and take less time to get to the target, although it may be choppy.
What comes along, is in that way we will create also a nice head and shoulders formation.
Peter are the time stamps on your posts for Mountain Time? or Pacific?
thanks
whitemare: mountain.
I added a chart of SPX at the top of the post with my projected path.
Fully invested using 3x ETFS, bought back my last batch for a full position. Regardless of what wave counts or cycles, I will be liquidating no later than Friday afternoon. As mentioned before, I am expecting a down draft in the markets from next week into the third week of May. I have an idea on which day to get back long, but I will let the market show its hand first. All the best every one.
Peter,
do you live in alberta, calgary?
yes.
i know sw alberta well, have been hunting in canada for long time.
I updated the chart of ES at the top of the post. The chart of SPX is from last night.
I’m expecting ES to drop to 2046 before turning back up.
The flash crash risk is over I agree Peter we will be there at friday or monday and after that the muppet show continues..upperdepub into Opex.
🙂 it’s going to be slow, but we’re heading up. I’m not sure which point is the start of the B wave on the triangle (SPX), so the measurement of the target for the D wave that we’re in is a little “fuzzy.” The target might be 2090 (based on .618 X that B wave length). That’s because the extension from the first wave up of the D wave we’re in suggests the top is 2088 (this target is 1.618 X wave A up from yesterday morning through this morning). So, somewhere around there should be it. We’re in the C wave up now so it should more or less head straight up from here.
I don’t normally get all this specific (so don’t get used to it … haha) but I have had a few minutes to do some measurements and the math.
For ES, the target on the upside appears to be 2080.
SPX has now completed 5 waves up to the previous 4th at 2059, so it must correct 62%, which should drive ES down to its target of 2046 … and they we all head up.
This is the same setup from yesterday, but at one higher degree, as EW is fractal: 5 waves up, 3 down to 62% (entry on the turn up).
Peter ,
Where do you think this 5 wave up should end around SP500 2075 ? maybe?
2116 is my target.
Oh, I read that as wave 5. I’m not sure what you mean. If you’re talking about the C wave (in 5 waves, I just talked about that). 2088 SPX.
Thanks Peter. Hoping it can reach there by Friday EOD. will see. Appreciate your comments.
Peter, in you cycle prep for your interview on Monday, do you look at Astrology Cycles like this ? https://twitter.com/AstroNewsReport/status/727237359897612288
Scott,
Nope. I’m just starting to get into astrology in a bigger way, but as a student. Although I had a long discussion with Andy Pancholi this morning about the American election and what’s “in the stars” for the key players over the next year or so. I’m more interested in a longer time frame in that regard.
I know this market is making us all crazy …
Recent action in ES suggests a double bottom, so there must be something wrong with the 5 up count (somewhere in the subwaves). I suspect the low will hold, but we’ll have to see.
And so … sigh … here we go again. Nothing has changed. I don’t think we can do this forever … Same target.
When I called this post “The Calm Before the Storm,” I was referring to the markets, not our anxiety or frustration levels.
We now have an unfolding double bottom in SPX, etc. along with good indicator divergence, so I suspect we’re finally going to head up.
As we haven’t come down to the level of the previous fourth wave, the probability is still that we’re in a fourth wave triangle, and as such, targets are still the same.
However, it’s taken 2 whole weeks for this C wave to settle down, so I would suspect we have a good couple of weeks at least before we see the top of this thing.
The challenge is to keep calm in the meantime 🙂
This website is for educational purposes relating to Elliott Wave, natural cycles, and the Quantum Revolution (Great Awakening). I welcome questions or comments about any of these subjects. Due to a heavy schedule, I may not have the time to answer questions that relate to my area of expertise.
I reserve the right to remove any comment that is deemed negative, is unhelpful, or off-topic. Such comments may be removed.
Want to comment? You need to be logged in to comment. You can register here.