
 Mother Nature Always Wins
The current rally (which now definitely coming to an end) can only be a by-product of the action of the Federal Reserve. I’ve never seen a corrective rally this large on such a large scale, as part of a bear market.
Nonetheless, the market still moves to the beat of the Elliott Wave Principle, although wave structure is at times ambiguous. The C wave we’re currently in has a first wave structure that could have been labelled in several different waves and when that happens, it makes the balance of the structure difficult to predict.
Nonetheless, persistence and regular checks on the NYSE (the mother exchange) usually alerts to what’s really going on. My Trader’s Gold group has a much better idea as to what to expect this week, as they have a full analysis of the US indices, the dollar, currencies, and more, but let’s just say, “A turn is imminent.”
The EW principle relies on being able to recognize patterns, and (knowing how they traditionally play out), use fibonacci measurements to identify the most probable turns and targets.
The bottom line is that we’re in the final 5th sub-wave of this C wave rally and will most likely hit the 62% retrace level in cash and futures (very possibly Monday). It will then turn down in what is going to be a set of waves as long as the first set of waves down from the top (around 3400). And … it should be a relatively fast descent.
So we can add to the “knowns in life” (death and taxes) the coming wave down to a new low.
While the Federal Reserve can pump the market by injecting more debt, it will only work for a little while. The wave structure to the upside is quite clearly corrective and it will completely retrace and then some. There’s good news on the horizon.
Know the Past. See the Future
_____________________________
Elliott Wave Basics
Here is a page dedicated to a relatively basic description of the Elliott Wave Principle. You’ll also find a link to the book by Bob Prechter and A. J. Frost.
______________________________
Tops in your field DZ 2
Tops in your field …You are tops in your field. Tried to follow Elliot Wave international for years. They were always behind the market. After discovering you, I perceive that you are an expert in reading the waves, which puts you way ahead of the rest of your peers. And you can read the Waves like you are reading tomorrow’s financial section. I pray you stay healthy. —DZ |
Rise above the rest … SM 2
Rise above the rest …I have only ever met a few people who, in their chosen fields (astrology, medicine, music, martial arts, technical analysis), rise above all the rest and you are one of them…you have ‘the gift’…and that’s why I’m a Trader’s Gold member. —SM |
A true expert in Elliott Wave FL 2
A true expert in Elliott Wave …You are a true expert in EW analysis. What you provide is not available anywhere and is priceless. Subscription on your services is the best thing I have ever done. Many thanks for your effort to make me a better investor. I now have more trust in my investment decisions. I hope you will continue the excellent work! —FL |
the real deal SM 2
The real deal …‘Educational, insightful and thorough market analysis for all levels of traders. It’s Elliott Wave at its best….Peter Temple is the real deal’ —SM |
Get an upper hand … JC 2
Get an upper hand in trading …Seeing all the different currency pairs and the wave structures and hearing you explain why this has to do that on a nightly bases gives one a upper hand when trading. Elliott Wave applies to all stock and indices and can be applied to any candlestick chart. If someone ask what you want for Christmas – Tell them a membership to Peter’s “Traders Gold!”—JC |
Couldn’t be happier … KK 2
Couldn’t be happier …The analysis and insight you provide is simply amazing! I’ve been trading the futures and equity markets for well over thirty years and usually average around 5% monthly. Since joining your Traders Gold Service two months ago, that number has better than doubled. I couldn’t be happier.—KK |
The best of them JL 2
The best of them …Last couple of years, I subscribed to several ‘market traders’. You are by far the best of them and the personal contact is awesome. Daily and daily updates are very well written! Besides your expertise in EW, I also like your cycles analysis. Best investment I ever made! —JL |
Have not had a losing week RW 2
Have not had a losing week …I have been with Peter almost a year. The only thing that matters is have I made money with his service. I think I have finally turned the corner using Peter’s EW. I have not had a losing week in the last 5 months. Thanks Peter, for your amazing amount of hard work. —RW |
US Market Snapshot (based on end-of-week wave structure)
This chart is posted to provide a prediction of future market direction. DO NOT trade based upon the information presented here (certainly NOT from a daily chart).
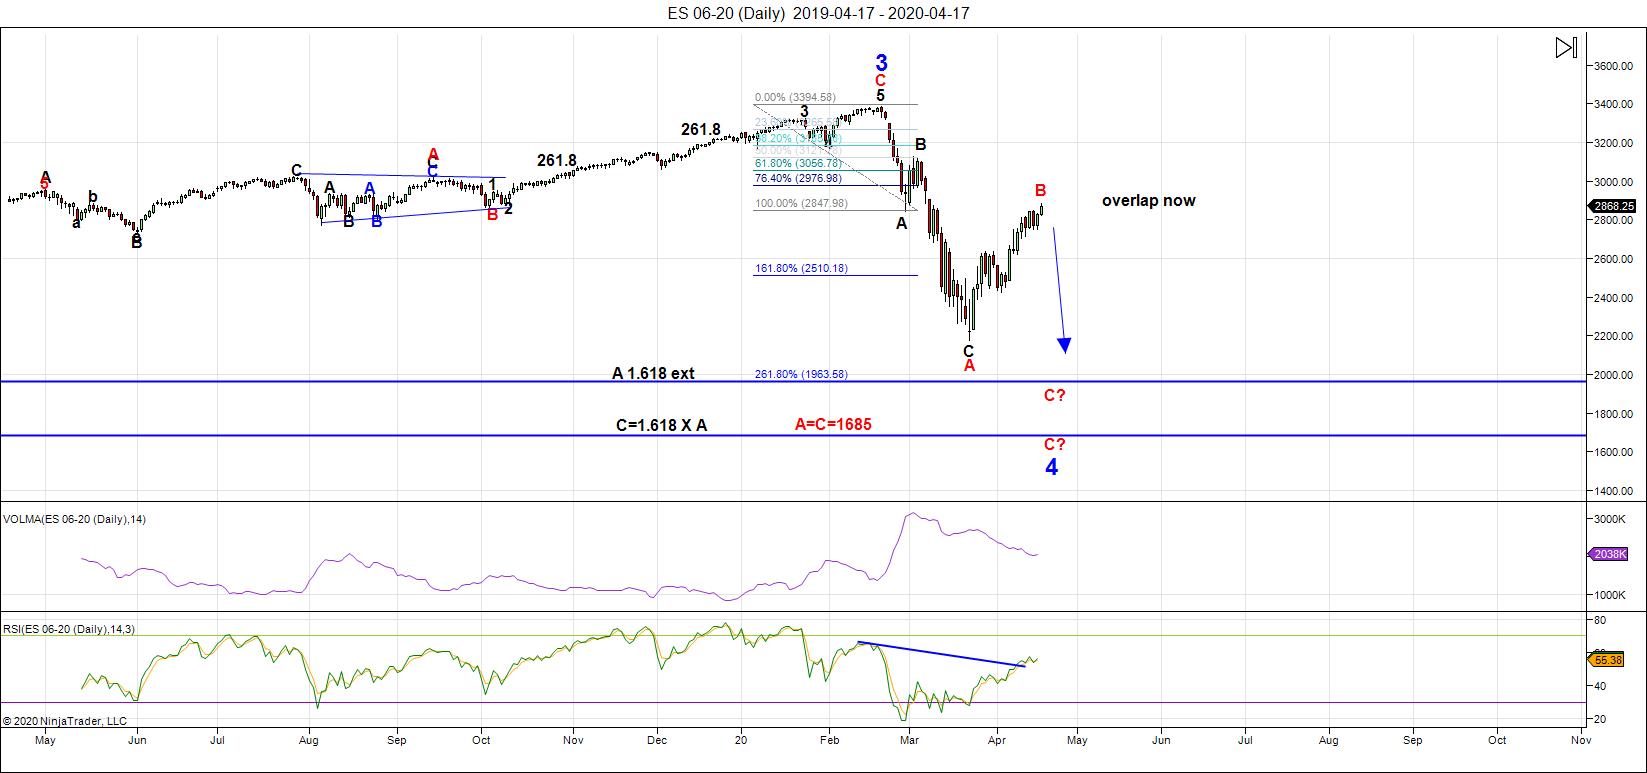
Above is the daily chart of ES (click to enlarge, as with any of my charts).
The wave down from the 3400 area appears to be a double zigzag (the subwaves are difficult to label with certainly). At the bottom of the last zigzag, an ending diagonal traced out. That ended the main down-leg for the short term.
The past two weeks have been extremely frustrating from a "wave count" perspective. We've been in the C wave of one of the most complex countertrend waves I've ever seen and it has only become clear this weekend where and when the turn down will come.
There's a lot of manipulation going on (the Federal Reserve is doing whatever it can to prop up the market with more debt — a very stupid idea) and you and I will pay for it in the end.
It is making the market much more bullish than I ever would have thought; however, the Laws of Nature (one of Elliott's original books) always play out, and even though the wave structure can be complex, it doesn't break. Even so, It has been one of the most difficult two weeks to analyze.
We're near the top of a complex C wave of an ABC correction to the upside. I'm expecting a top this week and another set of zigzags (there are other options, but I think less probable) down to a new low. The wave to come may be just as long as the original wave down from 3400. If not, it will be close.
Also, it's reasonable to expect a time span that's about the same as the first leg down, which took a total of 23 market days to complete. This brings us to the early to mid to late May timeframe.
___________________________
Summary: We appear to be in a "combination" fourth wave, and have traced out double zigzags (two of three possible patterns in a "combination") to the downside so far, along with an ABC correction that has reached the 62% retrace area. We're beginning the third pattern to complete the large fourth wave drop. Another zigzag down appears to be the plan.
Measurements are targeting the area in the 1800s, although there are other options that target a bit higher. The timeframe may be targeting mid to late May for a final low.
Once we've completed the fourth wave down, we'll have a long climb to a final slight new high in a fifth wave of this 500 year cycle top.
_________________________________
Trader's Gold Subscribers get a comprehensive view of the market, including hourly (and even smaller timeframes, when appropriate) on a daily basis. They also receive updates through the comments area. I provide only the daily timeframe for the free blog, as a "snapshot" of where the market currently trades and the next move on a weekly basis.
I do a nightly video on the US indices, USD Index (and related currency pairs), gold, silver, and oil) right down to hourly charts (and even 5 minutes, when required).
______________________________________
Webinar Coming Very Soon

Click on the above image to expand. It was another busy week, More info to come this weekend.


