
 The Final Drop Begins
This past week was a brutal one and highlights the weakest aspect of Elliott Wave — the ability to target the ends of corrective wave patterns.
Impulsive waves are easy. All the waves in an impulsive wave pattern have strict fibonacci relationships to each other. They seldom vary much.
However, corrective waves have five possibilities, but the full wavelength of the correction almost always has a fibonacci ratio that relates to the first A wave of the correction. The challenge becomes figuring out what that A wave is.
Here are the options:
- the A wave 1.618 extension
- the A wave 2.618 extension
- wave A = wave C
- wave C = 1.618 X wave A
- wave C = 2.618 X wave A
It is EXTREMELY RARE that the relationship of wave C to wave A will exceed 2.618.
Corrective Example (AUDUSD)
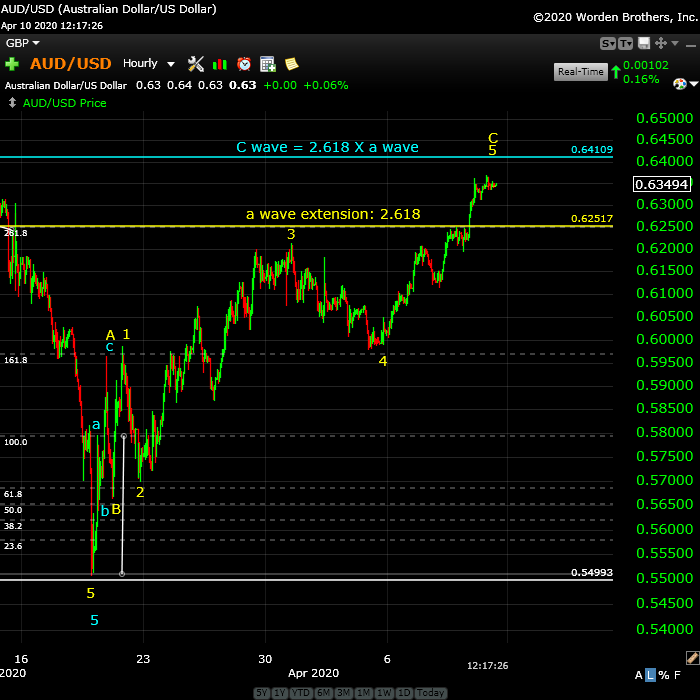
Above is the hourly chart of AUDUSD showing a corrective wave up from the bottom at approx. 0.550.
There are two A waves shown on the screen. There’s a large yellow A wave and a smaller blue a wave. I have always found that the smaller a wave measurement is the most accurate, but very often, both measurements will yield close the same result.
In this case, this huge correction has already surpassed the 1.618 fibonacci relationships and we’re left with the 2.618 levels. Note that it is very rare that you’ll get a correction that goes beyond the 2.618 correction ratio.
The first possible target was the 2.618 extension of the a wave. This level was at 0.625 roughly, shown by the yellow horizontal line on the chart. However, after stopping at that level, we eventually rose above it. If it does so, the probability is very high that the entire correction will target the next major fibonacci ratio. This next “higher” ratio is the A wave relationship to the C wave.
In this case, you measure the blue (smaller) a wave and then place the bottom of your fibonacci tool on the blue b wave bottom (hard to see on this chart, but it’s just above where I’ve place the b. Measuring from here using the full 2.618 measurement targets 0.641. This is most likely the turn point for a wave that will completely retrace (likely in five waves) down to a new low, at least to the 0.550 level.
Know the Past. See the Future
_____________________________
Elliott Wave Basics
Here is a page dedicated to a relatively basic description of the Elliott Wave Principle. You’ll also find a link to the book by Bob Prechter and A. J. Frost.
______________________________
Have not had a losing week RW 2
Have not had a losing week …I have been with Peter almost a year. The only thing that matters is have I made money with his service. I think I have finally turned the corner using Peter’s EW. I have not had a losing week in the last 5 months. Thanks Peter, for your amazing amount of hard work. —RW |
The best of them JL 2
The best of them …Last couple of years, I subscribed to several ‘market traders’. You are by far the best of them and the personal contact is awesome. Daily and daily updates are very well written! Besides your expertise in EW, I also like your cycles analysis. Best investment I ever made! —JL |
the real deal SM 2
The real deal …‘Educational, insightful and thorough market analysis for all levels of traders. It’s Elliott Wave at its best….Peter Temple is the real deal’ —SM |
Tops in your field DZ 2
Tops in your field …You are tops in your field. Tried to follow Elliot Wave international for years. They were always behind the market. After discovering you, I perceive that you are an expert in reading the waves, which puts you way ahead of the rest of your peers. And you can read the Waves like you are reading tomorrow’s financial section. I pray you stay healthy. —DZ |
Rise above the rest … SM 2
Rise above the rest …I have only ever met a few people who, in their chosen fields (astrology, medicine, music, martial arts, technical analysis), rise above all the rest and you are one of them…you have ‘the gift’…and that’s why I’m a Trader’s Gold member. —SM |
Get an upper hand … JC 2
Get an upper hand in trading …Seeing all the different currency pairs and the wave structures and hearing you explain why this has to do that on a nightly bases gives one a upper hand when trading. Elliott Wave applies to all stock and indices and can be applied to any candlestick chart. If someone ask what you want for Christmas – Tell them a membership to Peter’s “Traders Gold!”—JC |
Couldn’t be happier … KK 2
Couldn’t be happier …The analysis and insight you provide is simply amazing! I’ve been trading the futures and equity markets for well over thirty years and usually average around 5% monthly. Since joining your Traders Gold Service two months ago, that number has better than doubled. I couldn’t be happier.—KK |
A true expert in Elliott Wave FL 2
A true expert in Elliott Wave …You are a true expert in EW analysis. What you provide is not available anywhere and is priceless. Subscription on your services is the best thing I have ever done. Many thanks for your effort to make me a better investor. I now have more trust in my investment decisions. I hope you will continue the excellent work! —FL |
US Market Snapshot (based on end-of-week wave structure)
This chart is posted to provide a prediction of future market direction. DO NOT trade based upon the information presented here (certainly NOT from a daily chart).
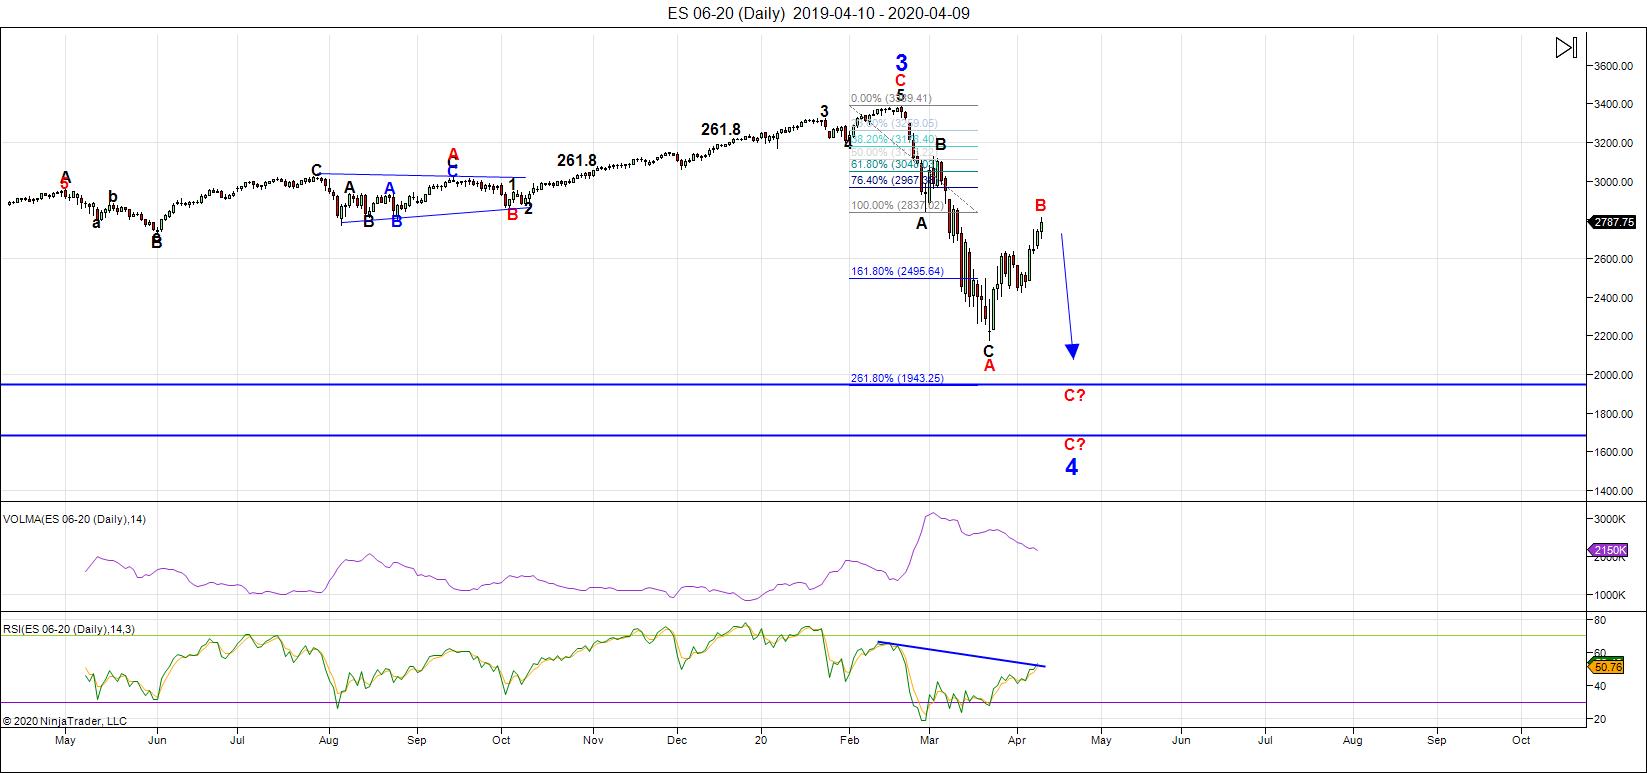
Above is the daily chart of ES (click to enlarge, as with any of my charts).
The wave down from the 3400 area appears to be a double zigzag (the subwaves are difficult to label with certainly). At the bottom of the last zigzag, an ending diagonal traced out. That ended the main down-leg for the short term.
This week saw and unexpected C wave rally up to complete a large expected B wave. The visual look of the wave structure is as important as measurements. In this case, the red B wave on the chart had to be larger that the previous smaller black B wave; it had to give the appearance that the entire wave down from the 3400 area is an ABC wave.
It appeared that wave was in place on the Friday before the last weekend report. However, the market shot up during Trump's Sunday press conference and kept going. While the (obviously) corrective ABC wave up to the 2640 area did measure closely to two waves (A=C) of equal length, it became obvious that the market needed more correction time.
This weekend looks like the full correction is complete, with a 5 wave move up in the C wave. As a result, early this week, we're looking for most probably another zigzag down to the final bottom. There's a reasonable chance that the expected C wave down will be as long in length as the current ABC wave down from 3400. In that case, we'll be targeting the 1800s for a final C wave low.
Also, it's reasonable to expect a time span that's about the same as the first leg down, which took a total of 23 market days to complete. This brings us to the early to mid-May timeframe.
___________________________
Summary: We appear to be in a combination fourth wave, and have traced out double zigzags to the downside. We're beginning the third pattern to complete the large fourth wave drop. Another zigzag down appears to be the plan.
Measurements are targeting the area in the 1800s, although there are other options that target a bit higher. The timeframe may be targeting early to mid-May for a final low.
Once we've completed the fourth wave down, we'll have a long climb to a final slight new high in a fifth wave of this 500 year cycle top.
_________________________________
Trader's Gold Subscribers get a comprehensive view of the market, including hourly (and even smaller timeframes, when appropriate) on a daily basis. They also receive updates through the comments area. I provide only the daily timeframe for the free blog, as a "snapshot" of where the market currently trades and the next move on a weekly basis.
I do a nightly video on the US indices, USD Index (and related currency pairs), gold, silver, and oil) right down to hourly charts (and even 5 minutes, when required).
______________________________________
Webinar Coming Very Soon

Click on the above image to expand. It was a busy week, More info to come this week. First date for the webinar is April 30.


