
 The Blame Game
At the top of the third wave, expecting a drop to under 2100 in SPX, I said that the fourth wave would be blamed on the coronavirus. And sure enough, it has been.
Even though worldwide debt is larger than it has been ever before in history (250 trillion at last count, and obviously growing like wild fire), the “herd” believes that a virus is the thing that’s caused this market downturn. However, I predicted this wave down over a year ago (long before the virus). Nevertheless, politicians and the media blame the virus. The truth is the exact opposite.
When the stock market drops and mood turns sour, illness becomes more prevalent. The most recent pandemic before this one was the Swine Flu, which hit in 2009, right at the bottom of “The Great Recession.” As it turns out, that drop was actually the start of what’s going to result in a major depression that will dwarf the Great Depression of the 1930s. We’ll see more (and more lethal) pandemics ahead, as mood turns increasingly more negative (after the top of the market, expected early next year).
The numbers coming out now (after all the hype and fear-mongering) are pointing to the Coronavirus being another flu-like occurrence that will likely kill no more people than would have died this year, anyway, just like the Swine Flu pandemic.
Estimates are that the Swine Flu affected up to 1.4 million people, but killed only about 150-575,000. It was projected and hyped-up to kill many times more (19 million affected was the original prediction). What’s more, the annual death rates in the US for the years 2007, 2008, 2009, and 2010 were almost exactly the same. Statistically, the same number of people died during the year of the virus as died the year before and after.
This time round, figures coming out of the UK show the same phenomenon. 99% of deaths are to people who were unwell to begin with. The same number of people died in March this year in the United Kingdom (based on early figures) as died in March of last year.
In other words, these “pandemics” tend to hasten the death of people with underlying conditions that were going to die anyway.
It’s estimated that 650,000 people die every year from season flu. We’re nowhere near that number, in fact, at about a tenth of that number.
We have media who are hyping this thing like crazy, because, let’s face it, they’re broke, and more clicks from scared-to-death consumers makes them more money from advertising. Politicians, who we mistakenly call “leaders” (they’re really “followers” because they always react to the consensus) have jumped on the bandwagon, due to fears of losing their jobs if they’re not seeming to react the way the media and the terrified public expect them to.
The perfect horror-show cocktail.
In any case, I’m writing a longer-length blog post this weekend outlining all the inconsistencies in the numbers versus the heavy-handed response. The government has destroyed the already weak economy at a time that it can ill-afford to do so. It will not recover to its previous level and will simply limp into the inevitable depression that I’ve been predicting for over ten years now.
Then the real blame-game will start. It will end in civil wars and revolutions worldwide, just like it always has in the past, after a 500 year cycle top.
The pandemic is not “an unprecedented situation” as touted by the media and everyone you talk to on the street. What is unprecedented is the response. There will be a lot of explaining to do after the true facts come out. Fingers will start pointing in every direction. The truth is that the response has done (and will do) far more damage to people’s lives than the new coronavirus flu bug.
And that’s why history is so important. Paying attention to cycles gives you a head’s up as to what’s going to happen and why. We’re on a merry-go-round with incompetent “followers” and “the greedy” running the show. What else is new?
Know the Past. See the Future
_____________________________
Elliott Wave Basics
Here is a page dedicated to a relatively basic description of the Elliott Wave Principle. You’ll also find a link to the book by Bob Prechter and A. J. Frost.
______________________________
Couldn’t be happier … KK 2
Couldn’t be happier …The analysis and insight you provide is simply amazing! I’ve been trading the futures and equity markets for well over thirty years and usually average around 5% monthly. Since joining your Traders Gold Service two months ago, that number has better than doubled. I couldn’t be happier.—KK |
The best of them JL 2
The best of them …Last couple of years, I subscribed to several ‘market traders’. You are by far the best of them and the personal contact is awesome. Daily and daily updates are very well written! Besides your expertise in EW, I also like your cycles analysis. Best investment I ever made! —JL |
Get an upper hand … JC 2
Get an upper hand in trading …Seeing all the different currency pairs and the wave structures and hearing you explain why this has to do that on a nightly bases gives one a upper hand when trading. Elliott Wave applies to all stock and indices and can be applied to any candlestick chart. If someone ask what you want for Christmas – Tell them a membership to Peter’s “Traders Gold!”—JC |
Tops in your field DZ 2
Tops in your field …You are tops in your field. Tried to follow Elliot Wave international for years. They were always behind the market. After discovering you, I perceive that you are an expert in reading the waves, which puts you way ahead of the rest of your peers. And you can read the Waves like you are reading tomorrow’s financial section. I pray you stay healthy. —DZ |
the real deal SM 2
The real deal …‘Educational, insightful and thorough market analysis for all levels of traders. It’s Elliott Wave at its best….Peter Temple is the real deal’ —SM |
Rise above the rest … SM 2
Rise above the rest …I have only ever met a few people who, in their chosen fields (astrology, medicine, music, martial arts, technical analysis), rise above all the rest and you are one of them…you have ‘the gift’…and that’s why I’m a Trader’s Gold member. —SM |
Have not had a losing week RW 2
Have not had a losing week …I have been with Peter almost a year. The only thing that matters is have I made money with his service. I think I have finally turned the corner using Peter’s EW. I have not had a losing week in the last 5 months. Thanks Peter, for your amazing amount of hard work. —RW |
A true expert in Elliott Wave FL 2
A true expert in Elliott Wave …You are a true expert in EW analysis. What you provide is not available anywhere and is priceless. Subscription on your services is the best thing I have ever done. Many thanks for your effort to make me a better investor. I now have more trust in my investment decisions. I hope you will continue the excellent work! —FL |
US Market Snapshot (based on end-of-week wave structure)
This chart is posted to provide a prediction of future market direction. DO NOT trade based upon the information presented here (certainly NOT from a daily chart).
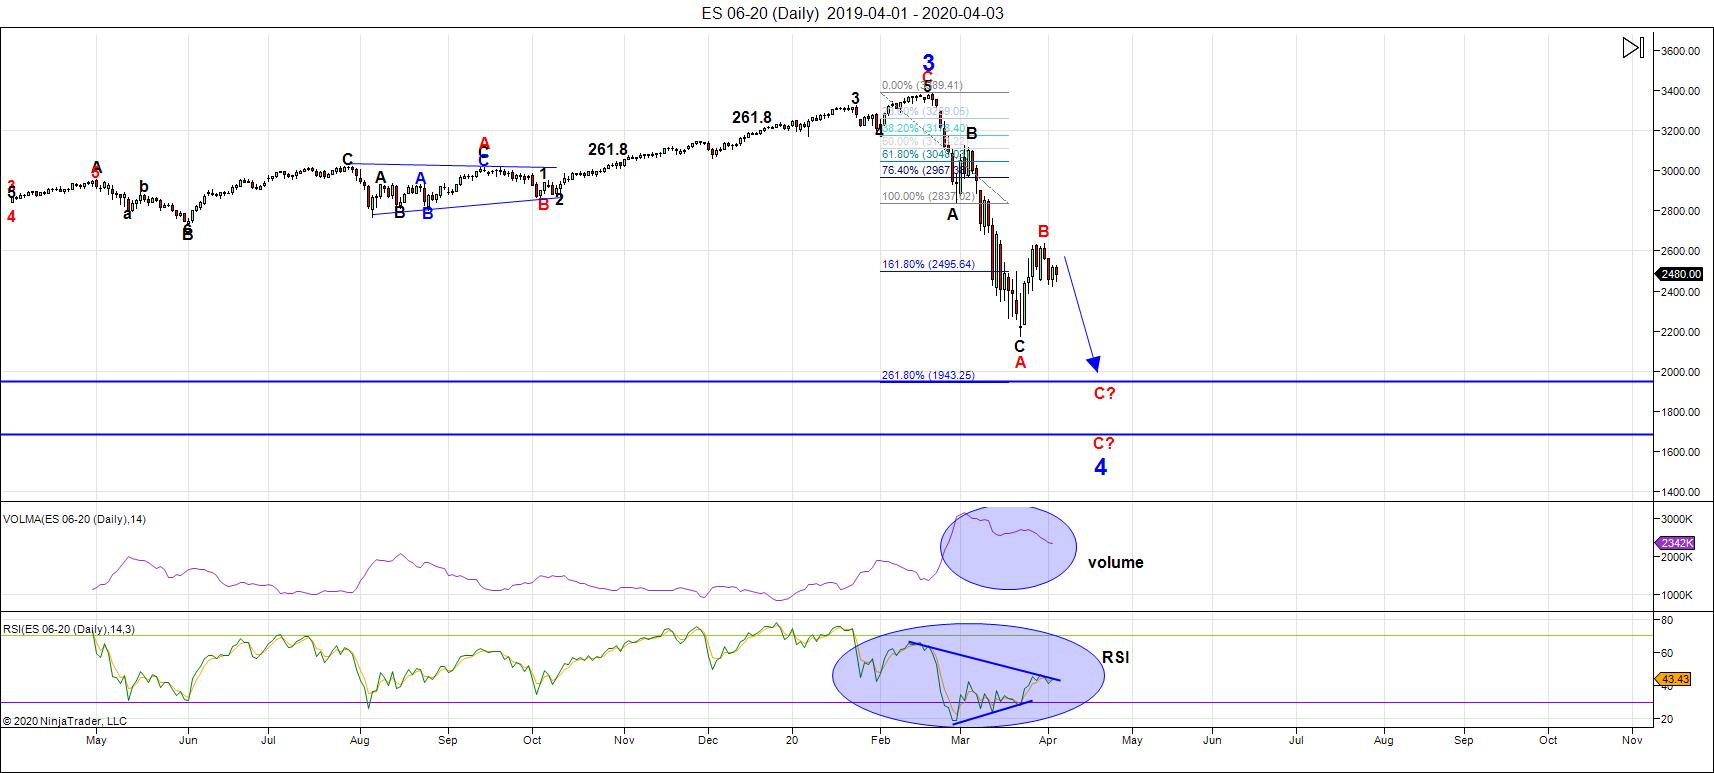
Above is the daily chart of ES (click to enlarge, as with any of my charts).
The wave down from the 3400 area appears to be a double zigzag (the subwaves are difficult to label with certainly). At the bottom of the last zigzag, an ending diagonal traced out. That ended the main down-leg for the short term.
I'd then called for a rally, as we needed another wave up at least 38% of the distance from the 3400 top. This B wave rally has to be high enough to make the entire structure look like an ABC "three." We got that rally the week before last.
Last weekend, I called for an intermediate top, which we now have in place. The main trend is still down and it appears so far, that it will be another zigzag. Looking down to a new low.
___________________________
Summary: We appear to be in a combination fourth wave, and have traced out double zigzags to the downside. We're beginning the third pattern to complete the large fourth wave drop. Another zigzag down appears to be the plan.
I expect to see at least a slight new low.
Once we've completed the fourth wave down, we'll have a long climb to a final slight new high in a fifth wave of this 500 year cycle top.
_________________________________
Trader's Gold Subscribers get a comprehensive view of the market, including hourly (and even smaller timeframes, when appropriate) on a daily basis. They also receive updates through the comments area. I provide only the daily timeframe for the free blog, as a "snapshot" of where the market currently trades and the next move on a weekly basis.
I do a nightly video on the US indices, USD Index (and related currency pairs), gold, silver, and oil) right down to hourly charts (and even 5 minutes, when required).
______________________________________
Webinar Coming Very Soon
Click on the above image to expand. I'll be announcing dates for the webinar during the week.


