

A Top Is Forming
After a week of a correction to the upside in the US indices, as expected, this weekend, it looks like we’re forming a top. The next move should be to the downside.
The waves up now look corrective, and because of that (and what’s going on with the Dollar Index), I’m expecting to see a major turn early in the week. Because of these things combined, I think we’ve seen the last of the upside correction. I believe it’s down from here.
Inflation vs Deflation: The USD Index (DXY)
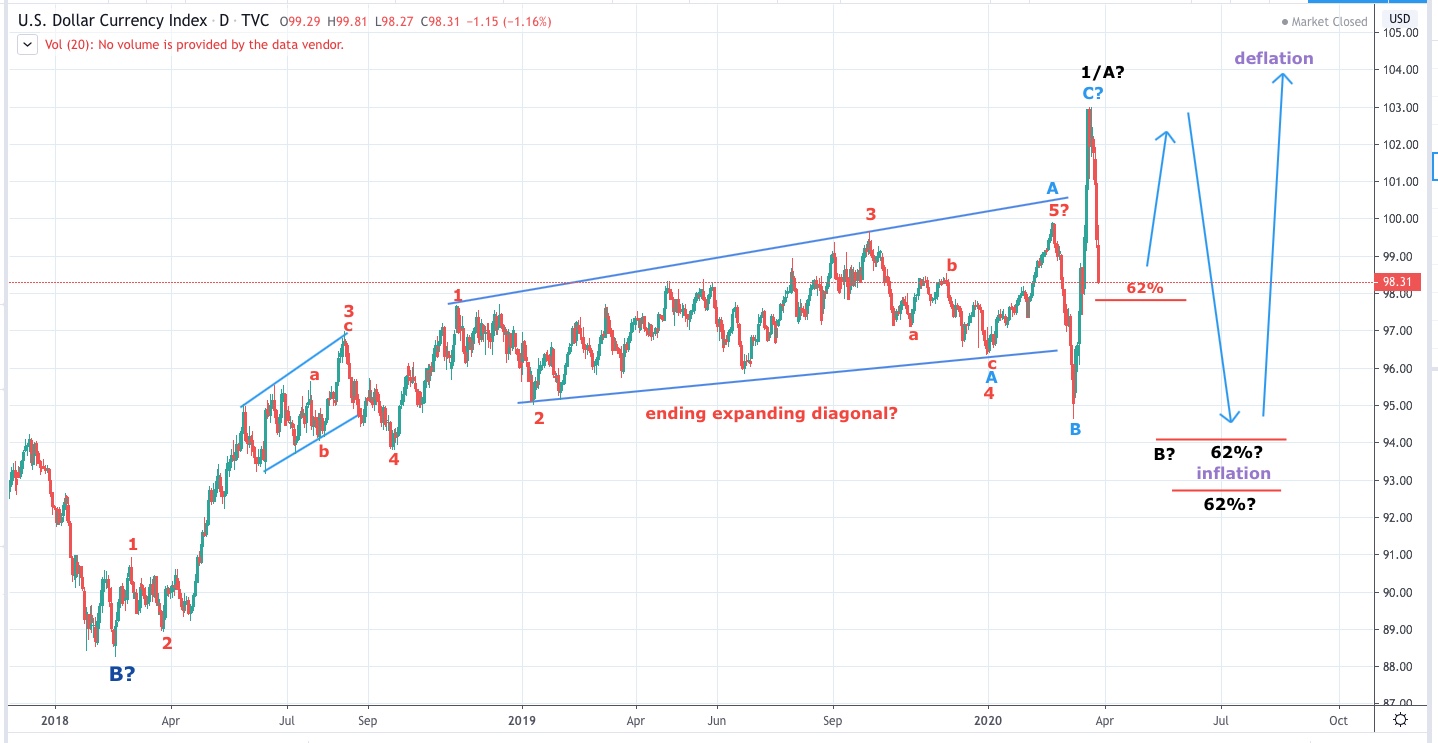
Above is the daily chart of the US Dollar Index (DXY).
The longer-term direction appears to be getting clearer and it’s interesting how it’s gelling with what’s going on in the US itself.
Short-term, we should turn up with a wave up to the previous high, at least. That’s a deflationary move, as is any move of the US dollar to the upside. It signifies that the liquidity problem (scarcity of the USD) is intensifying. In that scenario, the US buck becomes more valuable.
In a couple of weeks, the Federal Reserve will again flooding the market with more debt, in the form of a “Bernanke helicopter drop” to the population and small businesses. At that point, the US Dollar Index should be set to turn down, and this will likely happen with the final 5th wave up to an all-time new high in the US indices (equities). That should last through the fall and perhaps into early next year. That’s inflationary.
An injection of more debt can’t solve the problem of a world-wide economy drowning in debt, of course. And the cries of hyperinflation are ridiculous.
Remember, we’re talking about the reserve currency that’s used by countries all over the world. There is no way the Fed can plug a hole that large. The attempt to do so will eventually fail. When it does, the US Dollar Index will turn back to the upside and this time, it will keep on going. That event should mark the top of the stock market. It will begin to implode and result in the gradual end to the house of cards, which we call our financial system.
No depression has even taken place in history that is not deflationary.
Know the Past. See the Future
_____________________________
Elliott Wave Basics
Here is a page dedicated to a relatively basic description of the Elliott Wave Principle. You’ll also find a link to the book by Bob Prechter and A. J. Frost.
______________________________
Rise above the rest … SM 2
Rise above the rest …I have only ever met a few people who, in their chosen fields (astrology, medicine, music, martial arts, technical analysis), rise above all the rest and you are one of them…you have ‘the gift’…and that’s why I’m a Trader’s Gold member. —SM |
Couldn’t be happier … KK 2
Couldn’t be happier …The analysis and insight you provide is simply amazing! I’ve been trading the futures and equity markets for well over thirty years and usually average around 5% monthly. Since joining your Traders Gold Service two months ago, that number has better than doubled. I couldn’t be happier.—KK |
the real deal SM 2
The real deal …‘Educational, insightful and thorough market analysis for all levels of traders. It’s Elliott Wave at its best….Peter Temple is the real deal’ —SM |
The best of them JL 2
The best of them …Last couple of years, I subscribed to several ‘market traders’. You are by far the best of them and the personal contact is awesome. Daily and daily updates are very well written! Besides your expertise in EW, I also like your cycles analysis. Best investment I ever made! —JL |
A true expert in Elliott Wave FL 2
A true expert in Elliott Wave …You are a true expert in EW analysis. What you provide is not available anywhere and is priceless. Subscription on your services is the best thing I have ever done. Many thanks for your effort to make me a better investor. I now have more trust in my investment decisions. I hope you will continue the excellent work! —FL |
Tops in your field DZ 2
Tops in your field …You are tops in your field. Tried to follow Elliot Wave international for years. They were always behind the market. After discovering you, I perceive that you are an expert in reading the waves, which puts you way ahead of the rest of your peers. And you can read the Waves like you are reading tomorrow’s financial section. I pray you stay healthy. —DZ |
Have not had a losing week RW 2
Have not had a losing week …I have been with Peter almost a year. The only thing that matters is have I made money with his service. I think I have finally turned the corner using Peter’s EW. I have not had a losing week in the last 5 months. Thanks Peter, for your amazing amount of hard work. —RW |
Get an upper hand … JC 2
Get an upper hand in trading …Seeing all the different currency pairs and the wave structures and hearing you explain why this has to do that on a nightly bases gives one a upper hand when trading. Elliott Wave applies to all stock and indices and can be applied to any candlestick chart. If someone ask what you want for Christmas – Tell them a membership to Peter’s “Traders Gold!”—JC |
US Market Snapshot (based on end-of-week wave structure)
This chart is posted to provide a prediction of future market direction. DO NOT trade based upon the information presented here (certainly NOT from a daily chart).

Above is the daily chart of ES (click to enlarge, as with any of my charts).
The wave down from the 3400 area appears to be a double zigzag (the subwaves are difficult to label with certainly). At the bottom of the last zigzag, an ending diagonal traced out. That ended the downward trend for the short term.
In the SP500, the final wave doesn't appear to be an ending diagonal, so the odds are that it's a set of five waves, which would strongly favour the double zigzag idea (it's a very odd set of final waves). Not only are the waves difficult to label naturally, we're faced with a lot of missing data, after several limit down and up stoppages in the futures market.
I'd then called for a rally, as we needed another wave up at least 38% of the distance from the 3400 top. This B wave rally has to be high enough to make the entire structure look like an ABC "three." We got that rally this week.
The waves of the rally are very difficult to label with certainty, but my bias this weekend is that the wave up is corrective (not in five waves). If it was five waves, we'd be expecting another leg up after a three wave correction the the downside, However, I'm leaning towards the current rally high this weekend being all the countertrend rally we're going to get. As a result, I'm expecting a new low to the fourth wave, which should end the fourth altogether.
I could be wrong, but it's my best assessment of the situation, given the terribly formed waves we're forced to deal with.
I don't know what the final pattern (down) will be at this point. It's most likely that it will be another zigzag, or a triangle (the latter will take much more time to unfold that an zigzag).
___________________________
Summary: We appear to be in a combination fourth wave, and have traced out double zigzags to the downside. We've traced out the large bounce I was expecting, but I think that's all we're going to get.
That being the case, I expect to see a final (third) pattern play out to the downside that results in a slight new low to complete this large fourth wave.
Once we've completed the fourth wave down, we'll have a long climb to a final slight new high in a fifth wave of this 500 year cycle top.
_________________________________
Trader's Gold Subscribers get a comprehensive view of the market, including hourly (and even smaller timeframes, when appropriate) on a daily basis. They also receive updates through the comments area. I provide only the daily timeframe for the free blog, as a "snapshot" of where the market currently trades and the next move on a weekly basis.
I do a nightly video on the US indices, USD Index (and related currency pairs), gold, silver, and oil) right down to hourly charts (and even 5 minutes, when required).
______________________________________
Navigating the Crash
Next Date: SUSPENDED for the time being

NOTE: Due to the extraordinary challenge of trying to analyze this fast-moving market, re-label charts, formulate an overview, double-check streaming software, and launch a webinar, all in an hour at the end of market session, I'm suspending the Chart Show for the time being, until I can offer another solution.
___________________
The Chart Show is a one hour webinar in which Peter Temple provides the Elliott Wave analysis in real time for the US market, gold, silver, oil, major USD currency pairs, and more. You won't find a more accurate or comprehensive market prediction anywhere for this price.
Get caught up on the market from an Elliott Wave perspective. There’ll be a Q&A session during and at the end of the webinar and the possibility (depending on time) of taking requests.
| "I think you are the only Elliot Wave technician on the planet who knows what he's doing.” |
| m.d. (professional trader) |
All registrants will receive the video playback of the webinar, so even if you miss it, you’ll be sent the full video replay within about an hour of its conclusion.


