
Fourth Wave Combinations
Fourth waves at this high level of trend typically form combination waves. What this means is that more than one Elliott wave corrective pattern traces out before the larger correction is done. The secret to trading it is to figure out each of the patterns before they’re complete. It’s a difficult take but it’s made a little easier due to the fact that almost all patterns have fibonacci relationships to other patterns.
This weekend, I thought it appropriate to spend a little time on combination waves, because we’re seeing one unfold in the current bearish fourth wave.
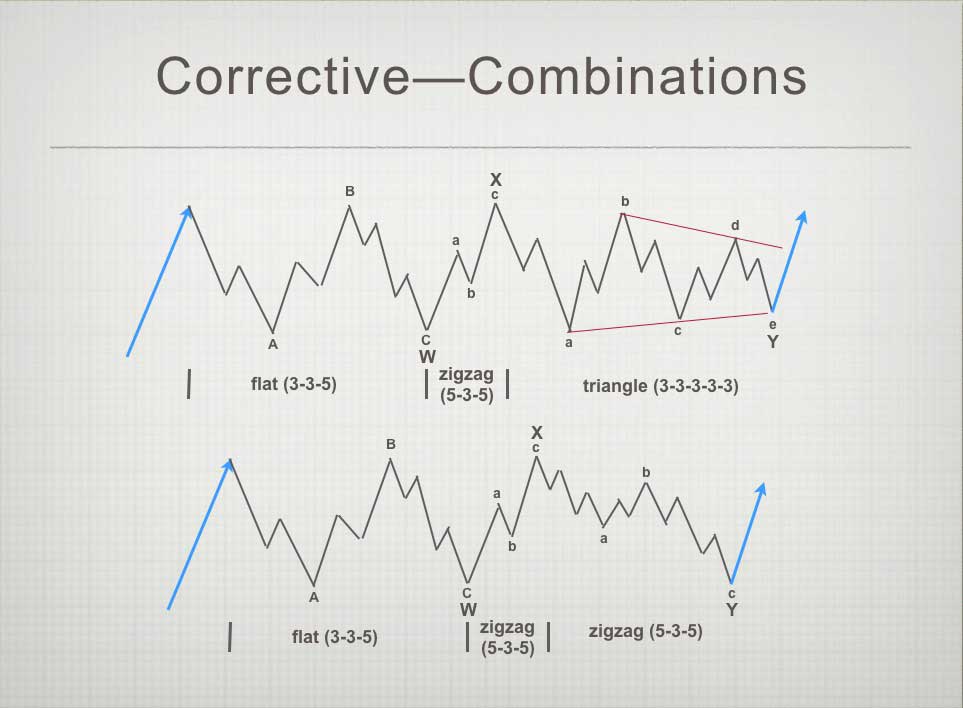
Above is a chart showing combinations and the patterns that make them out. The two combination patterns above are each referred to as “triple threes.” That’s because corrective waves form a 3 wave pattern overall and there are three corrective patterns in each of the two examples above.
Let’s look at the structure of these Elliott wave patterns that make up a combination. A flat is 3 waves (3-3-5), a zigzag is 3 waves (5-3-5), and a triangle (3-3-3-3-3) is counted as three waves, even thought there are 5 waves (each wave in three sub-waves). I know, all very complicated. But as you study Elliott waves and see these patterns over and over again, they begin to make more sense the more you see them play out.
There are also “double threes,” which only contain two patterns. You’re allowed a maximum of three patterns in a fourth wave corrective retrace.
NOTE: The waves depicted above are horizontal in direction, but in reality, they would either slope up or down, depending in whether we’re in a bull or bear market.
Fourth waves are always corrective. At small degree (smaller waves), there may be only one pattern that plays out. At this high degree, you can pretty well count on at least two patterns (a “double three”).
We’ve completed two patters, by the looks of it, a double zigzag (although the waves down are not clear enough to ensure that’s it’s not a single zigzag). I’m expecting a major bounce as a B wave and then a final pattern to the downside. The next pattern could be a zigzag, a flat, or a triangle. The probability is that it will be another zigzag, or a triangle.
Know the Past. See the Future
_____________________________
Elliott Wave Basics
Here is a page dedicated to a relatively basic description of the Elliott Wave Principle. You’ll also find a link to the book by Bob Prechter and A. J. Frost.
______________________________
The best of them JL 2
The best of them …Last couple of years, I subscribed to several ‘market traders’. You are by far the best of them and the personal contact is awesome. Daily and daily updates are very well written! Besides your expertise in EW, I also like your cycles analysis. Best investment I ever made! —JL |
A true expert in Elliott Wave FL 2
A true expert in Elliott Wave …You are a true expert in EW analysis. What you provide is not available anywhere and is priceless. Subscription on your services is the best thing I have ever done. Many thanks for your effort to make me a better investor. I now have more trust in my investment decisions. I hope you will continue the excellent work! —FL |
Have not had a losing week RW 2
Have not had a losing week …I have been with Peter almost a year. The only thing that matters is have I made money with his service. I think I have finally turned the corner using Peter’s EW. I have not had a losing week in the last 5 months. Thanks Peter, for your amazing amount of hard work. —RW |
the real deal SM 2
The real deal …‘Educational, insightful and thorough market analysis for all levels of traders. It’s Elliott Wave at its best….Peter Temple is the real deal’ —SM |
Couldn’t be happier … KK 2
Couldn’t be happier …The analysis and insight you provide is simply amazing! I’ve been trading the futures and equity markets for well over thirty years and usually average around 5% monthly. Since joining your Traders Gold Service two months ago, that number has better than doubled. I couldn’t be happier.—KK |
Rise above the rest … SM 2
Rise above the rest …I have only ever met a few people who, in their chosen fields (astrology, medicine, music, martial arts, technical analysis), rise above all the rest and you are one of them…you have ‘the gift’…and that’s why I’m a Trader’s Gold member. —SM |
Get an upper hand … JC 2
Get an upper hand in trading …Seeing all the different currency pairs and the wave structures and hearing you explain why this has to do that on a nightly bases gives one a upper hand when trading. Elliott Wave applies to all stock and indices and can be applied to any candlestick chart. If someone ask what you want for Christmas – Tell them a membership to Peter’s “Traders Gold!”—JC |
Tops in your field DZ 2
Tops in your field …You are tops in your field. Tried to follow Elliot Wave international for years. They were always behind the market. After discovering you, I perceive that you are an expert in reading the waves, which puts you way ahead of the rest of your peers. And you can read the Waves like you are reading tomorrow’s financial section. I pray you stay healthy. —DZ |
US Market Snapshot (based on end-of-week wave structure)
This chart is posted to provide a prediction of future market direction. DO NOT trade based upon the information presented here (certainly NOT from a daily chart).
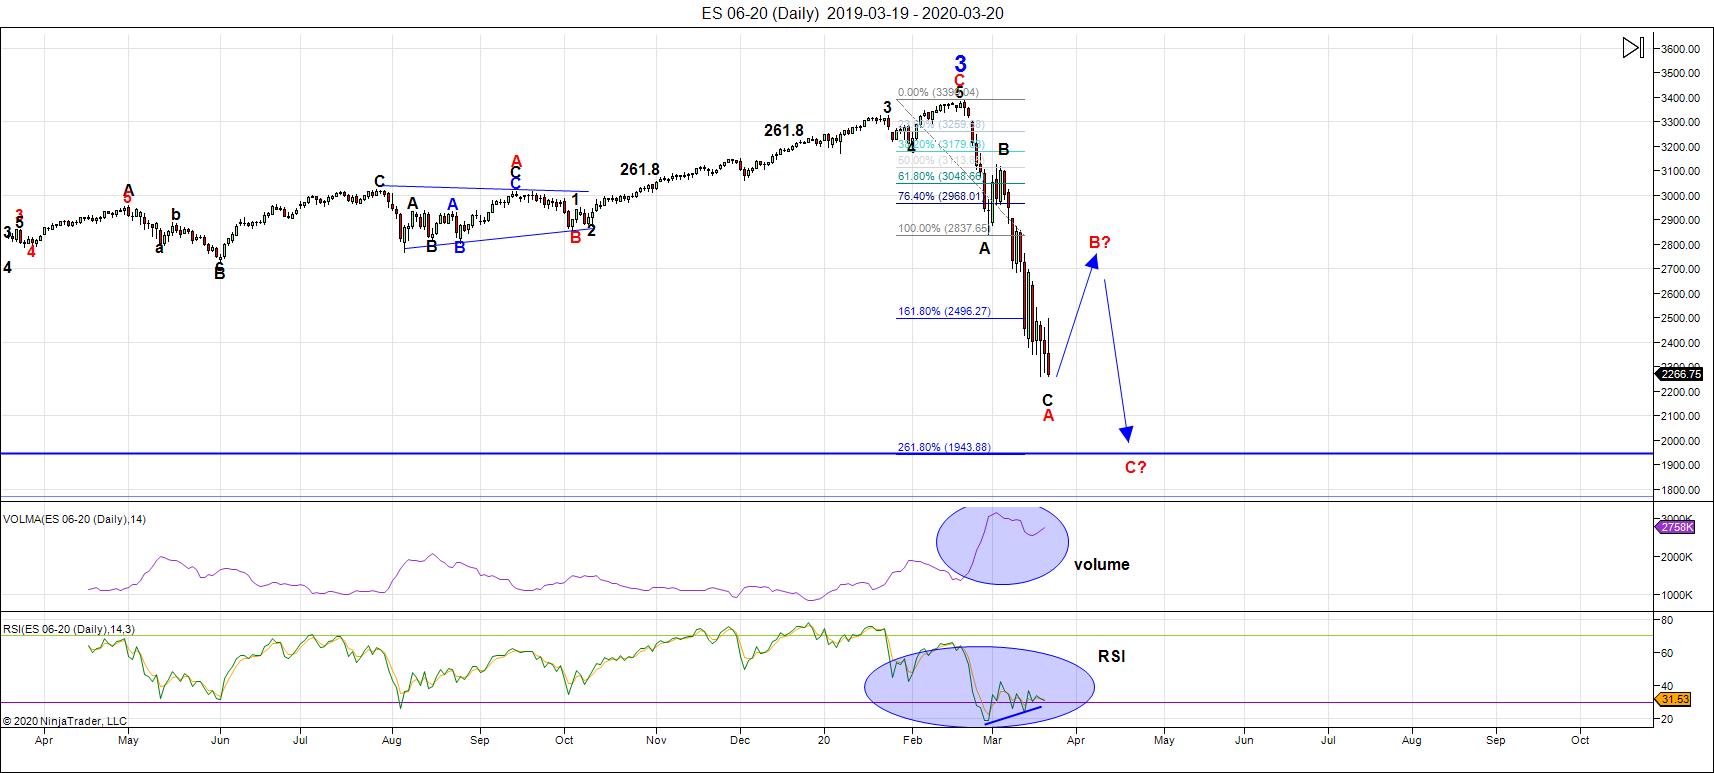
Above is the daily chart of ES (click to enlarge, as with any of my charts).
The wave down from the 3400 area appears to be a double zigzag (the subwaves are difficult to label with certainly, although the current structure we're currently in near the bottom in ES and NQ looks most like an ending diagonal).
In the SP500, this final wave can't be and ending diagonal, but the odds are more that it's a set of five waves, which would strongly favour the double zigzag idea. Not only are the waves difficult to label naturally, we're faced with a lot of missing data, after several limit down and up stoppages in the futures market.
In any case, I'm preferring the double zigzag count with an ending diagonal as the tail end of the second zigzag.
In any case, that would count as two patterns of the three allowed in a major fourth wave correction (an EW "combination"). At the same time, the wave down has the visual appearance of a single wave but must, in a combination pattern, appear as a "three" (a clear ABC wave). So, I'm expecting a large bounce in an additional third pattern with a final low slightly below the intermediate low that's working on a bottom this week.
I don't know that the final pattern will be at this point. It's most likely that it will be another zigzag, or a triangle (the latter will take much more time to unfold that an zigzag).
So, after we fine the bottom of the ending diagonal, expect a large bounce in three waves (possibly to the 38% retrace level or even higher) and then a final pattern to the downside with a new low.
Once this five wave series has bottomed, expect central bankers to react and flood the market with even more debt (we got a good dose of it added this past week). That will set up the fifth and final wave up to an all time new high. It will not save the stock market; central bankers will finally fail in their attempts to create a never ending bubble. Bubbles always burst and this is the biggest financial bubble in history.
___________________________
Summary: We appear to be in a combination fourth wave, and have traced out zigzags to the downside. I expect to see a large bounce before a final pattern plays out that results in a slight new low to complete this large fourth wave (that should end in the area of the previous fourth wave of one lesser degree, which bottomed at around 1800).
Once we've completed the fourth wave down, we'll have a long climb to a final slight new high in a fifth wave of this 500 year cycle top.
_________________________________
Trader's Gold Subscribers get a comprehensive view of the market, including hourly (and even smaller timeframes, when appropriate) on a daily basis. They also receive updates through the comments area. I provide only the daily timeframe for the free blog, as a "snapshot" of where the market currently trades and the next move on a weekly basis.
I do a nightly video on the US indices, USD Index (and related currency pairs), gold, silver, and oil) right down to hourly charts (and even 5 minutes, when required).
______________________________________
Sign up for: The Chart Show
Next Date: SUSPENDED for the time being

NOTE: Due to the extraordinary challenge of trying to analyze this fast-moving market, re-label charts, formulate an overview, double-check streaming software, and launch a webinar, all in an hour at the end of market session, I'm suspending the Chart Show for the time being, until I can offer another solution.
___________________
The Chart Show is a one hour webinar in which Peter Temple provides the Elliott Wave analysis in real time for the US market, gold, silver, oil, major USD currency pairs, and more. You won't find a more accurate or comprehensive market prediction anywhere for this price.
Get caught up on the market from an Elliott Wave perspective. There’ll be a Q&A session during and at the end of the webinar and the possibility (depending on time) of taking requests.
| "I think you are the only Elliot Wave technician on the planet who knows what he's doing.” |
| m.d. (professional trader) |
All registrants will receive the video playback of the webinar, so even if you miss it, you’ll be sent the full video replay within about an hour of its conclusion.


