

A New Monetary System?
I have thoughts of standing on a street corner and scalping toilet paper rolls … to make some REAL money … lol.
In my city, and many others, both Costco and supermarkets have been cleaned out of toilet paper, as if it’s going to save a life!
The mood of the herd has turned decidedly negative, which is what we’re supposed to be seeing as this high degree fourth wave unfolds. It’s the response to the virus that’s more dangerous than the virus itself.
“At the extremes, the herd is always wrong. One should not under estimate its capacity for stupidity.” —The Secret Life of Real Estate, Phil Anderson
There are scores of people that have had the disease that have gone undetected, making the deaths-relative-to-infections data look much worse than it probably actually is. If you’ve over 85 and have respiratory problems or other chronic disease then you should be concerned. But otherwise, not so much.
But, the mainstream media is not doing well financially and the more they can sensationalize this story, the more clicks they get. They also don’t have any money for investigative reporters, so they tend to repeat whatever come over the AP wire; it’s the same repetitive stuff we news readers who aren’t paid to think.
And politicians just pander to the fear, so they don’t get voted out at the next election. I’m rather cynical of that group!
The virus has little effect on the market. I’ve been predicting this downturn for over a year. What the virus may influence is the speed of the drop. However, it’s behaving as it otherwise would normally. The mood of the herd had turned decidedly negative, as I would expect with a high degree market downturn. But, if you think this is negative, just wait until next year!
In any event, I expect the final wave down in this market to end in April/May and that should be the end of the virus for this year, as well. In warmer environments (there’s lots of snow this weekend where I live), you’ll be able to walk around your neighbourhood and by the lack of leaves on trees, be able to tell who didn’t get to Costco on time!
This virus has hit very early in this new downward cycle, and that supports the fact that it was probably not naturally generated (there’s lots of speculation that is was released form the Wuhan infectious diseases lab). But, make no mistake, there will be more deadly pandemics over the next fifty years, as it gets colder, dryer, food production wanes, and people are less financially secure (ie.—weaker, psychologically negative-thinking, and not as well nourished). Exercise regularly and stay well!
Know the Past. See the Future
_____________________________
A Pivotal Week?
For many months, I’d written about the option of either:
- five waves down out of what looked like an extreme expanded flat, or
- a set of zigzags
I chose five waves; I really didn’t want zigzags, because they’re so difficult to predict and trade. But, that’s obviously what we have. It’s also a good reason NOT to trade the first wave down, because there’s no way to know how it will play out. Once it’s in place, risk for the next move is greatly reduced, and you have a much higher prospect of success on a larger move.
If you do catch it, invariably you get out too early, try to get back in, and get blindsided by the eventual retrace.
There are good things to waiting on the sidelines:
- We should see an extreme three wave relief rally, which I called for on Thursday. Sure enough, we’re in it. I would expect this rally to hit, or get very close to, the 62% retrace level.
- It will lead to a devastating C wave drop to our target or even a little lower. The C wave should end up being 1.618 X the length of the A wave down. No reason to worry out retraces; they will be small in comparison to the current one this week.
Timing: I wouldn’t be surprised to see it last less than the coming week. Central banks and governments are doing everything they can to send this market to new highs, but it won’t happen.
There’s a Federal Reserve announcement on Wednesday and options expiry on Friday. My sense is that we might see a turn after the former and before the latter, but we’ll have to wait to find out.
In any case, once we get close to the 3000 level in ES (if we get there), it will be time to look to the downside again.
At the same time, currency pairs have extended moves getting ready to start, so there are lots of opportunities there.
Gold may have topped. If so, we’ll be waiting for a second wave to confirm that the top is indeed in place.
__________________________
C Wave Personality (the coming wave to the downside)
Here’s a description of the personality of a third wave (lifted from the Elliott Wave Principle). You can find a link to Bob Prechter’s book on my recommended books page.
“C waves—declining C waves are usually devastating in their destruction. They are third waves and have most of the properties of third waves. It is during these declines that there is virtually no place to hide except cash. The illusions held throughout waves A and B tend to evaporate and fear takes over.
C waves are persistent and broad. 1930-1932 was a C wave. 1962 was a C wave. 1969-1970 and 1973-1974 and be classified as C waves.
Advancing C waves within upward corrections and larger bear markets are just as dynamic and can be mistaken for the start of a new upswing, especially since they unfold in five waves.”
The 1987 “crash” was also a C wave (at its finest).
____________________________
Elliott Wave Basics
Here is a page dedicated to a relatively basic description of the Elliott Wave Principle. You’ll also find a link to the book by Bob Prechter and A. J. Frost.
______________________________
the real deal SM 2
The real deal …‘Educational, insightful and thorough market analysis for all levels of traders. It’s Elliott Wave at its best….Peter Temple is the real deal’ —SM |
Tops in your field DZ 2
Tops in your field …You are tops in your field. Tried to follow Elliot Wave international for years. They were always behind the market. After discovering you, I perceive that you are an expert in reading the waves, which puts you way ahead of the rest of your peers. And you can read the Waves like you are reading tomorrow’s financial section. I pray you stay healthy. —DZ |
Rise above the rest … SM 2
Rise above the rest …I have only ever met a few people who, in their chosen fields (astrology, medicine, music, martial arts, technical analysis), rise above all the rest and you are one of them…you have ‘the gift’…and that’s why I’m a Trader’s Gold member. —SM |
A true expert in Elliott Wave FL 2
A true expert in Elliott Wave …You are a true expert in EW analysis. What you provide is not available anywhere and is priceless. Subscription on your services is the best thing I have ever done. Many thanks for your effort to make me a better investor. I now have more trust in my investment decisions. I hope you will continue the excellent work! —FL |
Couldn’t be happier … KK 2
Couldn’t be happier …The analysis and insight you provide is simply amazing! I’ve been trading the futures and equity markets for well over thirty years and usually average around 5% monthly. Since joining your Traders Gold Service two months ago, that number has better than doubled. I couldn’t be happier.—KK |
Have not had a losing week RW 2
Have not had a losing week …I have been with Peter almost a year. The only thing that matters is have I made money with his service. I think I have finally turned the corner using Peter’s EW. I have not had a losing week in the last 5 months. Thanks Peter, for your amazing amount of hard work. —RW |
The best of them JL 2
The best of them …Last couple of years, I subscribed to several ‘market traders’. You are by far the best of them and the personal contact is awesome. Daily and daily updates are very well written! Besides your expertise in EW, I also like your cycles analysis. Best investment I ever made! —JL |
Get an upper hand … JC 2
Get an upper hand in trading …Seeing all the different currency pairs and the wave structures and hearing you explain why this has to do that on a nightly bases gives one a upper hand when trading. Elliott Wave applies to all stock and indices and can be applied to any candlestick chart. If someone ask what you want for Christmas – Tell them a membership to Peter’s “Traders Gold!”—JC |
US Market Snapshot (based on end-of-week wave structure)
This chart is posted to provide a prediction of future market direction. DO NOT trade based upon the information presented here (certainly NOT from a daily chart).
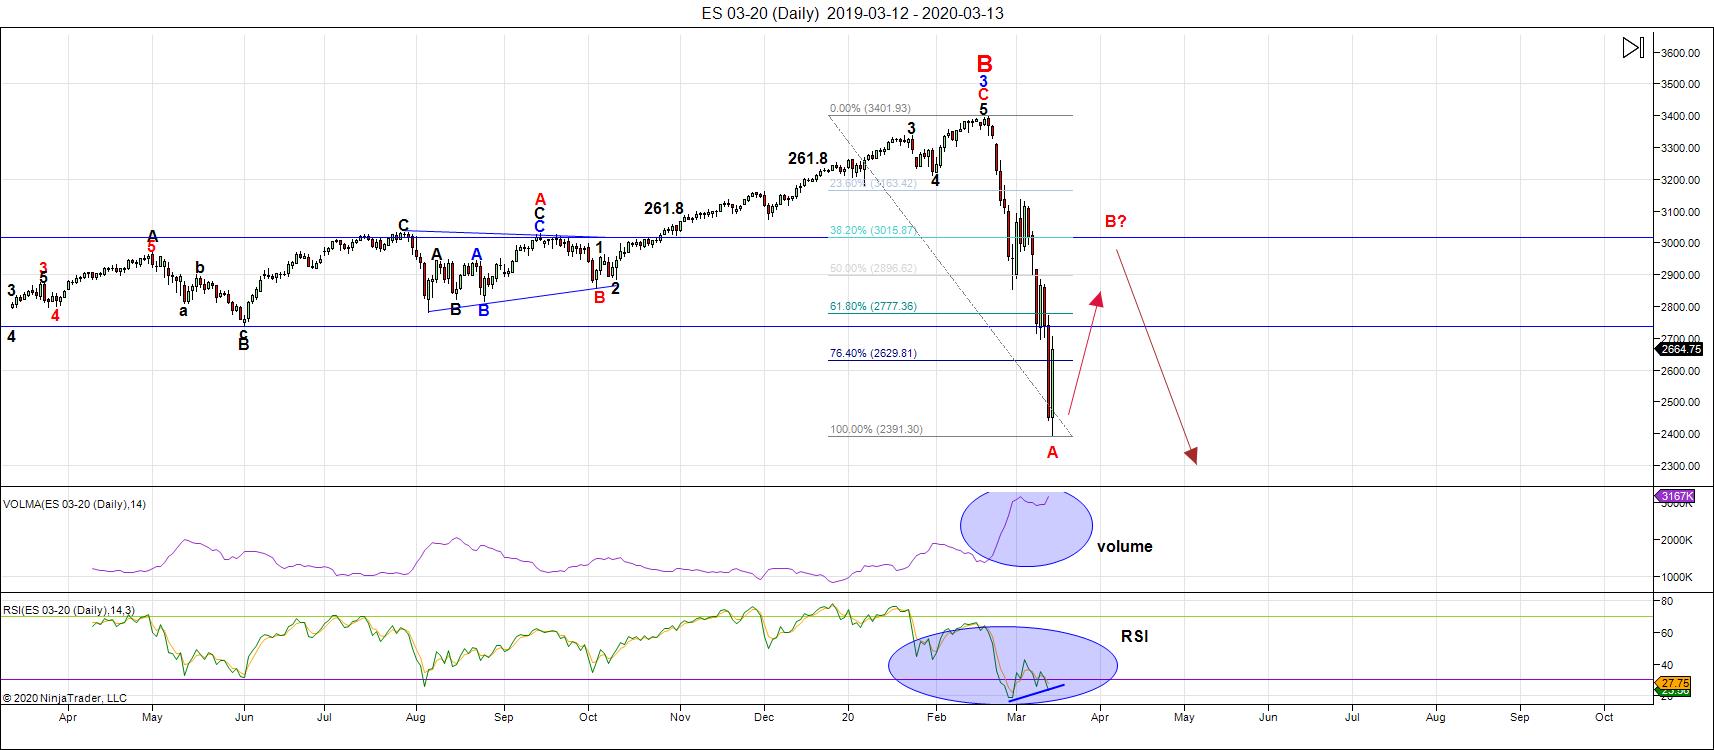
Above is the daily chart of ES (click to enlarge, as with any of my charts).
As I've said above, we have a first wave down that's a zigzag and that strongly suggests we'll end up with a triple zigzag down to the original target by the time this bear market is over, which I think (nothing firm here) is about a month away.
B waves, after the A wave down is complete, can retrace typically 38 - 80 percent of the entire first wave. The extraordinary rally, that began Thursday night in ES, is pointing to the 62% level of around 3000. Whether it makes it there, or not. is the big question.
There were always two most probable patterns for the downside: It could have been five waves down (a C wave out of an expanded flat) or a set of zigzags. Zigzags come down faster, and are more difficult to trade, because the subwaves don't necessary have fibonacci relationships to each other. The subwaves are in five waves, but don't necessarily measure out correctly and the substructure is usually not well defined.
Retraces sometimes don't make it to even the 38% retrace level, as was the case in oil, that almost reached that level in the first retrace after its initial zigzag down in mid-February of this year. But, typically they do, in fact, retrace to the 38% level, or above.
In the Elliott Wave system, you tend to ignore the first wave in a sequence from a trading perspective, because other than attempting to count waves, you often aren't sure of the length of the wave. So, you wait for the second wave retrace (or B wave in this case) of the first wave and enter there. It lowers risk, provides much more confidence in the outcome, and sets you up for the third wave (or C wave), which is by far the longest wave of the sequence. Bombs away!
But, in ignoring the first wave, you have to put the FOMO (fear of missing out) syndrome on hold! Most traders have an issue with that concept. However, you can lose more money attempting to trade a first wave than any of the other waves. There are too many unknowns.
The larger fourth wave (down from 3400) typically retraces to the area of the previous fourth wave of one lesser degree. This is the 1800 area in SPX.
Once this five wave series has bottomed, expect central bankers to react and flood the market with more debt. That will set up the fifth and final wave up to an all time new high. It will not save the stock market; central bankers will finally fail in their attempts to create a never ending bubble. Bubbles always burst and this is the biggest financial bubble in history.
___________________________
Summary: The B wave of what has the appearance of an expanded flat has topped and dropped what now appears to be the alternate pattern I've written about: a series of zigzags. I expect many major exchanges around the world to complete a bearish pattern over the next month, or so, as they tumble in tandem with the US exchange.
Expect another large drop possibly starting this week, after the current relief rally ends. I expect the ultimate bottom of this fourth wave to be somewhere around the area of 1800 in SPX.
Once we've completed the fourth wave down, we'll have a long climb to a final slight new high in a fifth wave of this 500 year cycle top.
_________________________________
Trader's Gold Subscribers get a comprehensive view of the market, including hourly (and even smaller timeframes, when appropriate) on a daily basis. They also receive updates through the comments area. I provide only the daily timeframe for the free blog, as a "snapshot" of where the market currently trades and the next move on a weekly basis.
I do a nightly video on the US indices, USD Index (and related currency pairs), gold, silver, and oil) right down to hourly charts (and even 5 minutes, when required).
______________________________________
Sign up for: The Chart Show
Next Date: Wednesday, March 18 at 5:00 pm EST (US market time)

The Chart Show is a one hour webinar in which Peter Temple provides the Elliott Wave analysis in real time for the US market, gold, silver, oil, major USD currency pairs, and more. You won't find a more accurate or comprehensive market prediction anywhere for this price.
Get caught up on the market from an Elliott Wave perspective. There’ll be a Q&A session during and at the end of the webinar and the possibility (depending on time) of taking requests.
For more information and to sign up, click here.
| "I think you are the only Elliot Wave technician on the planet who knows what he's doing.” |
| m.d. (professional trader) |
All registrants will receive the video playback of the webinar, so even if you miss it, you’ll be sent the full video replay within about an hour of its conclusion.


