
 Non-Confirmations
Friday was a very strange day from an Elliott Wave perspective.
We were supposedly in a second wave correction after a surging first wave up on Thursday that extended into the night in futures (Futures went up another 11 points overnight and then in the wee hours, collapsed into a second wave).
When the market opened Friday morning, ES was in the normal second wave correction. However, NONE of the US indices even came close to making that same correction. The SP500 didn’t even retrace to the 38% level, which normally would be an absolute minimum. I’ve never, ever, seen a non-confirmation like that between futures and cash before and it sets off a great big warning bell!
Friday morning, I’d made a comment that ES, after a slight rise, would return back to its base again, because I knew that the SP500 has not yet corrected … but it never happened. It wasn’t a bad call, it’s just that the market apparently “broke.” Futures and cash indices now have completely different patterns.
After some head-scratching, along with reviewing every relevant chart I can think of, I’ve come to this conclusion: We now appear to be in a third sub-wave up (I think so, anyway) and headed for a new high. But if waves are not going to form well, my analysis on a short-term scale may be questionable going forward.
In any event, it’s a warning to anyone in the market.
Markets in long, long corrections (like the one we’re in in the US indices) sometimes start to “break,” which is what we’re likely seeing. This kind of action supports the idea that we’re in the final sub-wave to a final high in a market that is barely holding up.
That being said, let’s look more closely (and critically) at the overall action and larger pattern.
So, what’s the pattern? I believe there are three possibilities, two more flawed than the third.
- Both cash and futures are in triangles. That would mean we’re in the D leg up with an E leg down to go before a final wave up to a new high. The flaw: This triangle pattern in only in ES, not NQ, and the cash indices don’t really support a triangle (they all look different and the ones any triangles don’t have the right shape).
- We’re in a second wave up after already topping, which means we’ll only partially retrace before turning down for good to finally complete the larger fourth wave down to the 1900s. The flaw: This scenario would work for some of the cash indices, but doesn’t work for futures (both ES and NQ), because the most recent wave down is clearly corrective and needs to be retraced to a new high. Currency pairs also have one more wave to go to complete their current corrective patterns.
- We’ve completed an ABC fourth wave down from the 2965 level in ES (and similar levels in the US indices) and have one more fifth wave high to trace out. The flaw: the shape of the waves up, as of Friday, is looking corrective overall (like a zigzag), because we didn’t get the expected second wave.Well, I’ve seen this pattern play out in a really sick market before, where the final wave doesn’t trace out perfectly, but rather “shoots up” to a final high. (I’ve just not ever seen futures go “out-of-sync,” tracing out a second wave while the cash indices don’t). Taking everything into account, a fifth wave up is the most likely scenario, particularly with what the US Dollar Index is doing and the fact that currency pairs have one more wave to go to complete their current trends.
The bottom line is that I believe we’re now in the final fifth wave up, headed for a new and final high above the 2965 level in ES. This means all the US indices will need to get to a similar new high, which will send some indices higher than others. When complete, it will result in a dramatic turn to the downside once their all achieve their objectives.
_______________________________
All the Same Market.
I’ve been mentioning for months now that the entire market is moving as one entity, the “all the same market” scenario, a phrase that Robert Prechter coined many years ago, when he projected the upcoming crash.
We’re in the midst of deleveraging the enormous debt around the world. Central banks are losing the control they had and we’re slowly sinking into deflation world-wide, with Europe in the lead.
The US dollar is fully in charge of both the equities and currencies markets. They’re all moving in tandem, as I’ve been saying since September of 2017. Over the past three years, their movements have been moving closer and closer together and one, and now they’re in lock-step, with the major turns happening at about the same time.
it’s challenging because often times currency pairs are waiting for equities to turn, and other times, it’s the opposite. The other frustrating thing is that in between the major turns, there are no major trades; they’re all, for the most part day-trades. That’s certainly the case in corrections, where you very often have several possible targets for the end of the correction.
We’re now very close to a turn in the US indices, currency pairs, and oil. Gold looks like it’s still on hold a little longer. Elliott wave does not have a reliable timing aspect, but it looks like we should see a top in the early part of the coming week.
Know the Past. See the Future
_________________________________
Elliott Wave Basics
Here is a page dedicated to a relatively basic description of the Elliott Wave Principle. You’ll also find a link to the book by Bob Prechter and A. J. Frost.
______________________________
The best of them JL 2
The best of them …Last couple of years, I subscribed to several ‘market traders’. You are by far the best of them and the personal contact is awesome. Daily and daily updates are very well written! Besides your expertise in EW, I also like your cycles analysis. Best investment I ever made! —JL |
Couldn’t be happier … KK 2
Couldn’t be happier …The analysis and insight you provide is simply amazing! I’ve been trading the futures and equity markets for well over thirty years and usually average around 5% monthly. Since joining your Traders Gold Service two months ago, that number has better than doubled. I couldn’t be happier.—KK |
Get an upper hand … JC 2
Get an upper hand in trading …Seeing all the different currency pairs and the wave structures and hearing you explain why this has to do that on a nightly bases gives one a upper hand when trading. Elliott Wave applies to all stock and indices and can be applied to any candlestick chart. If someone ask what you want for Christmas – Tell them a membership to Peter’s “Traders Gold!”—JC |
Rise above the rest … SM 2
Rise above the rest …I have only ever met a few people who, in their chosen fields (astrology, medicine, music, martial arts, technical analysis), rise above all the rest and you are one of them…you have ‘the gift’…and that’s why I’m a Trader’s Gold member. —SM |
Tops in your field DZ 2
Tops in your field …You are tops in your field. Tried to follow Elliot Wave international for years. They were always behind the market. After discovering you, I perceive that you are an expert in reading the waves, which puts you way ahead of the rest of your peers. And you can read the Waves like you are reading tomorrow’s financial section. I pray you stay healthy. —DZ |
the real deal SM 2
The real deal …‘Educational, insightful and thorough market analysis for all levels of traders. It’s Elliott Wave at its best….Peter Temple is the real deal’ —SM |
Have not had a losing week RW 2
Have not had a losing week …I have been with Peter almost a year. The only thing that matters is have I made money with his service. I think I have finally turned the corner using Peter’s EW. I have not had a losing week in the last 5 months. Thanks Peter, for your amazing amount of hard work. —RW |
A true expert in Elliott Wave FL 2
A true expert in Elliott Wave …You are a true expert in EW analysis. What you provide is not available anywhere and is priceless. Subscription on your services is the best thing I have ever done. Many thanks for your effort to make me a better investor. I now have more trust in my investment decisions. I hope you will continue the excellent work! —FL |
US Market Snapshot (based on end-of-week wave structure)
This chart is posted to provide a prediction of future market direction. DO NOT trade based upon the information presented here (certainly NOT from a daily chart).
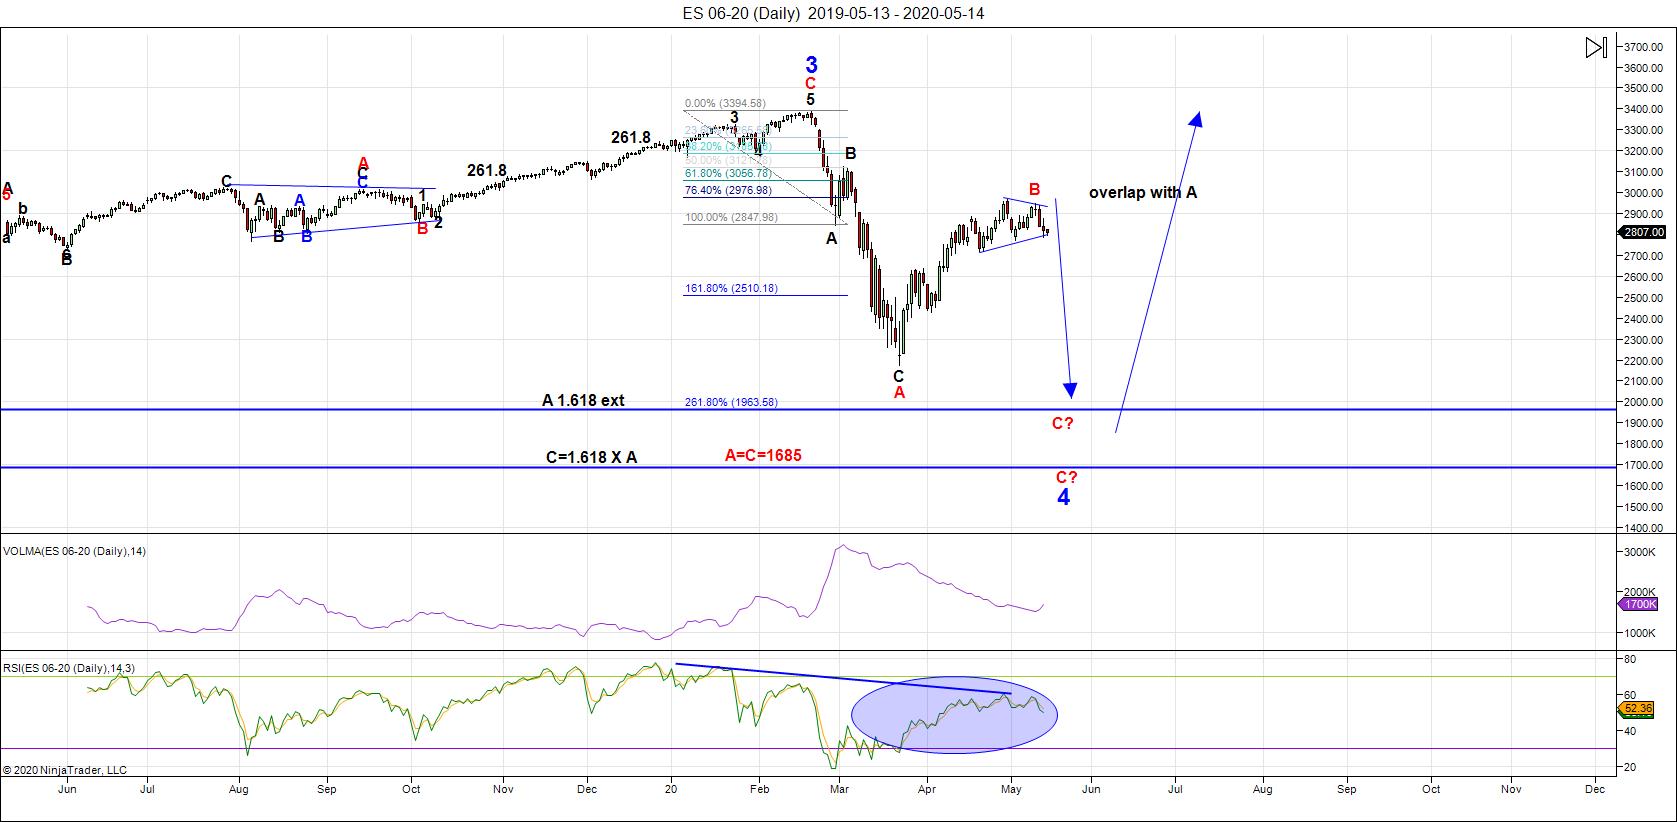
Above is the daily chart of ES (click to enlarge, as with any of my charts).
The US indices are clearly on their last legs. On Friday, we had what appeared to be a non-confirmation between ES and the SP500, with what appears to be different counts. As well, these two sisters have different tops near the 62% level, with a difference of 16 points, even when taking into account the differential.
Overnight on Thursday, ES corrected in what appears to have been the expected second wave after tracing out a third wave. However, the SP500 had no real second wave correction and instead continued the rally. This gives ES the appearance of a possible motive first and second wave, while cash traced out what's looking more like a zizgag.
This is the first time I've ever seen futures and cash with what may amount to different counts. This is the sign of a very sick market and suggests the final top on this correction is near at hand.
The other issue this weekend is the questionable count in the US indices. There are potential triangles in some indices, while in others the potential triangles don't have "the right look."
Under the surface, this market appears to be falling apart.
While there are several possible counts (and patterns) to consider, most are flawed. The bottom line is that the waves down in the US indices are corrective and look like various versions of a fourth wave waiting for a fifth to a new high. After several hours of analysis, that's my projection — a new high appears to be in the works for all the US indices. When complete, it will result in a turn down into the long awaited bear drop to new lows.
We're witnessing the "All the Same Market" syndrome, where virtually everything is moving in tandem with the US Dollar Index. The problem over the past few weeks has been the fact that the US Dollar index is in a horizontal triangle. You can't take much guidance from sideways movement.
I'm looking ahead to next week as perhaps being more important than the past several.
The zigzags down from the 3400 area in the SP500 took a month for the entire trip. This correction has now almost taken two months, something that is HIGHLY unusual and speaks to the manipulation of the Federal Reserve and the influence on the US Dollar.
As I stated last week: There's a lot of manipulation going on (the Federal Reserve is doing whatever it can to prop up the market with more debt — a very stupid idea, and you and I will pay for it in the end. Inflation through the extraordinary "printing" of debt has had its affect on the market overall. However, the problem is simply too humongous (the dollar is worldwide) and the Fed will fail. We're getting close to seeing the result.
___________________________
Summary: We appear to be in a "combination" fourth wave down from the 3400 area. After the first set of zigzags down, we retraced 62% of the distance from the top. We've been sitting in this corrective ABC retrace for almost two months. However, it's showing signs of a top nearby at the same time it's showing underlying stress — it's close to falling apart.
I'm looking for a top nearby, and next week looks important. Once we top, another set of zigzags down seems to be the most probable outcome for the journey to a new low, but it's early to be sure of the pattern.
Look for a new low below 2100: There are several possible measured objectives below that point. The timeframe has moved to early June, perhaps, for a final low.
Once we've completed the fourth wave down, we'll have a long climb to a final slight new high in a fifth wave of this 500 year cycle top.
_________________________________
Trader's Gold Subscribers get a comprehensive view of the market, including hourly (and even smaller timeframes, when appropriate) on a daily basis. They also receive updates through the comments area. I provide only the daily timeframe for the free blog, as a "snapshot" of where the market currently trades and the next move on a weekly basis.
I do a nightly video on the US indices, USD Index (and related currency pairs), gold, silver, and oil) right down to hourly charts (and even 5 minutes, when required).
______________________________________
Upcoming Webinar — May 26/28, 2020

It's free! Click here for more information and to sign up.


