
 A Week of Fake-Outs!
I warned last weekend about the craziness. It continues. This time, I’m referring to the market; never mind what’s happening outside in the unreal world …
I’ve put in about 60 hours this week on the market and analysis — the most ever, I think. That’s an indicator of how incredibly difficult this market is. There were fake-outs all week long … mostly a result of a zigzag down from last week.
Zigzags are like politicians — they promise one thing but can deliver something quite different.
Last weekend, I predicted the drop. We got that … sort of. But the wave down was too short, and it “looked like” a five, but was actually a zigzag. The problem with zigzags is that they can either generate another zigzag to follow (in this case, to the downside), or they can completely retrace. You have no way of knowing which will be the case. On Friday of this past week, it became obvious that we were going to do the latter.
This past week has been brutal in two respects:
- The e-mini futures market has been almost impossible to accurately predict due to the gaps in all the US indices, some extraordinary patterns in futures themselves, and wave structures that are simply ambiguous (like the zigzag)
- Currencies and the US Dollar index, all of which have been oscillating up and down
The other issue, of course is the market manipulation. The Fed has been trying to keep the market up. You can see this in some of the extraordinary bullish wave lengths this past week. The wave up this week in ES has been one for the EW history books — double extended waves as part of a fifth wave (which are traditionally very weak waves) in a correction.
A fifth wave of that level of bullishness as part of a correction tells you something extraordinary is going on. I attribute it to the actions of the Federal Reserve is attempting to prop up the market, along with the propaganda around this virus (no, the economy is NOT going to bounce back to its old self!).
In truth, nothing much has really changed from last week. It’s the fake-outs just about every day this week that have been the challenge.
Hopefully, we’re going to get back to a more predictable market once we see this next turn across just about everything (perhaps not gold quite yet).
In any event, I stepped back on Friday and decided to review the bigger picture so that we all know where both the Nasdaq and NYSE are going longer-term. It’s really important to keep the larger picture in the back of your mind so that the shorter timeframe has the support of the larger trend.
So … here’s a relatively short video that just deals with that issue …
Big Picture Video
BigPicMay112020  |
 |
Make sure you zoom the video to full size with frame expander (arrows) in the bottom right hand corner and also set the quality to as high as your web connection allows. This is a high definition (HD) quality video so the best viewing is at that level. |
_______________________________
All the Same Market.
I’ve been mentioning for months now that the entire market is moving as one entity, the “all the same market” scenario, a phrase that Robert Prechter coined many years ago, when he projected the upcoming crash.
We’re in the midst of deleveraging the enormous debt around the world. Central banks are losing the control they had and we’re slowly sinking into deflation world-wide, with Europe in the lead.
The US dollar is fully in charge of both the equities and currencies markets. They’re all moving in tandem, as I’ve been saying since September of 2017. Over the past three years, their movements have been moving closer and closer together and one, and now they’re in lock-step, with the major turns happening at about the same time.
it’s challenging because often times currency pairs are waiting for equities to turn, and other times, it’s the opposite. The other frustrating thing is that in between the major turns, there are no major trades; they’re all, for the most part day-trades. That’s certainly the case in corrections, where you very often have several possible targets for the end of the correction.
We’re now very close to a turn in the US indices, currency pairs, and oil. Gold looks like it’s still on hold a little longer. Elliott wave does not have a reliable timing aspect, but it looks like we should see a top in the early part of the coming week.
Know the Past. See the Future
_________________________________
Elliott Wave Basics
Here is a page dedicated to a relatively basic description of the Elliott Wave Principle. You’ll also find a link to the book by Bob Prechter and A. J. Frost.
______________________________
A true expert in Elliott Wave FL 2
A true expert in Elliott Wave …You are a true expert in EW analysis. What you provide is not available anywhere and is priceless. Subscription on your services is the best thing I have ever done. Many thanks for your effort to make me a better investor. I now have more trust in my investment decisions. I hope you will continue the excellent work! —FL |
Couldn’t be happier … KK 2
Couldn’t be happier …The analysis and insight you provide is simply amazing! I’ve been trading the futures and equity markets for well over thirty years and usually average around 5% monthly. Since joining your Traders Gold Service two months ago, that number has better than doubled. I couldn’t be happier.—KK |
Rise above the rest … SM 2
Rise above the rest …I have only ever met a few people who, in their chosen fields (astrology, medicine, music, martial arts, technical analysis), rise above all the rest and you are one of them…you have ‘the gift’…and that’s why I’m a Trader’s Gold member. —SM |
Tops in your field DZ 2
Tops in your field …You are tops in your field. Tried to follow Elliot Wave international for years. They were always behind the market. After discovering you, I perceive that you are an expert in reading the waves, which puts you way ahead of the rest of your peers. And you can read the Waves like you are reading tomorrow’s financial section. I pray you stay healthy. —DZ |
Have not had a losing week RW 2
Have not had a losing week …I have been with Peter almost a year. The only thing that matters is have I made money with his service. I think I have finally turned the corner using Peter’s EW. I have not had a losing week in the last 5 months. Thanks Peter, for your amazing amount of hard work. —RW |
The best of them JL 2
The best of them …Last couple of years, I subscribed to several ‘market traders’. You are by far the best of them and the personal contact is awesome. Daily and daily updates are very well written! Besides your expertise in EW, I also like your cycles analysis. Best investment I ever made! —JL |
Get an upper hand … JC 2
Get an upper hand in trading …Seeing all the different currency pairs and the wave structures and hearing you explain why this has to do that on a nightly bases gives one a upper hand when trading. Elliott Wave applies to all stock and indices and can be applied to any candlestick chart. If someone ask what you want for Christmas – Tell them a membership to Peter’s “Traders Gold!”—JC |
the real deal SM 2
The real deal …‘Educational, insightful and thorough market analysis for all levels of traders. It’s Elliott Wave at its best….Peter Temple is the real deal’ —SM |
US Market Snapshot (based on end-of-week wave structure)
This chart is posted to provide a prediction of future market direction. DO NOT trade based upon the information presented here (certainly NOT from a daily chart).
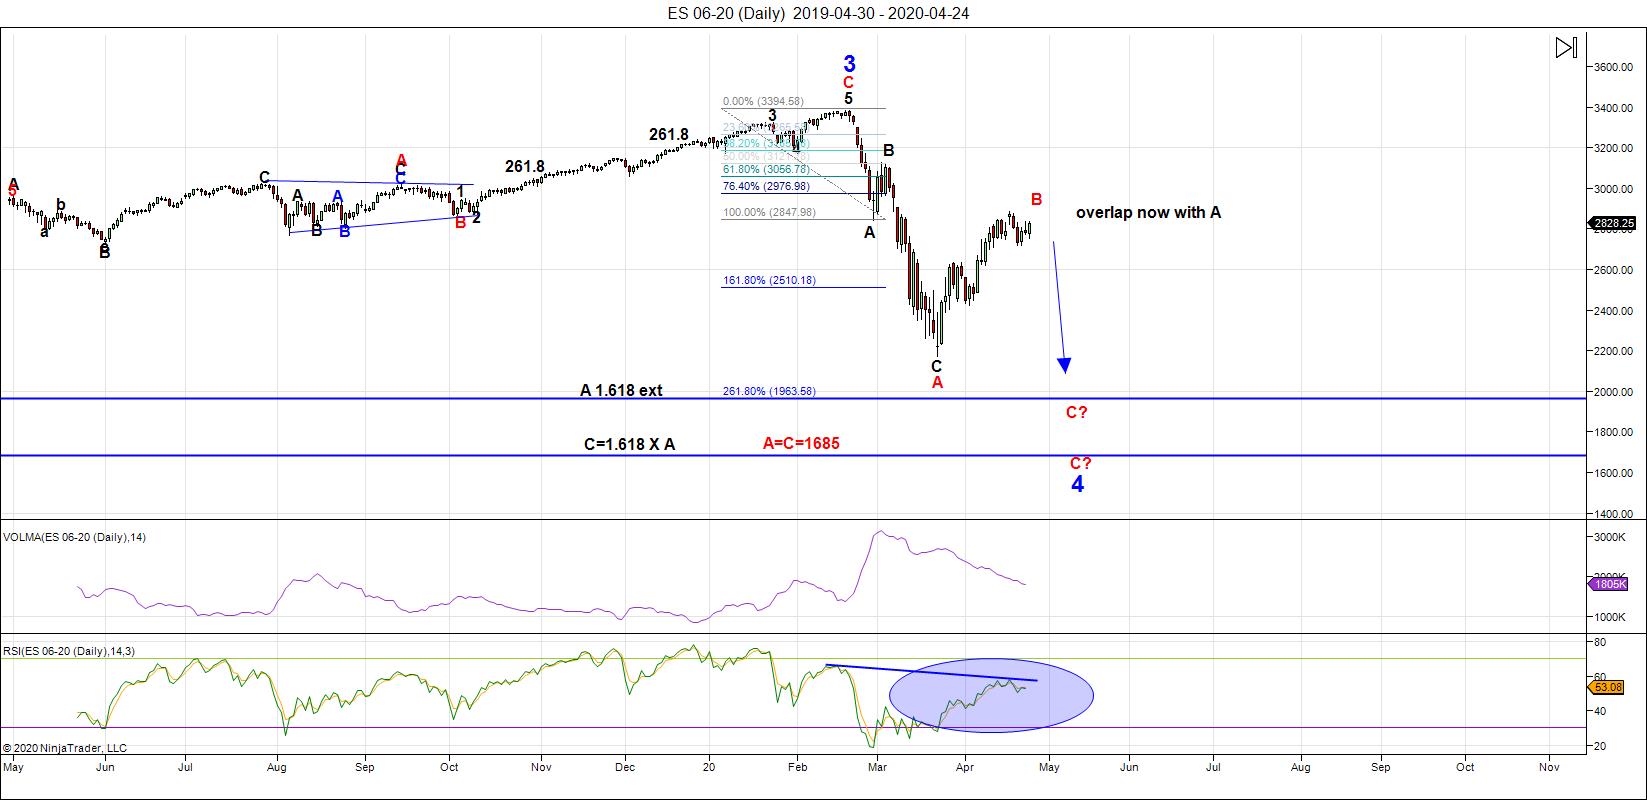
Above is the daily chart of ES (click to enlarge, as with any of my charts).
This has been a week of extraordinary fake-outs, particularly in e-mini futures. We've ended up the week at about the same place we were a week ago Friday.
We have a double zigzag pattern down from the 3400 top area in an ABC corrective pattern. I'm expecting one more pattern down to a new low in this fourth wave. While I haven't labelled the most recent correction up to the 62% retrace level from the red A wave low, it's an ABC pattern, with the C wave consisting of five waves.
I'm expecting a slight new high in ES after a week in which we saw a zigzag down from the current high of the ABC correction at 2965. Zigzags are an issue at a time where we're expecting a set of zigzags down to complete the balance of the large fourth wave down from the 3400 area.
That's because zigzags are corrective waves. You can have up to three in a row, each following the other after a small correction, or you can have just one that completely retraces. The wave down this week from May 30th was the latter. As a result, we're headed back up to the 2965 start. Once we get there, I'm expecting ... finally ... a turn down leading to the large drop we've been expecting, to new lows.
As I stated last week: There's a lot of manipulation going on (the Federal Reserve is doing whatever it can to prop up the market with more debt — a very stupid idea, and you and I will pay for it in the end.
For the short term, it's created a huge retrace that has lasted about a month and a half, while the waves down from the 3400 top lasted only a month.
___________________________
Summary: We appear to be in a "combination" fourth wave down from the 3400 area. After the first set of zigzags down, we retraced 62% of the distance from the top. That led to a turn down, but apparently in a fourth wave, which seems to be leading to a complete retrace back up.
Once we top, another set of zigzags down seems to be the most probable outcome for the journey to a new low, but it's early to be sure of the pattern.
Look for a new low below 2100: There are several possible measured objectives below that point. The timeframe has moved to early June, perhaps, for a final low.
Once we've completed the fourth wave down, we'll have a long climb to a final slight new high in a fifth wave of this 500 year cycle top.
_________________________________
Trader's Gold Subscribers get a comprehensive view of the market, including hourly (and even smaller timeframes, when appropriate) on a daily basis. They also receive updates through the comments area. I provide only the daily timeframe for the free blog, as a "snapshot" of where the market currently trades and the next move on a weekly basis.
I do a nightly video on the US indices, USD Index (and related currency pairs), gold, silver, and oil) right down to hourly charts (and even 5 minutes, when required).
______________________________________
Upcoming Webinar — May 26/28, 2020

It's free! Click here for more information and to sign up.


