
Update Friday, May 20, 2PM, EST
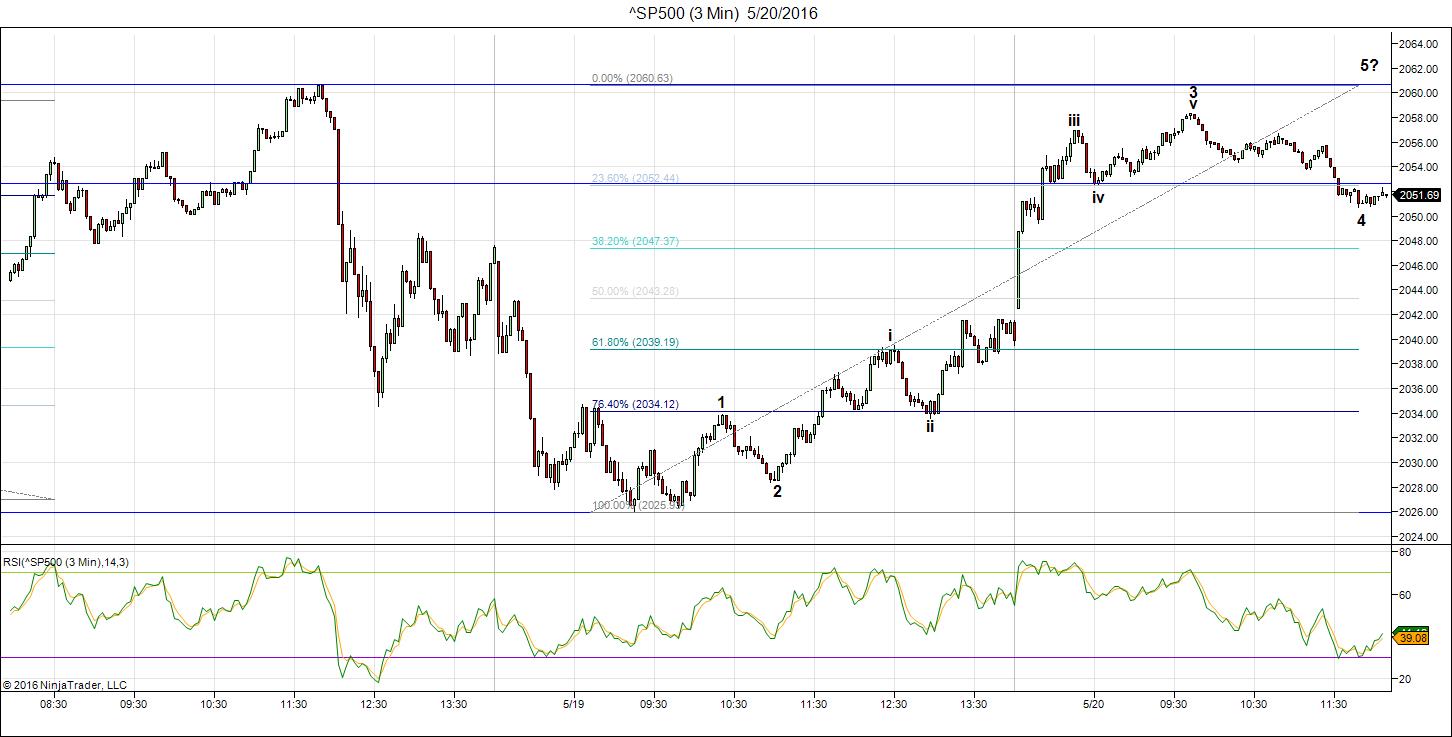
Above is the 3 minute chart of the SP500 showing my count so far. I’m still expecting a fifth wave to unfold if this count is correct.
___________________________
Update Friday, May 20, 10:30AM EST
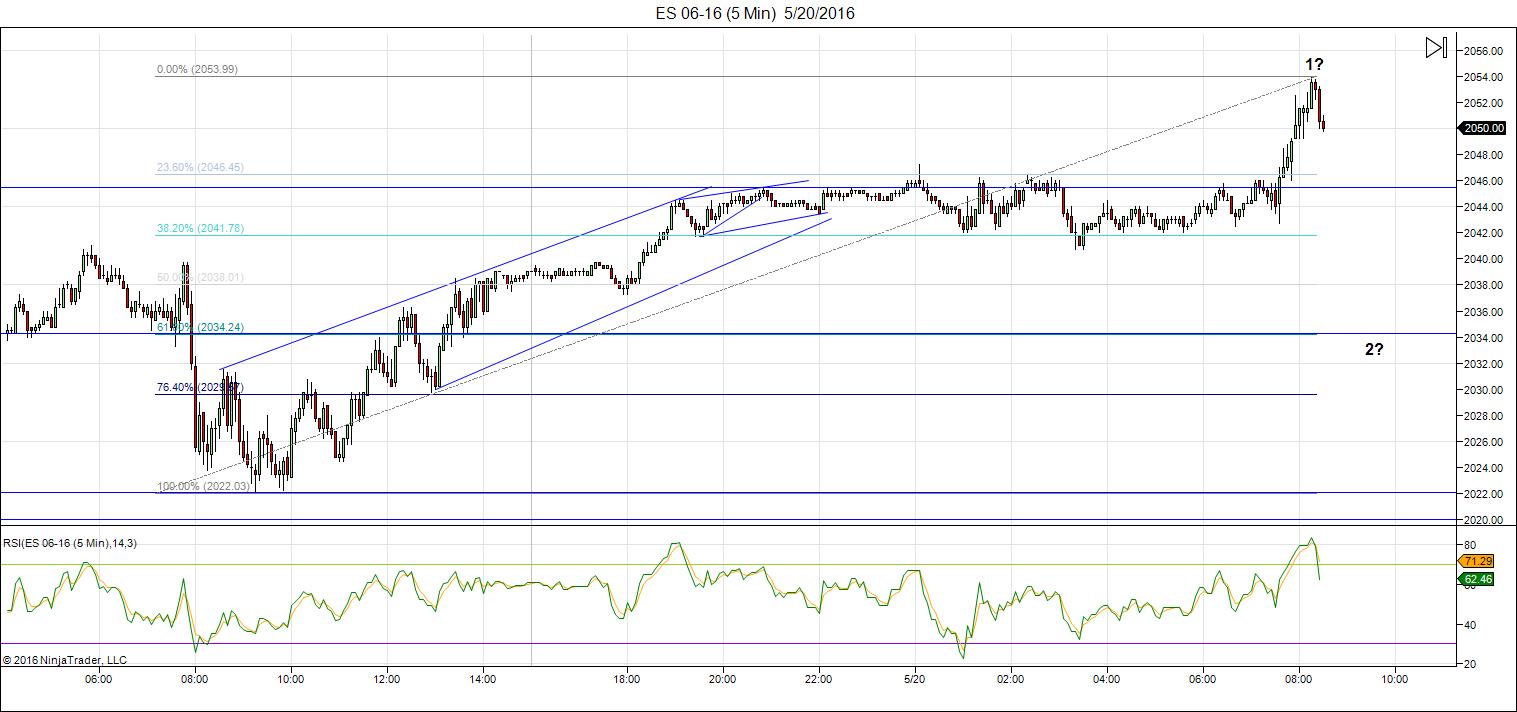
Above is the 5 minute chart of ES (emini futures of SPX) showing the wave to 10:30 AM. We now arguably have 5 waves up to about the 38% level (the typical stopping point for a 1st wave.
We now need to see a wave down ~62% to ~2034 to confirm a second wave. Then we’ll be expecting the 3rd wave up, which should be at least 1.618 X the first wave. That’s if this is going to be a typical ending wave up in 5 waves. That would be great, but unexpected, with everything we’ve gone through. We wait for more clues.
________________________
Update Thursday, May 19, After the Close
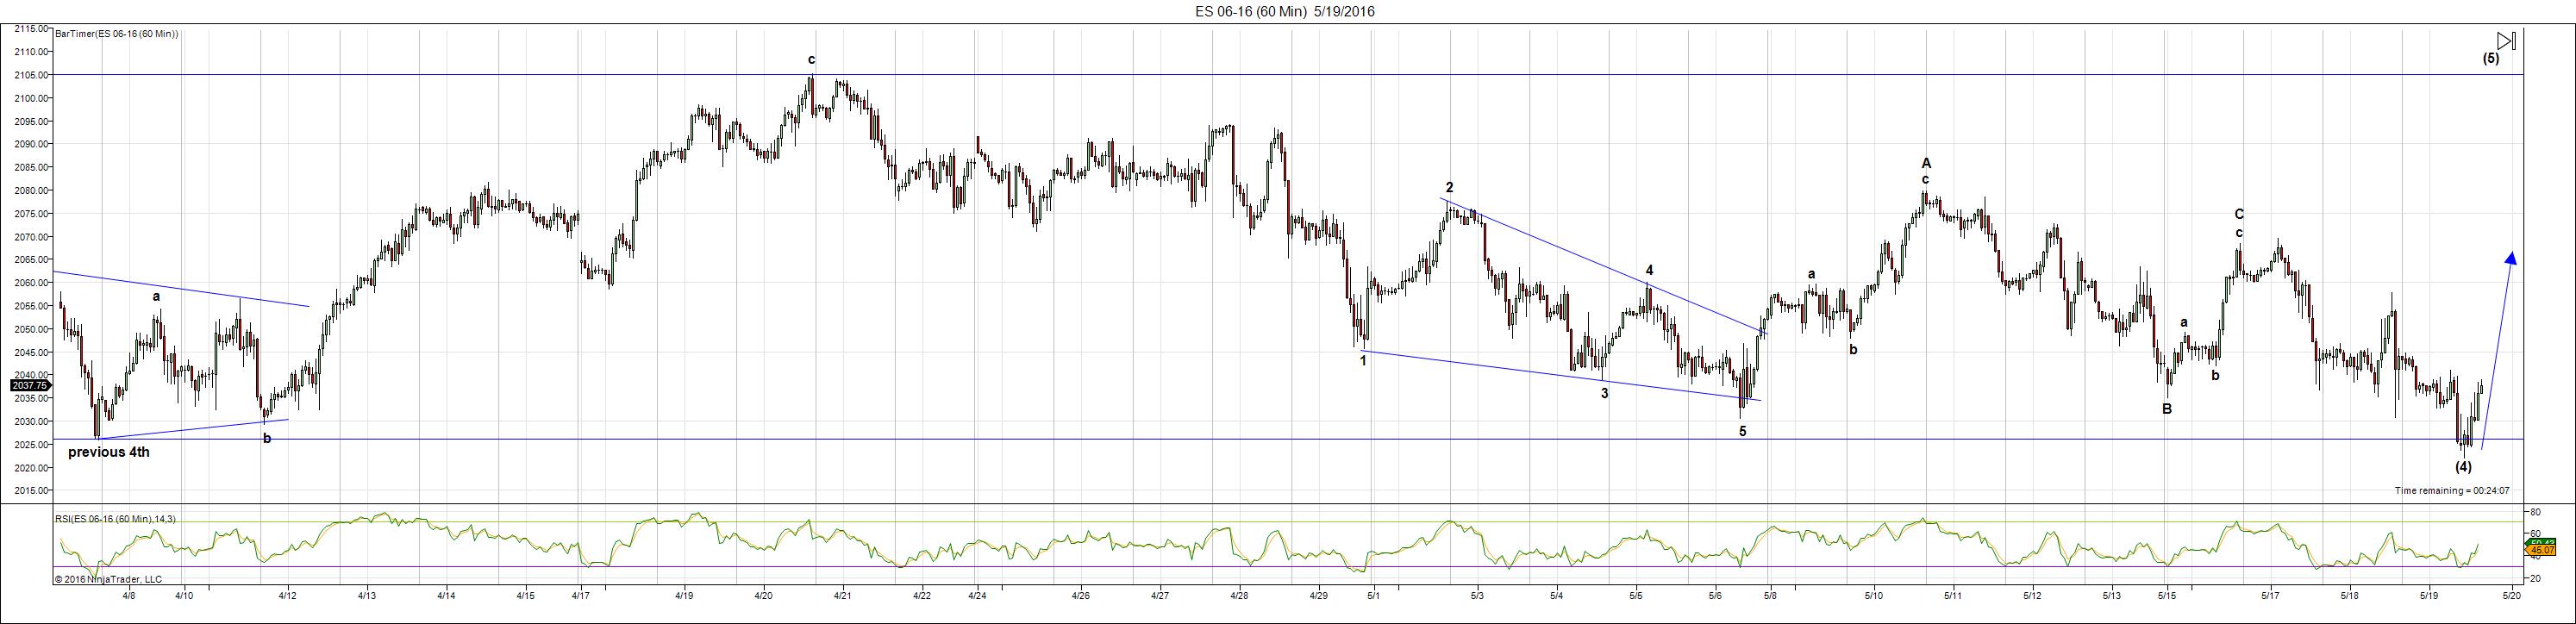
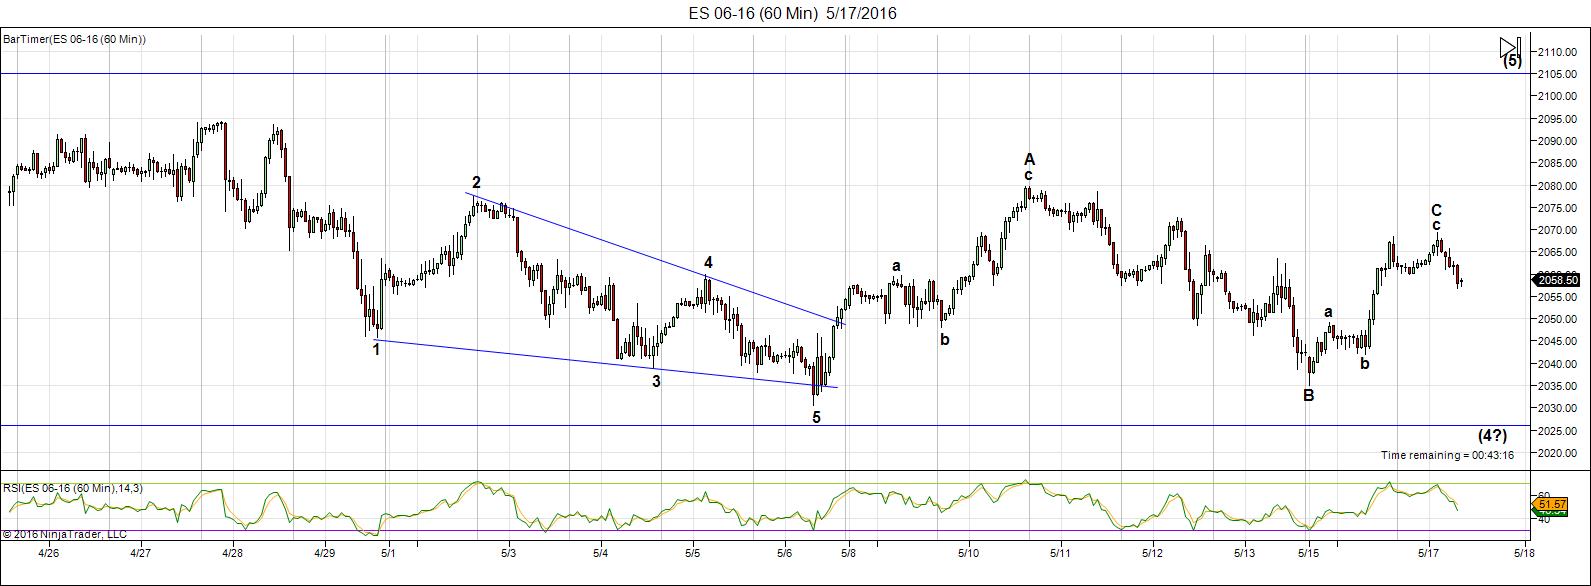
Above is the 60 minute chart of ES (emini futures of SPX). This shows the entire failed wave from the previous fourth wave at 2026 up to 2105. I’ve now labelled it as an abc configuration. The long fourth wave down follows. You can see that we’ve bottomed at the previous 4th wave, as expected.
Today we rallied, but the rally is in overlapping waves, so it should drop back down to a double bottom before heading back up in a real rally. The 5th wave up should go up in 5 waves.
Although I refer to the wave down as a fourth wave, it’s really a B wave in an ABC configuration from Feb 11. We’ve always known this was a corrective wave up. The “4th wave” is so large that it overpowers everything else (so it’s a B wave), and there is no question that we will have a C wave unfolding now. I’ll post more on this on the weekend.
_______________________
Update Thursday, May 19, Before the Open
My main computer is still down and it will go back into the shop this morning. I’m unable to post futures this morning. However, they’re down as expected and should complete this final C wave of the drop today.
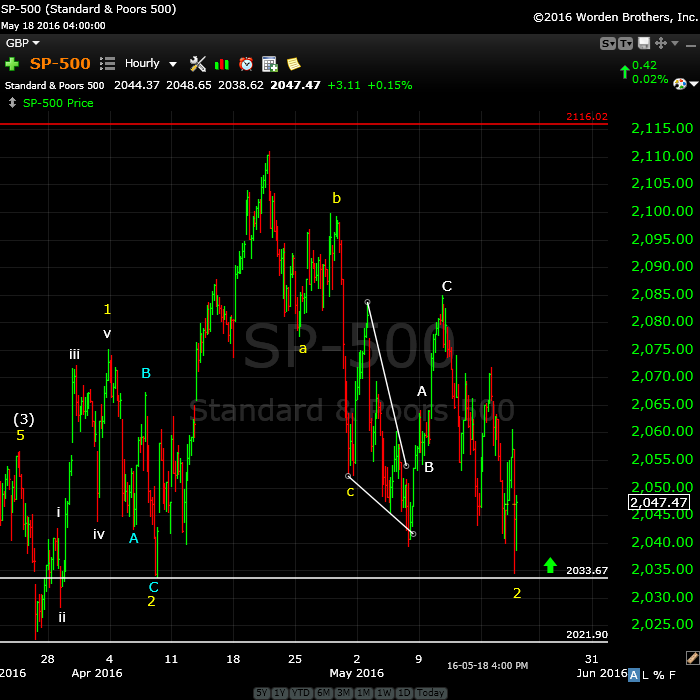
Above is the hourly chart of the SP500. I don’t know where it will finally settle, but I think it’s more likely to be 2033. The bottom of the fourth wave is ~2022. Below that would mean something else is happening, but my call is for a turn up. With the SP500, we had a valid first wave up in the left of the chart, so it can correct only to the 2nd wave bottom, which is valid under the circumstances. This would mean three waves up to the top in a fifth wave.
The Nasdaq also appears to be in a second wave position and could maintain it, which would put these two indices in sync. We’ll see what happens.
All the waves are are in 3 wave configurations. It’s interesting for me to note that the ending diagonal that we flagged (converging trendlines) was not in fact an ending diagonal (it’s not at the end of a C or 5th wave). I had reservations at the time and expected another wave up if it fact it was going to complete a diagonal. The internal waves were not correct. We didn’t get that final wave and it went on to do five waves up, which was the sign we would continue up higher.
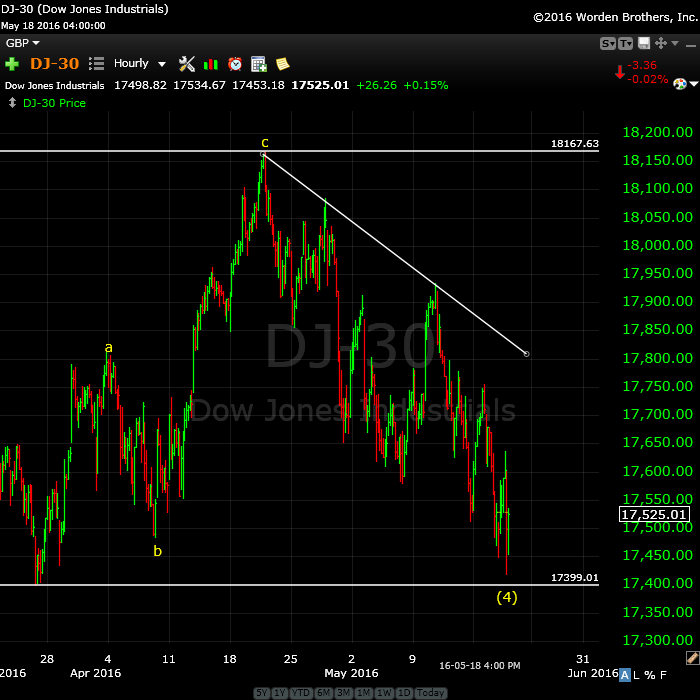
Above is the 1 hour chart of the DOW. We dropped as forecast, but I would expect a bit more downside this morning to allow us to bottom at the previous fourth wave shown. Then we should head up in a 5th wave. I would expect the DOW to meet the 17399 target or exceed it slightly.
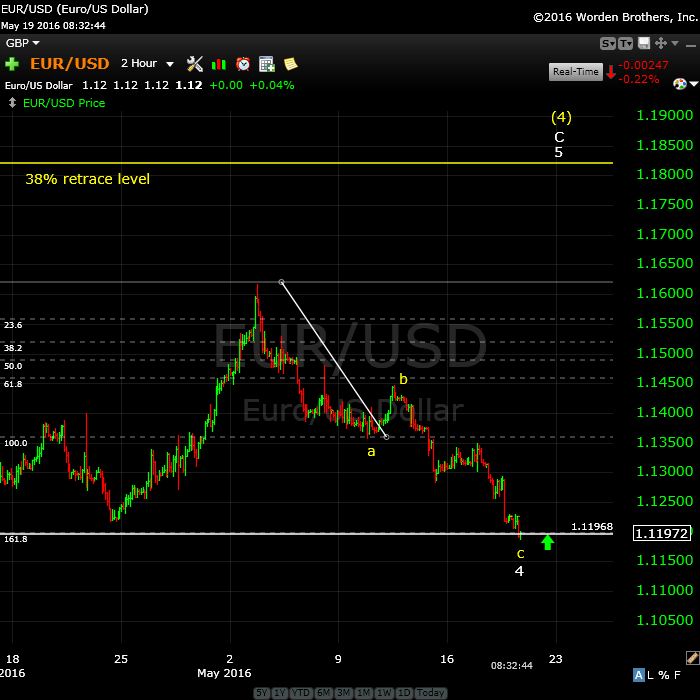
Above is the 2 hour chart of the EURUSD. This is the important chart for me today (along with AUDUSD). Both of them have reached the target (CAD is also on its way, but I think has a bit more work to do). The EURUSD chart shows 3 waves down to the previous 4th wave. I’m expecting a turn up here to head towards the 38% retrace level that I’ve mentioned before.
_____________________
Update: Tuesday, May 17, Before the Open
Above is the 60 minute chart of ES (SPX emini futures). Overnight, futures turned down after a double zigzag wave up. The key for me is that currencies also turned as predicted and appear to be finishing off the abc waves that they’d begun at the beginning of May.
The wave up is in three waves so I would expect the entire wave to retrace in parallel with currencies completing their abc correction (charts for currencies—EURUSD and USDCAD—are below).
___________________________
Update: Monday, May 16, After the Close
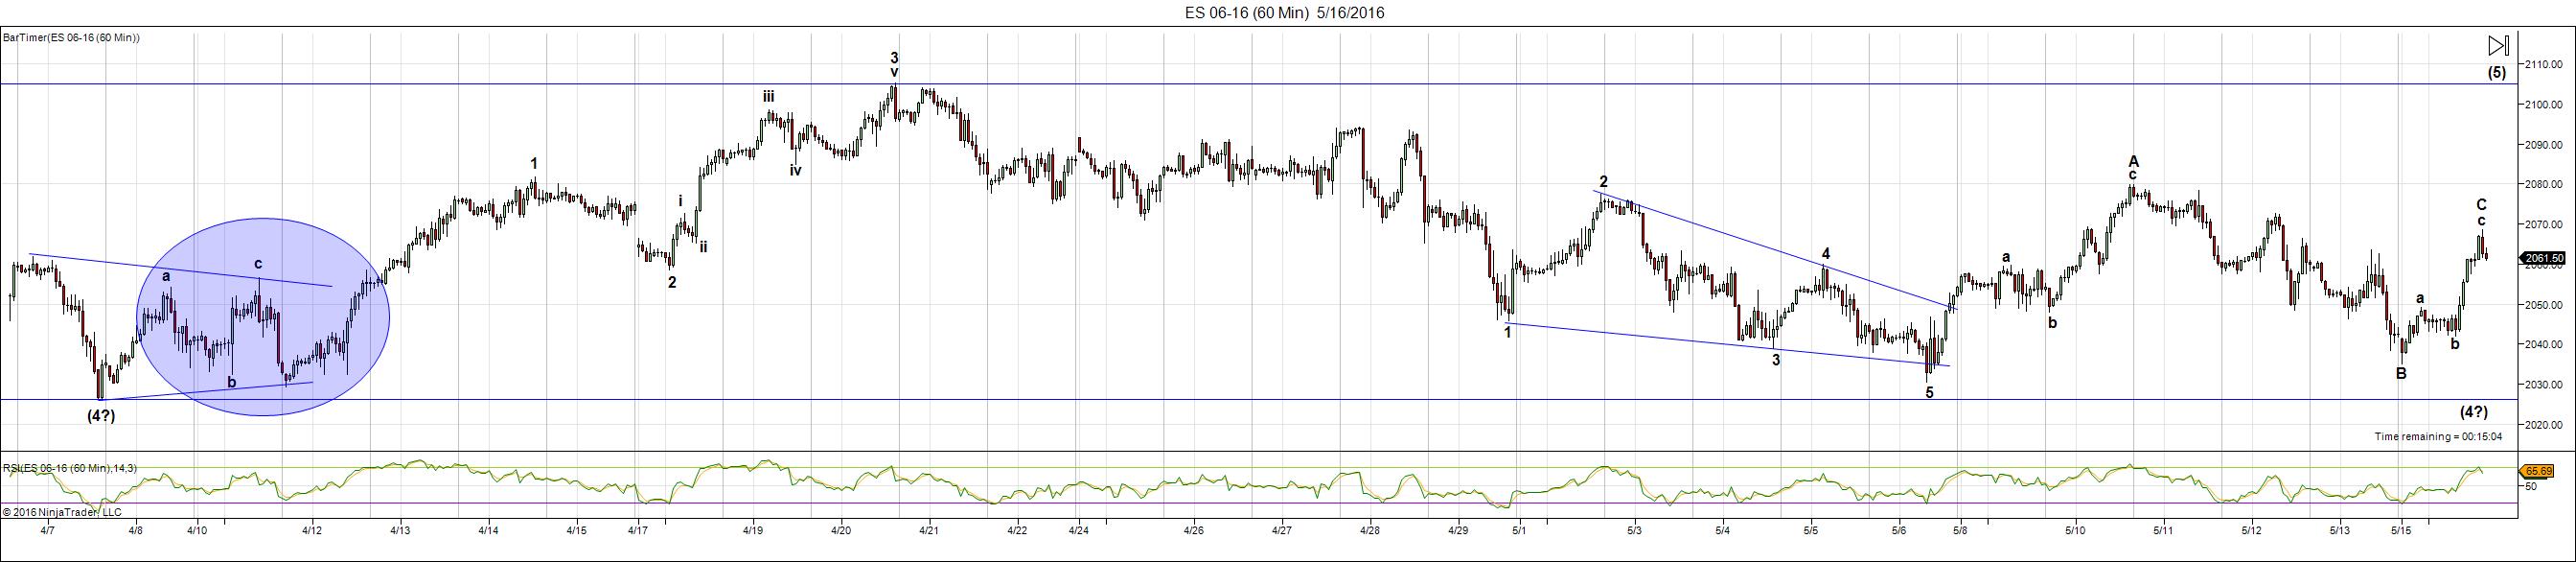
Above is the 60 minute chart of ES (SPX emini futures). Way over on the right on the chart, you can see today’s rally. Click on the chart to expand it.
The futures (YM, ES, and NQ) all had an abc bear market rally up today. Waves in 3 retrace and at the end of the day, it looks like we topped. We should retrace down the full length of this wave up.
I’ve made the comment that the waves haven’t bottomed properly. In Elliottwave, when a wave bottoms, we start the count over. Right now, we have a count that doesn’t make sense. It looks like a failed 5th wave. We got as far as (almost) completing the third wave up April 20 and, in fact, the final wave of that third wave was in 3 waves. There was no fifth wave. So we have a “failed wave” attempt at a top.
The wave down from that date has been corrective, but to “zero out” that failed wave, it’s got to bottom at the previous 4th—marked on the chart as (4).
The DOW has a similar issue in that it fell out of its triangle on Friday, but also has not bottomed properly.
So I expect today’s rally to retrace and after that, I expect a fifth wave to form and take us back to the top.
The alternative would be to keep going up, which could work OK for the SP500, because it’s in a triangle (triangle have waves in 3’s). But nothing else is in a triangle, so a fifth wave up for them would have to be in five waves. We don’t have that.
I hope this gives you and idea of what’s involved in the analysis. I can’t at the moment see any other workable alternative other than to come back down and bottom properly.
____________________________
Original Post: (Sunday, May 15)
All the Same Market. I’ve been mentioning for months now that the entire market is moving as one entity, the “all the same market” scenario, a phrase that Robert Prechter coined many years ago, when he projected the upcoming crash.
We’re starting to deleverage the enormous debt around the world. Central banks are losing the control they had and we’re slowly sinking into deflation world-wide, with Europe in the lead.
The US dollar is fully in charge of both the equities and currencies markets. They’re all moving in tandem, as I’ve been saying since September of last year. For a short while, currencies were moving contra to the US market, but for the two months or so, they’ve been moving together.
The most recent move up in the US dollar is in 3 waves, so it must retrace (chart below). EURUSD mirrors the dollar and it’s done the same thing. All the US indices, GDOW, and currencies are projecting one more wave up in equities.
US Market: All the major indices are within the previous fourth wave area, but have not reached the previous 4th wave level, which would be a logical target. There are two options here:
- a triangle (which could either be a regular 4th wave triangle, or an ending diagonal)
- a fifth wave (up in 5 waves).
There is nothing to stop us from falling our of the triangle the SP500 is now in. It could fall a bit further and create a barrier triangle (a horizontal trendline at the bottom), rather than a contracting triangle (that’s when the trendlines converge symmetrically). Or it could fall a little further to set up for a 5th wave (in 5 waves) up. With triangles, the 5th wave up is in 3 waves.
It’s up to the market here, of course, what it decides to do, but we haven’t reached a bottom yet, although we appear to be very close.
______________________________
Here’s a video overview of the market for Monday, May 16, 2016:
Market Report for May 16, 2016  |
 |
Make sure you zoom the video to full size with frame expander (arrows) in the bottom right hand corner and also set the quality to as high as your web connection allows. This is an HD quality video so the best viewing is at that level. |
_______________________________
The Charts Going into Monday
This past week, the highest probability was that we were in a fourth wave triangle. Friday afternoon, the DOW fell out of the triangle and it was clear that the US indices are still finding the fourth wave bottom.
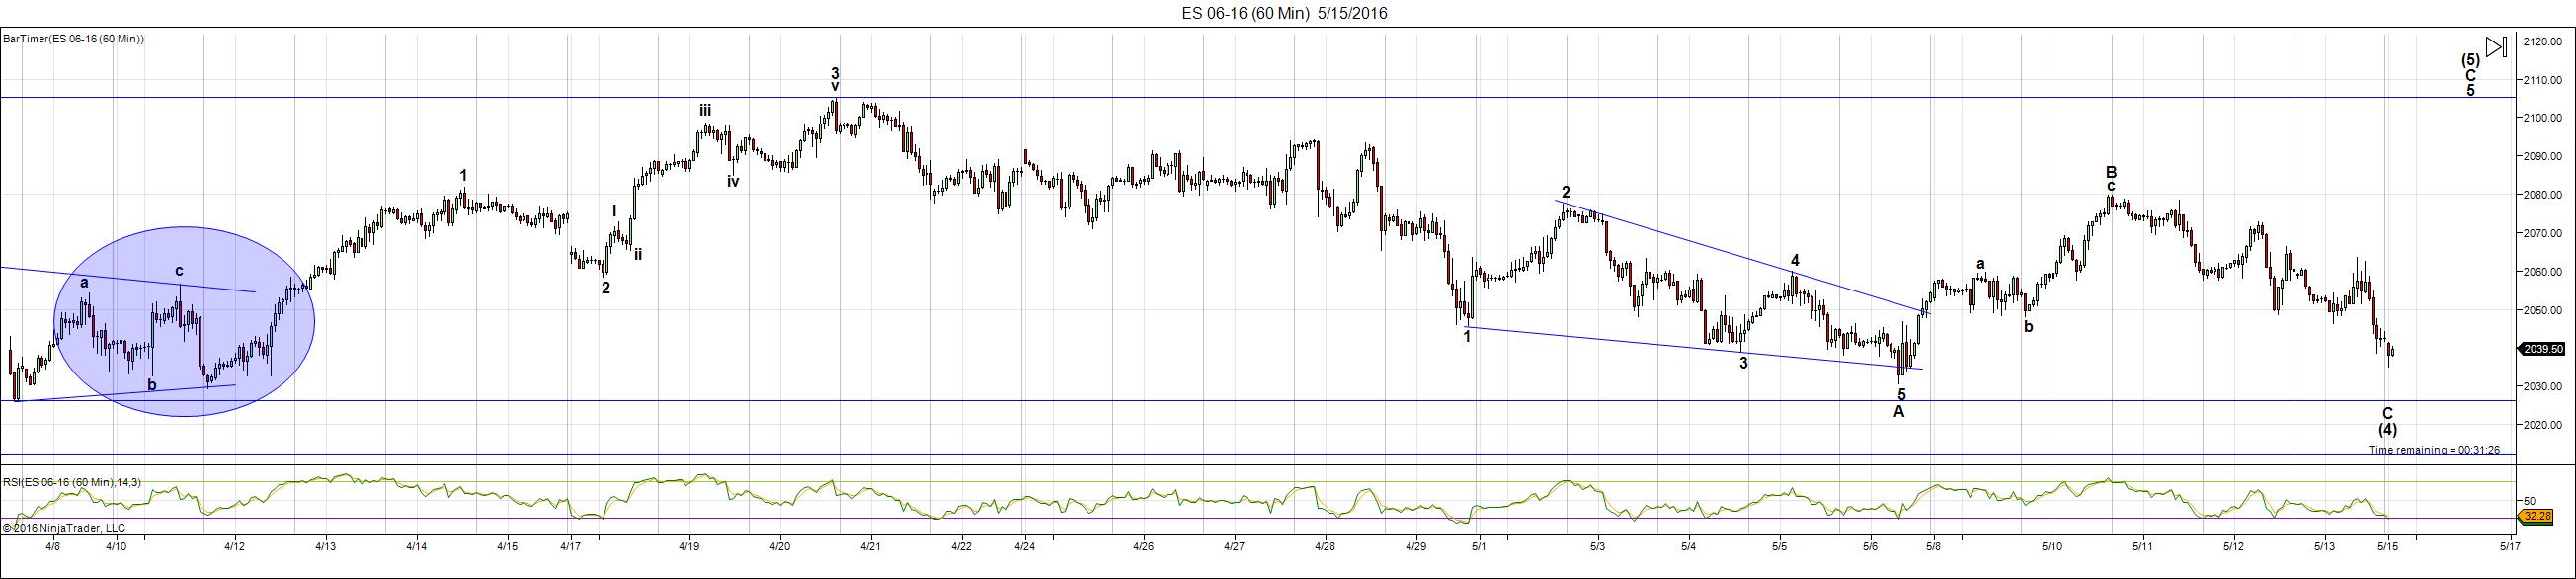
Above is the 60 minute chart of ES now showing a fourth wave looking for a bottom. We could also end up with a barrier triangle, but I put that at a much lower probability. I do not see a converging fourth wave triangle now as an option. All the waves here are in 3’s, so this projects a final wave up once we hit a bottom. We appear to be very close.
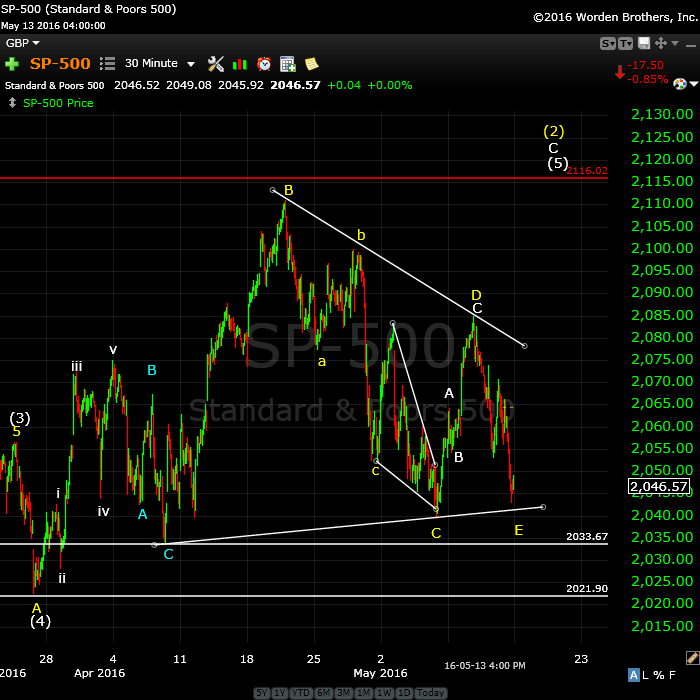
Above is a 30 minute chart of SPX. I’m not convinced that we’ll maintain this triangle. If we do, we’ll head up in 3 waves. If we come down to either of the horizontal lines, we should head up in 5 waves.
A full fourth wave ending at SPX 2023 or a bit lower would suggest a fifth wave up in 5 waves.
USDCAD and EURUSD are also in fourth waves now, consistent with that the equities are doing. USDCAD should now turn down and EURUSD up (once the 4th wave in US equities has bottomed).
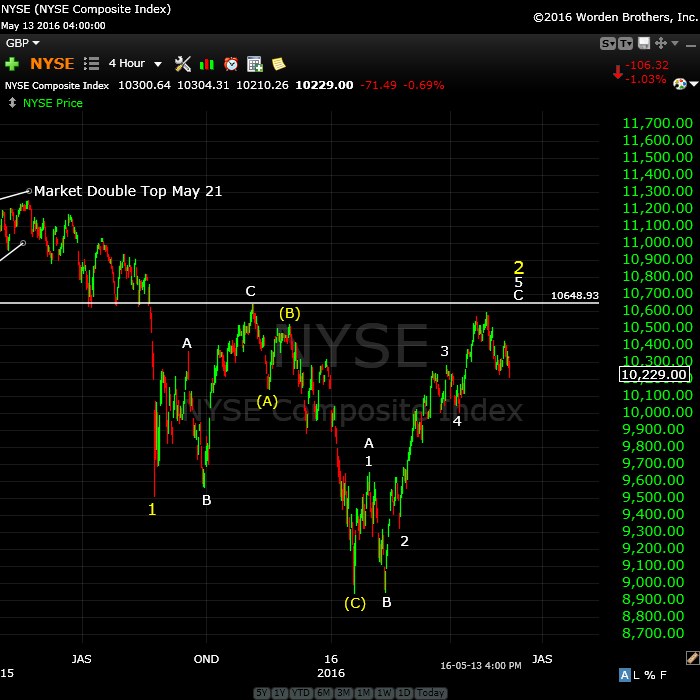
Above is the 4 hour chart of NYSE. I keep a fairly close eye on this index as it’s by far the largest in the world (in terms on capitalization). We are at the top of an ABC corrective wave (a bit more to go). I’m expecting a termination of this 2nd wave up at ~10648. This would “correct” the truncation and end in a double-pronged second wave. Third wave down should drop to around 6100.
So far, we’ve dropped in 3 overlapping waves, which projects a final wave up to a double top to complete the second wave. Then we’ll turn down into a third wave.
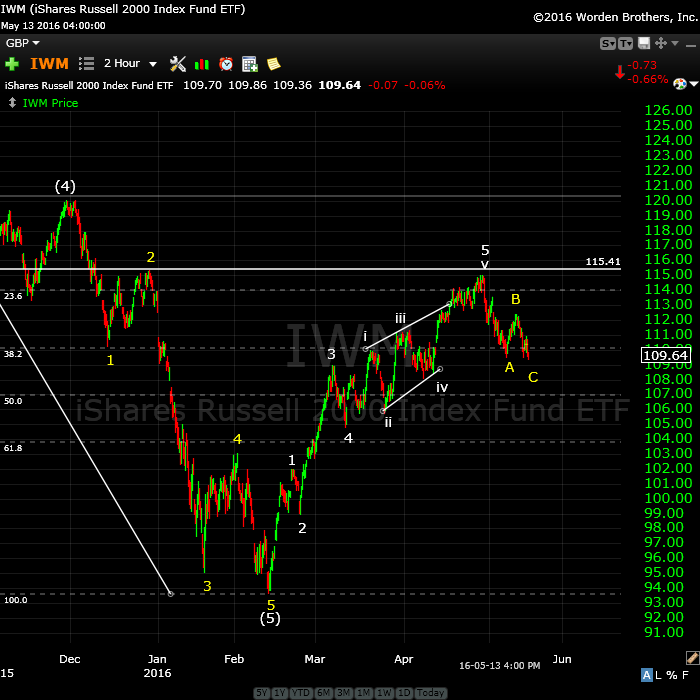
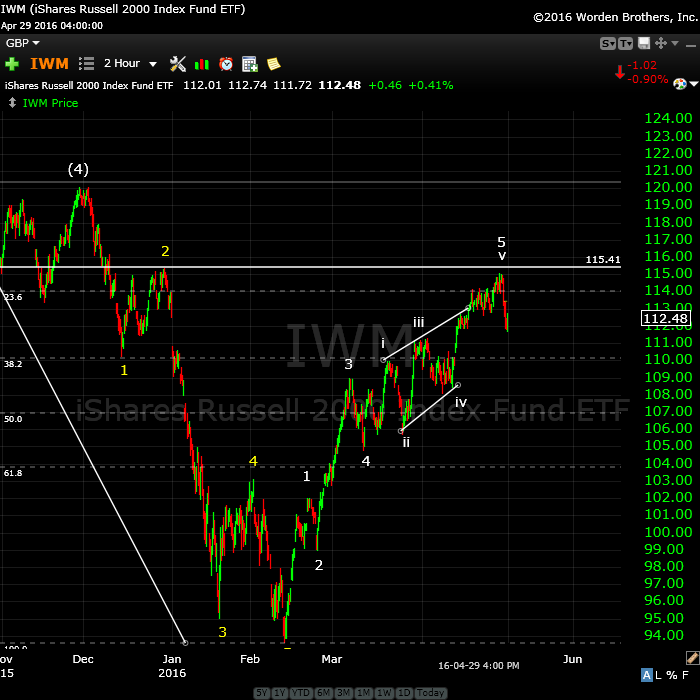
Above is a two hour chart of IWM (Russell 2000). This shows another perfectly valid way to label this wave up, but it’s actually a 3 wave move. The final C wave is in the process of bottoming before it turns up to complete a double top.
It’s traced out a very obvious ending diagonal with the “throw-over.” The first wave up has no second wave (as per the major indices), so as with the major indices, this is a corrective wave.
The current ABC wave down should now turn up to create a double top. I expect to see 5 waves up from here.
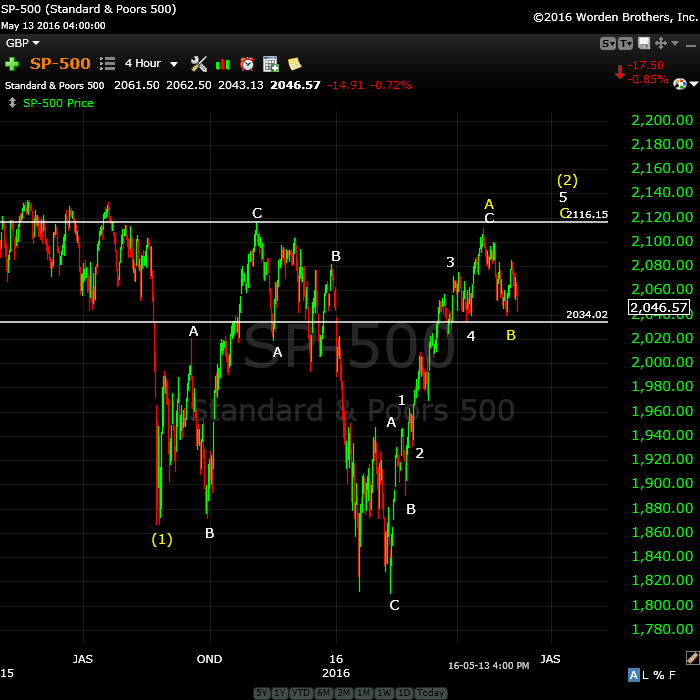
Above is the 4 hour chart of the SP500, showing the double 2nd wave top waiting to finish tracing out. This would negate the possible “truncation” from November of last year and create a spectacular EW textbook set up for a huge third wave down.
It’s typical in a bear market for second waves to trace out a double prong (an ABC wave down in this case from early November and a 5 wave structure up to where we are today). The five wave structure, however, is not motive (subwaves won’t necessarily all be in “legal” 5 wave motive configurations). I have therefore labelled this wave more correctly, showing that it is indeed a 3 wave corrective wave, with the (yellow) C wave up expected to produce a final ending wave of 5 waves.
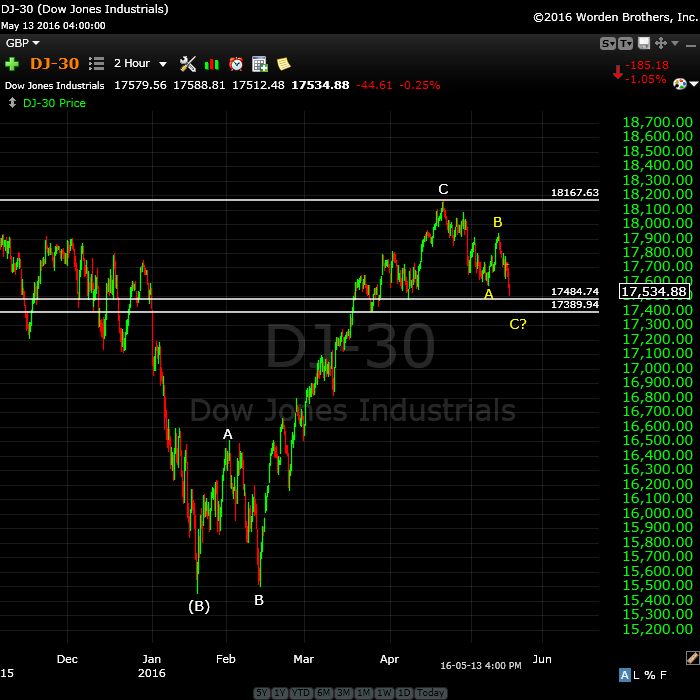
Above is the 4 hour chart of the DOW. It’s similar to all the other indices, as it should be. I predicted we’d reach the previous 2nd wave high and that in fact is what we’ve done. Look for a double top with the most recent high before a turn down. The reason I show this index is that I’m always looking to other indexes for confirmation of a move. You’ll note that the DOW did not come down to a new low in February, so this puts it clearly in a corrective abc wave up. As all the indices move in tandem, this supports the fact that SPX is also in a corrective wave.
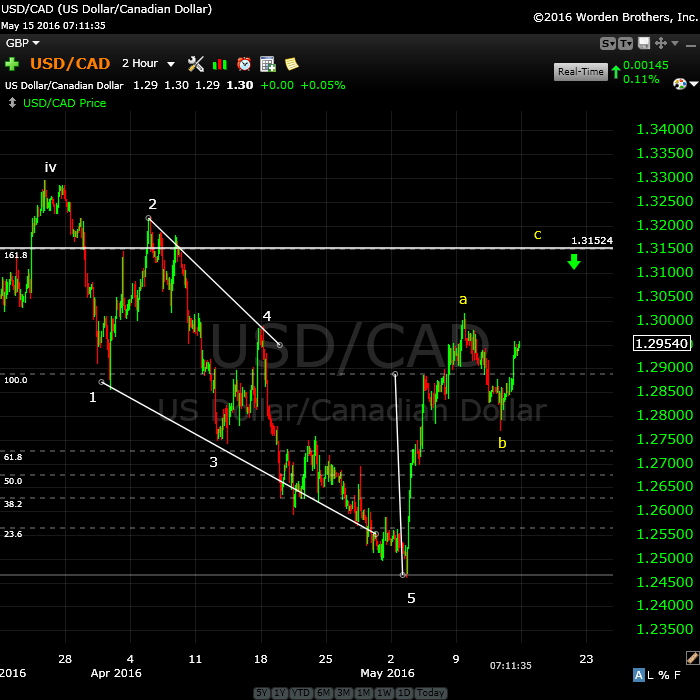
Above is the 2 hour chart of USDCAD. I have been stalking this for some time, waiting for it to bottom and we have the first signs now.
The larger pattern is an ABC corrective wave, and we have an ending diagonal, which looks to be complete. However, I expect this wave up in 3 waves to reach 1.315 before turning down to trace out a double bottom (to ~1.246). It could also drop to a lower level. Then it will turn back up into a very large 5th wave.
The euro, Australian dollar, dollar, and Canadian dollar are all at similar major inflection points.
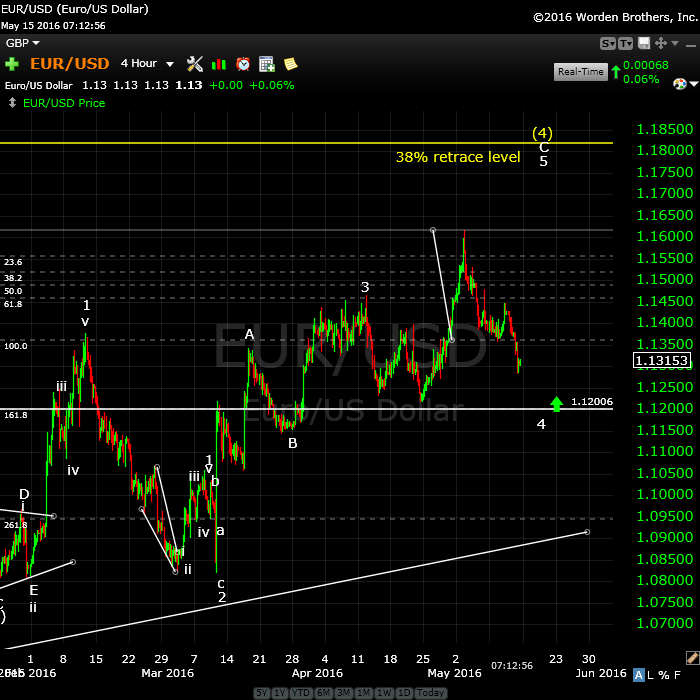
Here’s the 4 hour chart of EURUSD showing the major corrective pattern we’ve been in since March, 2104. I predict we’re going to hit the 38% retrace level (yellow horizontal line) that I’ve been suggesting for the past 8 months or so. As I explain in the video, the ABC wave heading up can be easily measured for an end point using your fibonacci tool.
It should turn in tandem with the US equities.
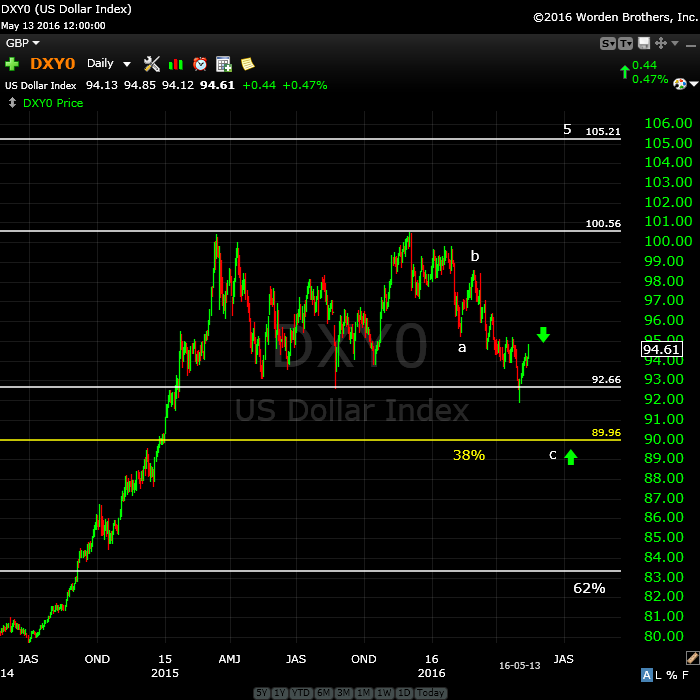
The US dollar (this is a daily chart) should do the same thing as the euro but in the opposite direction (down). The most recent wave up is in 3 wave, so we need a retrace. My preference is to see the US dollar tag the 38%retrace level (the yellow line).
I’m up in the air right now about the structure of this entire wave (from 2014). Although in 5 waves, it looks more corrective to me than motive.
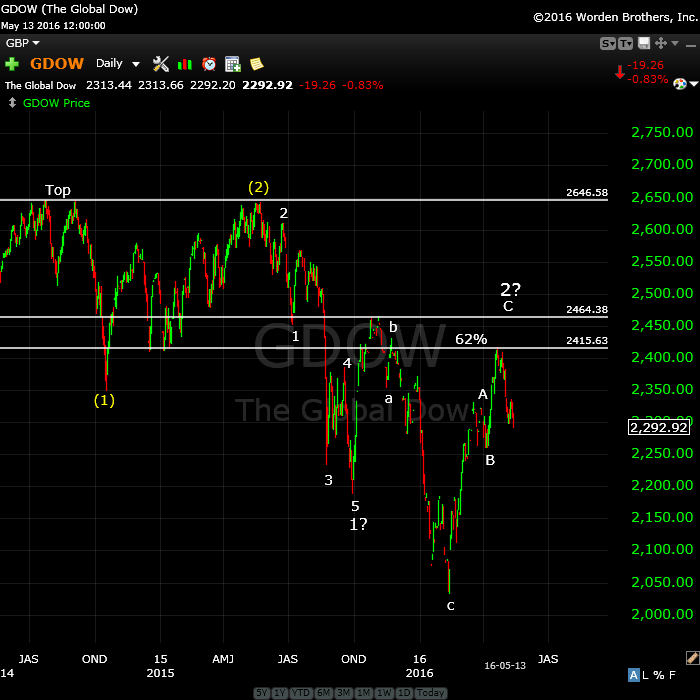
Above is the daily chart of GDOW (Global DOW) showing the current count. The short story here is that we’ve done a complete set of 5 waves down. As a result, the new trend is officially confirmed at DOWN.
NOTE: I have changed the numbering of these waves slightly from the version in the video. It changes the degree of the current wave up, but it doesn’t change the outcome. We should head down into the middle of the third wave, based upon the count shown above.
Bottom line: All the indices are lining up for a HUGE third wave down. More confirmation!
Major international indices like the GDOW and NYSE are where I do for the overall count. I can be much more committed (as I was on the SP500 first wave down, while everyone was questioning it) when I see a count on these two indices which is clear.
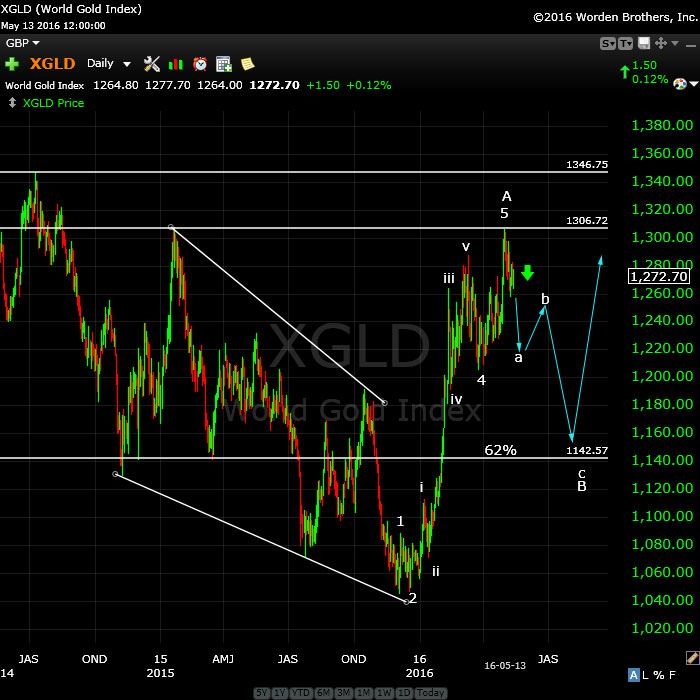
Above is the daily chart of XGLD (gold). No real change here in the past week. The bottom line is that we should turn down here. If we go much above the previous fourth (horizontal line) then I’m obviously wrong and something else is going on.
The target on the low side is the 62% retracement level, somewhere close to 1142.
________________________
First Wave Down – What to Watch For
This weekend we’re dangerously close to a top of a second wave (in the fifth of the fifth, with an ending diagonal pattern).
What we’re looking for to confirm a turn is a motive wave down in 5 waves.
Because we have an ending diagonal, the first wave will likely drop to the previous fourth, which is also the beginning of the ending diagonal pattern (~2022). After that, we should get a second wave that will retrace in 3 waves about 62%. That’s the preferred EW entry point. So don’t feel you have to rush in. There’ll be a much better opportunity at the second wave level than at the top and the risk is substantially reduced.
__________________________
History: The 1929 crash
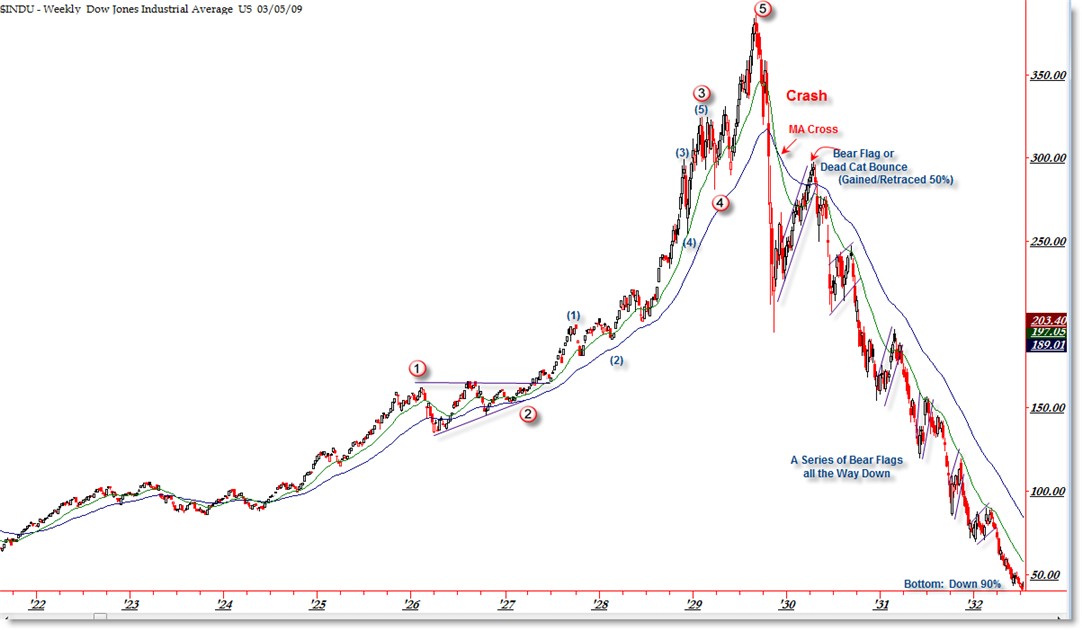
I think it’s important to look at 1929 and the wave structure (above and below), which was the same as 2007—to a point. I will show the 2007 crash below in the “What If” section.
The wave structure of the 1929 crash was in 3 waves overall. There were 5 waves down from the top (the A wave) and then a very large B wave retrace. The final C wave down was a stair-step affair and lasted over 2 years.
Let’s look a little close at the timing of the 1929 crash because the similarities to today are uncanny.
The market peaked on September 3, 1929 and then it took 2 months for the crash to actually happen (to reach the bottom of wave 5 of the A wave). The larger crash which we always hear about began on October 23, 1929. Then there was that large B wave, which lasted 5 and a half months and finally (which I explain a little further in the cycles section below), the C wave which went on for more than 2 years. This might be the scenario we’re looking at going forward.


I added a chart of ES at the close today (top of the post) with comments.
Peter-
I am assuming you will address this in the weekend video, but when you call this a B wave in the ABC move from February 11, if the B wave was to turn now, it seems like the target of 2116 makes the C wave to small compared to the A wave.
I could certainly be mistaken on to what degree of the wave you are referring to, so i can certainly wait till the video to see, but was hoping you could touch on that.
No, a C wave doesn’t have to be a particular length. Many times you have a humongous C wave ending a pattern. I would expect this wave to do a double top. It also could end in an ending diagonal. I have a feeling up front that this is going to be one tough pattern to analyze, like everything in the wave down. Tough, tough market. I’ll spend some time on this in the video.
Comments and a chart of ES at the top of the post. Caution today as there are options.
EURUSD just popped to a new high, so this wave may continue on. Too many options to give much guidance today.
My preference is for a correction down, but don’t know how far.
Looks like we are in the 5 waves up now? What is the fastest you have seen 5 waves up? Does this takes days, weeks, longer? Thank you!
Charlie,
An impossible question to answer. Depends on the degree, the market, a whole lot of parameters.
So there’s our clue. ES has retraced exactly 38% from the top, so we should get a 62% retrace. We arguably have 5 waves up (it’s not perfect, but then we’re in a corrective wave overall). If we get a 62% retrace in ES to approx. 2034 and a turn, then expect a third wave up. That would also be the EW preferred entry point. So we need to see a little more to be sure.
SPX is just shy of the 38% retrace level.
I revised the ES chart at the top of the post.
Peter,
So SP 500 to 2040 and then back up to 2016 in 5 waves is that what you are seeing. So many waves and I am new to this theory.
Bill
Bill,
We’re not quite done, I don’t think. Better to wait till the weekend and I’ll explain better there. We have a set of 5 waves up (almost) from ~2025, but I think it may get to 2060 in SP500. The final wave, which I thought might be an ending diagonal (it’s not) still has another wave to go, I think. The structure is better in the futures at the moment.
An ending diagonal by the looks of it for ES. I put the top at 2055.
I’ve measured the five waves up based on this first wave and it comes to 2110 for ES, which is what it should be. So we may simply get 5 wave motive set of waves to the top.
Now SPX is at the 38% retrace level from the top of the wave down (2111).
Hi Peter, What is the formula you use after a first wave to project the 5th wave target?
First wave is 1 in length.
Second wave retraces 62% (.618)
Third wave is 1.618 X the first.
Fourth wave retraces .382 (38%) of the entire distance from the start of the first.
Fifth wave is 1.618 X the first (162%) or the same length as the third.
Voila.
We may get one more wave up on SPX to 2060. The wave structure there is somewhat questionable, but I don’t think we’re quite finished.
We might be setting up as a large fifth wave up. My count for this first wave isn’t quite done and we have a 1-2, 1-2 start to the wave.
I just posted a chart showing my count for the SP500.
When I look at the latest chart, isn’t it more likely that 4 will bottom at.38 (at 2047,5) more or less? Because now we’re in nomans land…
Yes, correct. And we almost did. So noman’s land it is at the moment. I can’t reconcile my count. We didn’t get down to 38% but I think we still have to. My fib extension off the A wave down in ES tells me we have to get there. Same with SPX. I don’t think this is the second wave.
When you quote a number, please tell me what index you’re referring to. My fourth wave (38%) level in SPX is 2046.
Next week will be down into the end of may, but the real turn down will come 6/13.
So I guess we’ll have to wait a little longer. But once we start sliding it will be into the end of january 2017 (first leg down).
This website is for educational purposes relating to Elliott Wave, natural cycles, and the Quantum Revolution (Great Awakening). I welcome questions or comments about any of these subjects. Due to a heavy schedule, I may not have the time to answer questions that relate to my area of expertise.
I reserve the right to remove any comment that is deemed negative, is unhelpful, or off-topic. Such comments may be removed.
Want to comment? You need to be logged in to comment. You can register here.