
 Looking for an Interim Low
We’re sitting this weekend near the bottom of a large fourth wave with one more final high waiting in the wings before the expected large drop into the 2100 area in SPX.
This is an expected, high probability 300 point rally in SPX and represents a really good bullish opportunity. But, we need to see a fourth wave bottom and we don’t have one yet on the hourly charts.
There are always options for the shape of a final fifth wave. It could rise in 5 motive waves, or it could rise in 3 waves and see either a triangle or ending diagonal play out at the top.
However, since WTI oil, DXY, and EURUSD have traced out an A – B sequence as part of their final waves, and they all appear to be in diagonals (which require all waves to be “threes,”) that would leave them with a C wave to go. C waves in this situation would usually be in five waves.
ES still has to properly bottom and the SP500 may be in a small ending diagonal as of end of day Friday, so Monday morning is likely to see the bottom for SPX, with a pivot into the fifth and final wave up.
All of this seems to indicate that the US indices are going to see five waves up rather than a triangle or ending diagonal. That doesn’t mean we definitely won’t get a small triangle at the top, but it would have to appear in many different assets, as they’re all moving now in lock-step (and that includes international exchanges, like DAX). So, I think a triangle or ending diagonal as a fifth wave is much less likely at this point than five waves up.
There was a big semiconductor announcement this weekend, so that might give us a bullish spark on Monday morning (after a bottoming wave down). There’s also a Federal Reserve announcement this coming Wednesday at 2pm. That’s also usually bullish. So, I see two events this week that are bullish and promise to end badly, as events that move the market always do.
AMZN — Another Bigger Picture Confirming Outlook
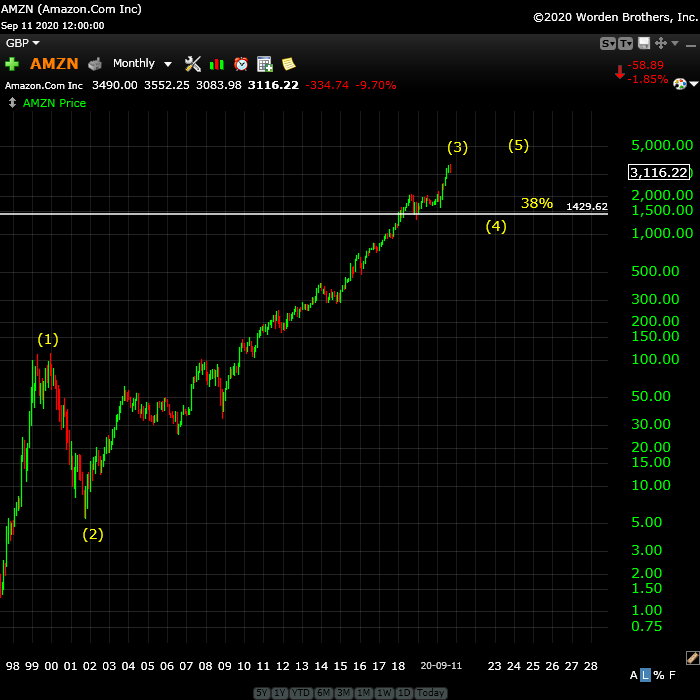
Above is the monthly chart of AMZN, showing the entire wave structure since 1997. It’s a log chart (as are all my long-term charts).
I’ve been saying for quite a long time now that we have a large 4th wave coming on a daily chart and a fifth wave up to a final high still to come before we see the big crash in 2021. You can see the same count here in Amazon, as you can with other major tech companies, that are, for the most part, driving this blow-off wave.
This weekend, AMZN is at the bottom of the fourth wave of an ending diagonal. That chart on that is below. The high at the top of the ending diagonal will trigger the larger fourth wave down, which typically descends 38% of the entire wave up from 1997. You can see that level on the chart above. Expect one more final high after that, and in the US indices, as a whole.
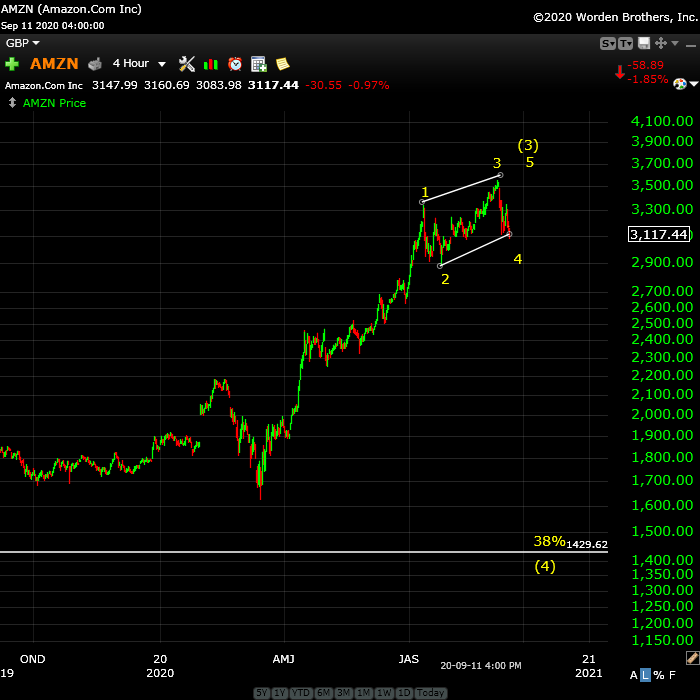
Above is the 4 hour chart of AMZN showing us near the top of the third wave. We appear to be tracing out an ending diagonal, so we’re expecting one more wave up to a new high here before the big drop I’m expecting. The horizontal line (same as the first chart above) shows the level that AMZN would typically drop to in a fourth wave.
Know the Past. See the Future
_______________________
Free Webinar Playback: Elliott Wave Basics
 If you’re new to the Elliott Wave Principle, or even fairly comfortable with it, this webinar will give you a solid introduction and comprehensive understanding of the difference between trending and counter-trend waves, the various patterns for both types of wave patterns, and a good overview of how fibonacci ratios determine trade targets.
This is link to the YouTube playback video, allowing you to review, stop and start, etc.
____________________________
Want some truth?
My new site now has two extensive newsletters in place. Videos now explain the banking system and deflation, and I’ve provided lists of what to do and what the start collecting in preparation for the eventual downturn, which will last for decades. The focus of my new site is now to retain your wealth, plan for deflationary times, and stay healthy in the process. I’m also debunk a lot of the propaganda out there. It’s important to know what’s REALLY happening out there! Getting to the real truth, based on history, is what I do, inside the market and out.

To sign up, visit my new site here.
All the Same Market.
I’ve been mentioning for months now that the entire market is moving as one entity, the “all the same market” scenario, a phrase that Robert Prechter coined many years ago, when he projected the upcoming crash.
We’re in the midst of deleveraging the enormous debt around the world. Central banks are losing the control they had and we’re slowly sinking into deflation world-wide, with Europe in the lead.
The US dollar is fully in charge of both the equities and currencies markets. They’re all moving in tandem, as I’ve been saying since September of 2017. Over the past three years, their movements have been moving closer and closer together and one, and now they’re in lock-step, with the major turns happening at about the same time.
it’s challenging because often times currency pairs are waiting for equities to turn, and other times, it’s the opposite. The other frustrating thing is that in between the major turns, there are no major trades; they’re all, for the most part day-trades. That’s certainly the case in corrections, where you very often have several possible targets for the end of the correction.
We’re now close to a turn in the US indices, currency pairs, oil, and even gold. Elliott wave does not have a reliable timing aspect, but it looks like we should see a top very soon.
_________________________________
the real deal SM 2
The real deal …‘Educational, insightful and thorough market analysis for all levels of traders. It’s Elliott Wave at its best….Peter Temple is the real deal’ —SM |
Rise above the rest … SM 2
Rise above the rest …I have only ever met a few people who, in their chosen fields (astrology, medicine, music, martial arts, technical analysis), rise above all the rest and you are one of them…you have ‘the gift’…and that’s why I’m a Trader’s Gold member. —SM |
Get an upper hand … JC 2
Get an upper hand in trading …Seeing all the different currency pairs and the wave structures and hearing you explain why this has to do that on a nightly bases gives one a upper hand when trading. Elliott Wave applies to all stock and indices and can be applied to any candlestick chart. If someone ask what you want for Christmas – Tell them a membership to Peter’s “Traders Gold!”—JC |
The best of them JL 2
The best of them …Last couple of years, I subscribed to several ‘market traders’. You are by far the best of them and the personal contact is awesome. Daily and daily updates are very well written! Besides your expertise in EW, I also like your cycles analysis. Best investment I ever made! —JL |
A true expert in Elliott Wave FL 2
A true expert in Elliott Wave …You are a true expert in EW analysis. What you provide is not available anywhere and is priceless. Subscription on your services is the best thing I have ever done. Many thanks for your effort to make me a better investor. I now have more trust in my investment decisions. I hope you will continue the excellent work! —FL |
Couldn’t be happier … KK 2
Couldn’t be happier …The analysis and insight you provide is simply amazing! I’ve been trading the futures and equity markets for well over thirty years and usually average around 5% monthly. Since joining your Traders Gold Service two months ago, that number has better than doubled. I couldn’t be happier.—KK |
Tops in your field DZ 2
Tops in your field …You are tops in your field. Tried to follow Elliot Wave international for years. They were always behind the market. After discovering you, I perceive that you are an expert in reading the waves, which puts you way ahead of the rest of your peers. And you can read the Waves like you are reading tomorrow’s financial section. I pray you stay healthy. —DZ |
Have not had a losing week RW 2
Have not had a losing week …I have been with Peter almost a year. The only thing that matters is have I made money with his service. I think I have finally turned the corner using Peter’s EW. I have not had a losing week in the last 5 months. Thanks Peter, for your amazing amount of hard work. —RW |
US Market Snapshot (based on end-of-week wave structure)
This chart is posted to provide a prediction of future market direction. DO NOT trade based upon the information presented here (certainly NOT from a daily chart).
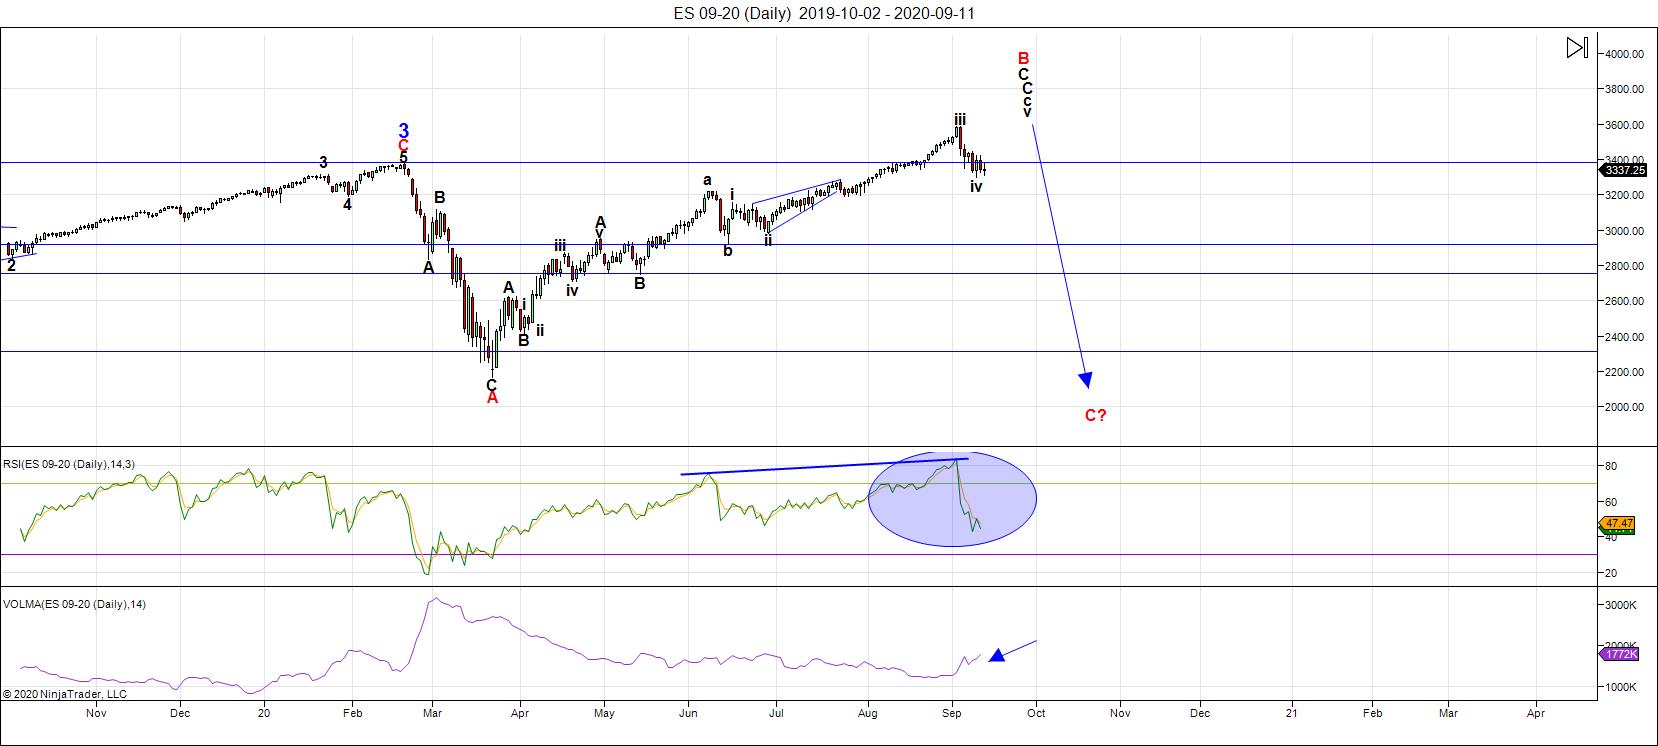
Above is the daily chart of ES (click to enlarge, as with any of my charts).
The blue arrow line down denotes that the wave up is corrective and will completely retrace. In fact the entire wave up from 2009 is a corrective B wave. The cycle top, and top of the fifth motive wave, was in 2007.
This weekend, we sit near the bottom of the final fourth wave of this five month rally. A big picture look at the US indices and NYSE exchange show a very sick market, as many of these indices have different counts from the rest.
The NYSE exchange may be in an ending diagonal at the top of its clearly corrective B wave up from March, ready to complete a fifth wave up (similar to the AMZN charts above), which will lead to another mini-crash but might not make a new low. The various indices are in different patterns, which is a sure sign of a very sick market.
On the daily chart, we now have RSI divergence that should continue as such as this final wave reaches a new high.
DXY (the US Dollar Index) continues to be in an ending diagonal and I'm expecting a new now here before the trend changes to the upside.
Some other currency pairs also appear to have traced out ending diagonals and are in the final wave.
West Texas Intermediate Oil appears now not to have topped because it's come down only part-way to its first wave target in a corrective wave. I also expect a new high here and it appears we're in some sort of final broadening top.
As mentioned above, ES has not quite bottomed, but I it could do so as early as Monday morning. It may also last a bit longer. A Fed meeting is scheduled for Wednesday at 2pm EST, and usually the market rises ahead of it, in anticipation.
___________________________
Summary: It's an exhausted market about to top.
The SP500 appears to be in a kind of broadening top formation (not an EW pattern) on a weekly chart. Other US market indices have completely different patterns, which is the sign of a very sick market, and one in the final stages of this 500 year rally, and a corrective B wave up from 2009.
I'm expecting a final high before we have major turn down.
The coming descent should be a fourth similar to the previous one, with a target under 2100 in SPX, and will likely be a combination pattern and, as such, may contain zigzags, flats, and possibly a triangle or ending diagonal at the bottom. However, I lean towards another series of zigzags, which are corrective waves.
Once we've completed the fourth wave down, we'll have a long climb to a final slight new high in a fifth wave of this 500 year cycle top.
______________________________
Trader's Gold Subscribers get a comprehensive view of the market, including hourly (and even smaller timeframes, when appropriate) on a daily basis. They also receive updates through the comments area. I provide only the daily timeframe for the free blog, as a "snapshot" of where the market currently trades and the next move on a weekly basis.
I do a nightly video on the US indices, USD Index (and related currency pairs), gold, silver, and oil) right down to hourly charts (and even 5 minutes, when required).
______________________________________


