
 Looking for an Interim Low
We’re sitting this weekend near the bottom of a large fourth wave with one more final high waiting in the wings before the expected large drop into the 2100 area in SPX.
Mid-week, when I expect a low, will have been 14/15 days down from the top. That leaves us about six weeks until the US election on November 3.
Logically, a triangle or ending diagonal (both ending wave patterns) would fit very well into that time frame. It looks to me that we’re not going to see the top until the election. This has me reflecting back to the 2016 election. When the results were announced, the euro fell dramatically. The US Dollar also fell, but it wasn’t moving in the opposite direction from euro at the time. However, it is now, and I’m expecting it to rise, once the diagonal pattern it’s in ends.
The dollar rising is deflationary and it will send gold lower, as I’ve been saying for a long time. That will certainly surprise all the gold bugs, who are expecting inflation and higher gold prices.
The world is turning upside down.
The Tyranny Deepens
Central bankers must be panicking. They got their hooks into countries around the world, mostly in the 1970s. The G7 countries all signed agreements with the Bank of International Settlements to provide their money for a fee. That agreement stipulates that these governments cannot create their own money. So, all these countries have lost their sovereignty. With the huge amount of debt they’ve racked up, the bill is becoming due.
“Let us control the money of a country and we care not who makes its laws.” This is the maxim of the house of Rothschilds, and is the foundation principle of European banks. — The Magazine of Wall Street and Business Analyst(November 10, 1934 p.67)
This has resulted in the New World Order, which has been in the works, of course, for decades. it’s no secret (or shouldn’t be) that we line up at airports to get frisked when there is no imminent danger to anyone. Climate change was another scam tossed upon us. Governments always like to develop a threat of some kind to keep a population compliant.
Now we have this pandemic that is not a pandemic. It’s a man-made virus that is not particularly lethal, but it’s been introduced at a time when testosterone levels across the world are low. When testosterone levels are low, it reduces the ability to think critically. That leaves hormonal power to cortisol. Cortisol raises the fear level.
So we have a worldwide population with high levels of fear, a fiat currency that is worth very little in terms of purchasing power, and lockdowns across the world (with masks to remind us that they’re in control) as these villains attempt to take ultimate control. Yes, it’s a real-life 1984 playing out. It will get a lot worse before it gets better.
Behind all this is the fact that we’re going to have a worldwide financial meltdown and central bankers know it.
Here’s an article from Mathew Ehret at the Strategic Culture Foundation. It relates to the Canadian situation, but this is a worldwide phenomenon happening in countries around the world.
Even though “the herd” is still fast asleep, people who still have their wits about them are catching on.
Protests are cropping up all over the world. You can find out all about them from the protest tracker.
There are current protests in the UK, France, Canada, Spain, Italy, and of course Australia, where the state of Victoria has been effectively locked down by an authoritarian government.
The current world situation is akin to the moneylenders in ancient Rome before Jesus threw them out of the Temple. It’s the same battle that has gone on throughout history. Every 172 years, we go through a smaller version of the same process, but this is a 1000 year cycle top. 1000 year cycles are several times the magnitude (six times, to be more accurate) of the lowly 172 year cycles.
I’m working on a video this weekend that I hope will be live by Monday that will show how one of these cycles play out. Governments go down the same path each time, stealing money, going bankrupt, and then trying to cover up the disaster. They do that over and over again and we pay the price. History rhymes and we’re about the get yet another lesson on tyranny … worldwide.
The good news is that these oligarchs won’t win. The same cycles that allow them to build up this wealth and power, reverses and end in revolution, where governments will end up being overthrown and gradually democracy will come back stronger than ever. But, it will be a fight; history proves it’s never easy.
What has been will be again,
what has been done will be done again;
there is nothing new under the sun. — Ecclesiastes 1:9
It’s always about money.
A Quick Virus Reality Check
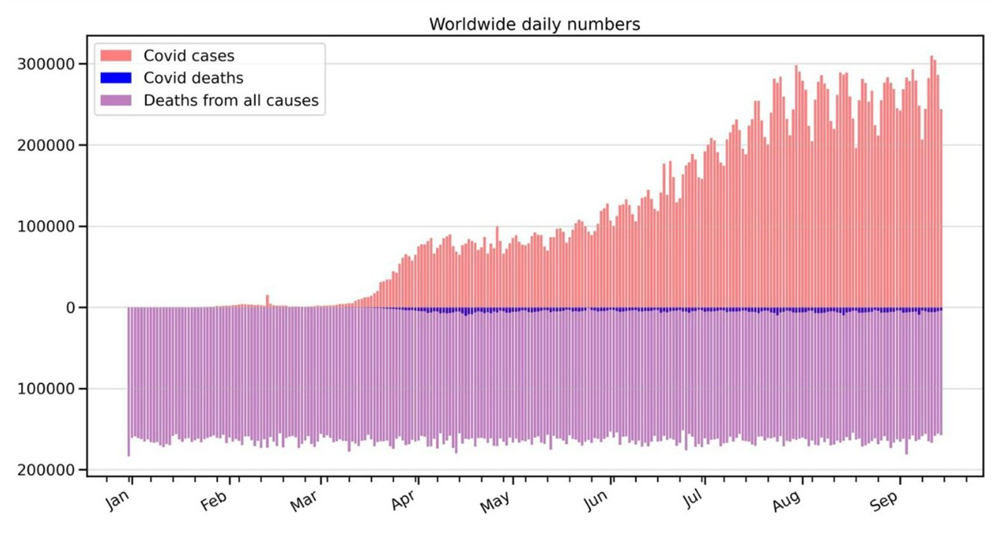 This chart from Adam Creighten, Editor, The Australian, Co-host Business Weekend, Sky News Australia. @Adam_Creighton
The above chart shows the real story regarding this “pandemic”. (click to expand) The lower purple coloured data are deaths worldwide from all causes. The dark purple line in the middle are deaths attributable to COVID-19, a SARS virus, that is in the common cold family.
The pink data above are cases, which have become the focus, because hardly anybody is dying anymore from the disease itself. We also know that you can’t accurately test for this flu bug. You’ll find the scientific background to this science here, and here.
At the same time, there are very effective cures out there, like hydroxychloroquine, that have been suppressed for “no apparent reason” (unless you understand what that reason is).
History rhymes. You have to go back 500 years to find the same pattern, but it’s definitely there. You’ll find it 500 years before that, and 500 years before that. Financial meltdowns happen at regular intervals, a result of governments and bankers inflating currency, in effect, stealing from the population. It’s happened over and over again since money was created.
We never learn.
Know the Past. See the Future
_______________________
Free Webinar Playback: Elliott Wave Basics
 If you’re new to the Elliott Wave Principle, or even fairly comfortable with it, this webinar will give you a solid introduction and comprehensive understanding of the difference between trending and counter-trend waves, the various patterns for both types of wave patterns, and a good overview of how fibonacci ratios determine trade targets.
This is link to the YouTube playback video, allowing you to review, stop and start, etc.
____________________________
Want some truth?
My new site now has two extensive newsletters in place. Videos now explain the banking system and deflation, and I’ve provided lists of what to do and what the start collecting in preparation for the eventual downturn, which will last for decades. The focus of my new site is now to retain your wealth, plan for deflationary times, and stay healthy in the process. I’m also debunk a lot of the propaganda out there. It’s important to know what’s REALLY happening out there! Getting to the real truth, based on history, is what I do, inside the market and out.
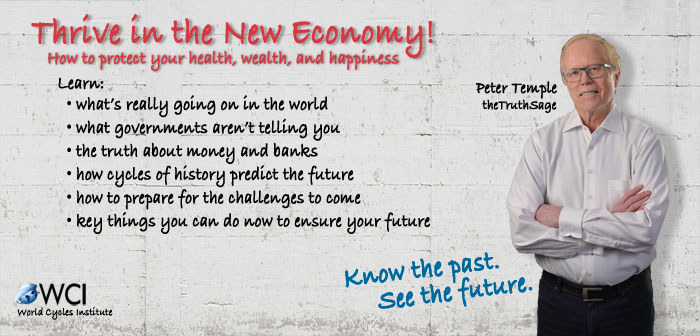
To sign up, visit my new site here.
All the Same Market.
I’ve been mentioning for months now that the entire market is moving as one entity, the “all the same market” scenario, a phrase that Robert Prechter coined many years ago, when he projected the upcoming crash.
We’re in the midst of deleveraging the enormous debt around the world. Central banks are losing the control they had and we’re slowly sinking into deflation world-wide, with Europe in the lead.
The US dollar is fully in charge of both the equities and currencies markets. They’re all moving in tandem, as I’ve been saying since September of 2017. Over the past three years, their movements have been moving closer and closer together and one, and now they’re in lock-step, with the major turns happening at about the same time.
it’s challenging because often times currency pairs are waiting for equities to turn, and other times, it’s the opposite. The other frustrating thing is that in between the major turns, there are no major trades; they’re all, for the most part day-trades. That’s certainly the case in corrections, where you very often have several possible targets for the end of the correction.
We’re now close to a turn in the US indices, currency pairs, oil, and even gold. Elliott wave does not have a reliable timing aspect, but it looks like we should see a top very soon.
_________________________________
Have not had a losing week RW 2
Have not had a losing week …I have been with Peter almost a year. The only thing that matters is have I made money with his service. I think I have finally turned the corner using Peter’s EW. I have not had a losing week in the last 5 months. Thanks Peter, for your amazing amount of hard work. —RW |
the real deal SM 2
The real deal …‘Educational, insightful and thorough market analysis for all levels of traders. It’s Elliott Wave at its best….Peter Temple is the real deal’ —SM |
Tops in your field DZ 2
Tops in your field …You are tops in your field. Tried to follow Elliot Wave international for years. They were always behind the market. After discovering you, I perceive that you are an expert in reading the waves, which puts you way ahead of the rest of your peers. And you can read the Waves like you are reading tomorrow’s financial section. I pray you stay healthy. —DZ |
Rise above the rest … SM 2
Rise above the rest …I have only ever met a few people who, in their chosen fields (astrology, medicine, music, martial arts, technical analysis), rise above all the rest and you are one of them…you have ‘the gift’…and that’s why I’m a Trader’s Gold member. —SM |
Couldn’t be happier … KK 2
Couldn’t be happier …The analysis and insight you provide is simply amazing! I’ve been trading the futures and equity markets for well over thirty years and usually average around 5% monthly. Since joining your Traders Gold Service two months ago, that number has better than doubled. I couldn’t be happier.—KK |
The best of them JL 2
The best of them …Last couple of years, I subscribed to several ‘market traders’. You are by far the best of them and the personal contact is awesome. Daily and daily updates are very well written! Besides your expertise in EW, I also like your cycles analysis. Best investment I ever made! —JL |
Get an upper hand … JC 2
Get an upper hand in trading …Seeing all the different currency pairs and the wave structures and hearing you explain why this has to do that on a nightly bases gives one a upper hand when trading. Elliott Wave applies to all stock and indices and can be applied to any candlestick chart. If someone ask what you want for Christmas – Tell them a membership to Peter’s “Traders Gold!”—JC |
A true expert in Elliott Wave FL 2
A true expert in Elliott Wave …You are a true expert in EW analysis. What you provide is not available anywhere and is priceless. Subscription on your services is the best thing I have ever done. Many thanks for your effort to make me a better investor. I now have more trust in my investment decisions. I hope you will continue the excellent work! —FL |
US Market Snapshot (based on end-of-week wave structure)
This chart is posted to provide a prediction of future market direction. DO NOT trade based upon the information presented here (certainly NOT from a daily chart).
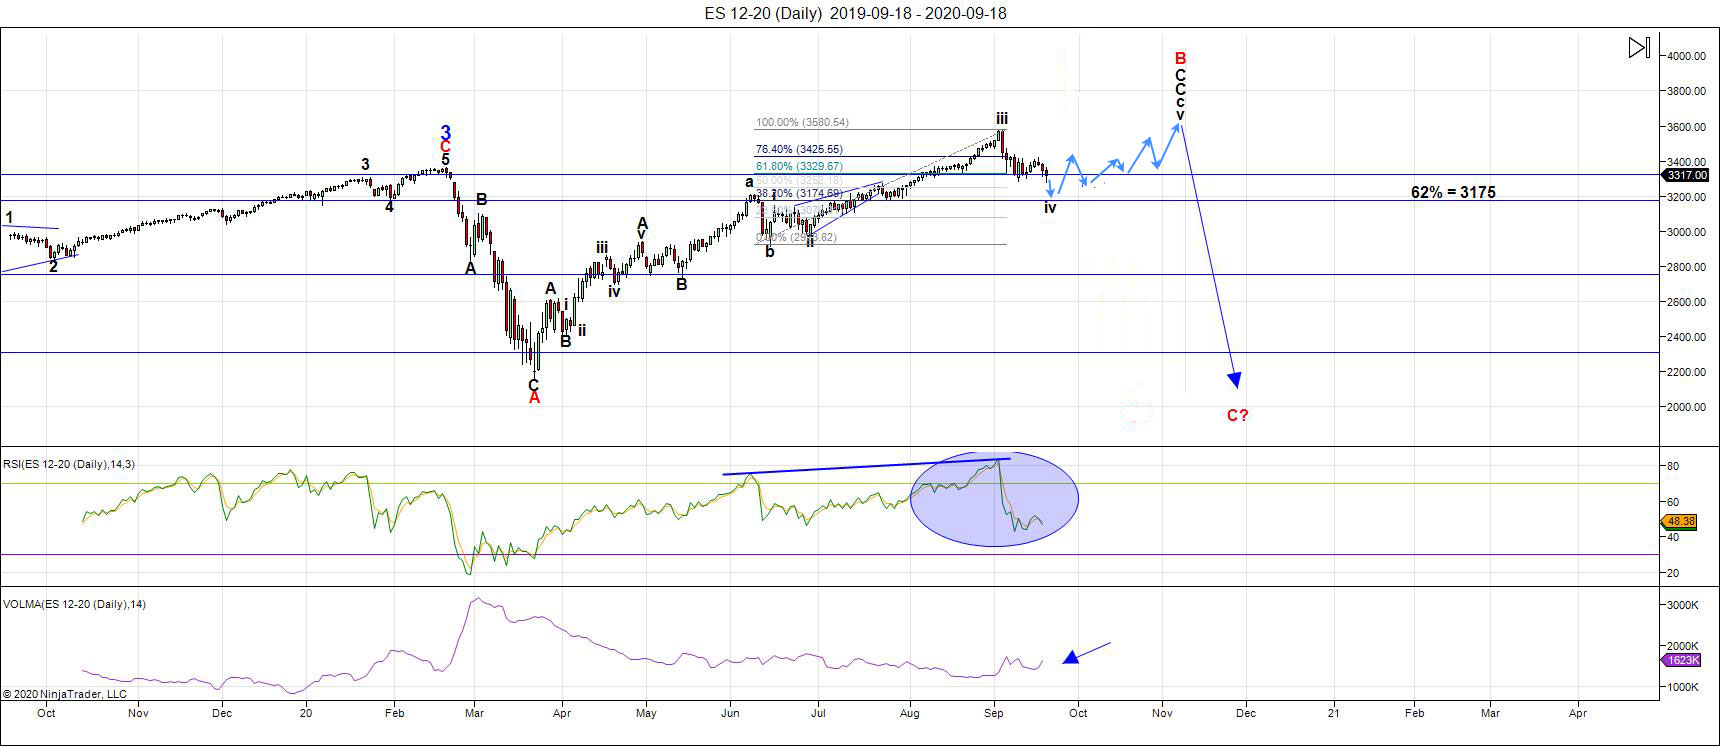
Above is the daily chart of ES (click to enlarge, as with any of my charts).
The blue arrow line down (the red B wave down) denotes that the wave up is corrective and will completely retrace. In fact the entire wave up from 2009 is a corrective B wave. The cycle top, and top of the fifth motive wave, was in 2007.
On Thursday of this past week, I called for a new low for the current fourth wave we're in and on Friday morning called for a trade at the top of a small ending diagonal. Down we went. The problem with this fourth wave is that it's not deep enough and doesn't measure correctly from a fibonacci perspective.
It looks to me now that we're going to see a bottom of the fourth wave perhaps in conjunction with solstice (September 22). But this leaves us with one more wave up to go.
Elliott wave does not have a reliable timing tool and the usual cycles aren't working (due to everything now moving in tandem with the US Dollar). But with my projection for a new low in the next few days, that will bring the fourth wave to a total of fourteen days to complete this fourth wave, which I'm projecting to hit a probable fibonacci target of 3200 (1.618 extension of the A wave down).
This would put the US election six weeks away. It would seem to me from a logical perspective that this is likely to be the top of this rally. In that case, I would expect the final wave up to either be an ending diagonal, or a triangle. Given the bullishness of this rally, my bias is leaning towards an ending diagonal. I am showing a possible pattern for an ending diagonal in the chart above.
This is somewhat speculative at this point, but I've drawn the projected path on the daily chart. Ending diagonals are ending patterns, result in a dramatic turn, and come down hard.
Almost all the currency pairs I cover are in ending expanding diagonals, as is oil, and DXY. DAX (the German exchange) appears to be in an ending diagonal. So, we have ending patterns (which happen to be diagonals) almost right across the board. Now, it's only a matter of time. The market needs one more high.
For final, measured highs, I have somewhat speculative targets of 3636 or 3700 for the SP500 and 3635 or 3675 for ES.
___________________________
Summary: It's an exhausted market getting close to top, which I now think will coincide with the US election.
The SP500 appears to be in a kind of broadening top formation (not an EW pattern) on a weekly chart. Other US market indices have completely different patterns, which is the sign of a very sick market, and one in the final stages of this 500 year rally, and a corrective B wave up from 2009.
I'm expecting a final high before we have major turn down.
The coming descent should be a fourth similar to the previous one, with a target under 2100 in SPX, and will likely be a combination pattern and, as such, may contain zigzags, flats, and possibly a triangle or ending diagonal at the bottom. However, I lean towards another series of zigzags, which are corrective waves.
Once we've completed the fourth wave down, we'll have a long climb to a final slight new high in a fifth wave of this 500 year cycle top.
______________________________
Trader's Gold Subscribers get a comprehensive view of the market, including hourly (and even smaller timeframes, when appropriate) on a daily basis. They also receive updates through the comments area. I provide only the daily timeframe for the free blog, as a "snapshot" of where the market currently trades and the next move on a weekly basis.
I do a nightly video on the US indices, USD Index (and related currency pairs), gold, silver, and oil) right down to hourly charts (and even 5 minutes, when required).
______________________________________


