Final New Highs Ahead
I’m very busy preparing for the upcoming webinar this week, so my comments will be short.
When I talk about new highs, I’m talking about highs for the current corrective rally. We’re struggling in the US indices. A new high will be the point at which you would want to look for a turn to the downside. We’ll see how next week plays out. It’s now day-to-day.
On a larger scale, while I’m expecting one more wave up to a new high in the US indices after the expected fourth wave bottom under 2100, I’d expect many less robust stocks to top for good at this coming turn down. Not everyone will participate in the final wave up to a new all-time-high.
The world (some countries more than others) is moving towards confrontation. We’re going to devolve into civil war in many countries — you can see the signs in France and if you monitor Hong Kong and China, the government crackdowns that are imminent will no doubt spark more unrest than we’ve seen so far. The US is certainly going to see a civil war, and it won’t be short. The economy is already challenged; the illogical government restrictions you’re seeing everywhere put more downward pressure on it. It’s getting tougher, and we’re truly all in this together.
Governments are getting fearful. They’ve used this corona virus to attempt to keep everyone in line. There can be no other explanation for it, because the ridiculous restrictions (wearing masks, staying indoors, keep two metres apart) don’t work. They have no scientific basis. In the US, they’re propping up the numbers of deaths due to the disease, Even at that, more people die from the annual flu.
Today, a blog post on Canada’s numbers.
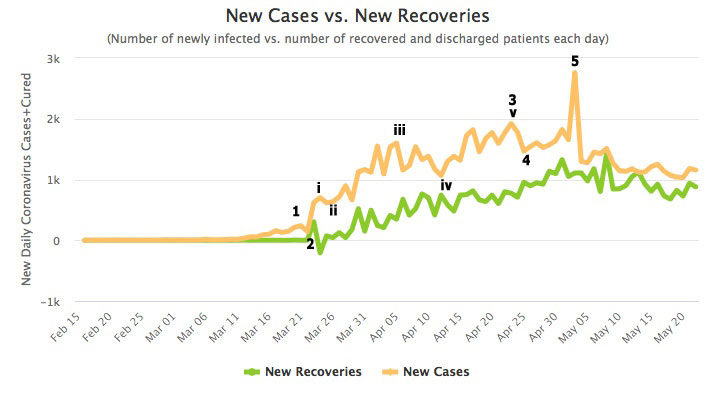
 Above are the cases in Canada. Trends run in five waves, in the market, and elsewhere. I’m not counting on a “second wave.”
The only way to stop the outbreak is through herd immunity, lots of sunshine, or vitamin D (I take lots of Vitamin D daily, because levels are currently down across the population worldwide). Testosterone is also low across the worldwide population and that lowers the birthrate. In fact, a new article tonight speaks to the fears about the low birthrate, which is a trait of major cycle tops. I’m writing an article this weekend about your hormone imbalances (at least, I hope to finish it on the weekend).
In short, testosterone (both sexes have it) is the reasoning hormone. It allows us to think critically. When it’s low, cortisol takes over. Cortisol is responsible for the fight or flight reaction that’s wired into all of us. That’s why so see so much irrational fear all of a sudden worldwide.
Understanding cycles helps you watch for these social turns, helps understand what’s really going on, and provides a warning of what’s to come. For example the corruption we’re seeing across the crumbling American Empire has been lying under the surface for a long time. Now, it’s simply blatant, for all to see.
You’ll learn much more in the upcoming webinar. I’ll be introducing a monthly newsletter and video as the mainstay of the service covering areas such as:
- real estate (prices, renting vs. buying)
- food and water sources for the long term, including gardening
- money, deflation, banking, debt relief
- social mood as it changes
- how to stay safe, where to live, and migration to rural areas
- gold and silver projections
- energy concerns
- health and natural substances (as the medical system falters)
- community and how to build it
- corruption and free speech (the truth always comes out at cycle tops)
- and much more.
Hope you can join me.
_______________________________
All the Same Market.
I’ve been mentioning for months now that the entire market is moving as one entity, the “all the same market” scenario, a phrase that Robert Prechter coined many years ago, when he projected the upcoming crash.
We’re in the midst of deleveraging the enormous debt around the world. Central banks are losing the control they had and we’re slowly sinking into deflation world-wide, with Europe in the lead.
The US dollar is fully in charge of both the equities and currencies markets. They’re all moving in tandem, as I’ve been saying since September of 2017. Over the past three years, their movements have been moving closer and closer together and one, and now they’re in lock-step, with the major turns happening at about the same time.
it’s challenging because often times currency pairs are waiting for equities to turn, and other times, it’s the opposite. The other frustrating thing is that in between the major turns, there are no major trades; they’re all, for the most part day-trades. That’s certainly the case in corrections, where you very often have several possible targets for the end of the correction.
We’re now very close to a turn in the US indices, currency pairs, and oil. Gold looks like it’s still on hold a little longer. Elliott wave does not have a reliable timing aspect, but it looks like we should see a top in the early part of the coming week.
Know the Past. See the Future
_________________________________
Elliott Wave Basics
Here is a page dedicated to a relatively basic description of the Elliott Wave Principle. You’ll also find a link to the book by Bob Prechter and A. J. Frost.
______________________________
US Market Snapshot (based on end-of-week wave structure)
This chart is posted to provide a prediction of future market direction. DO NOT trade based upon the information presented here (certainly NOT from a daily chart).

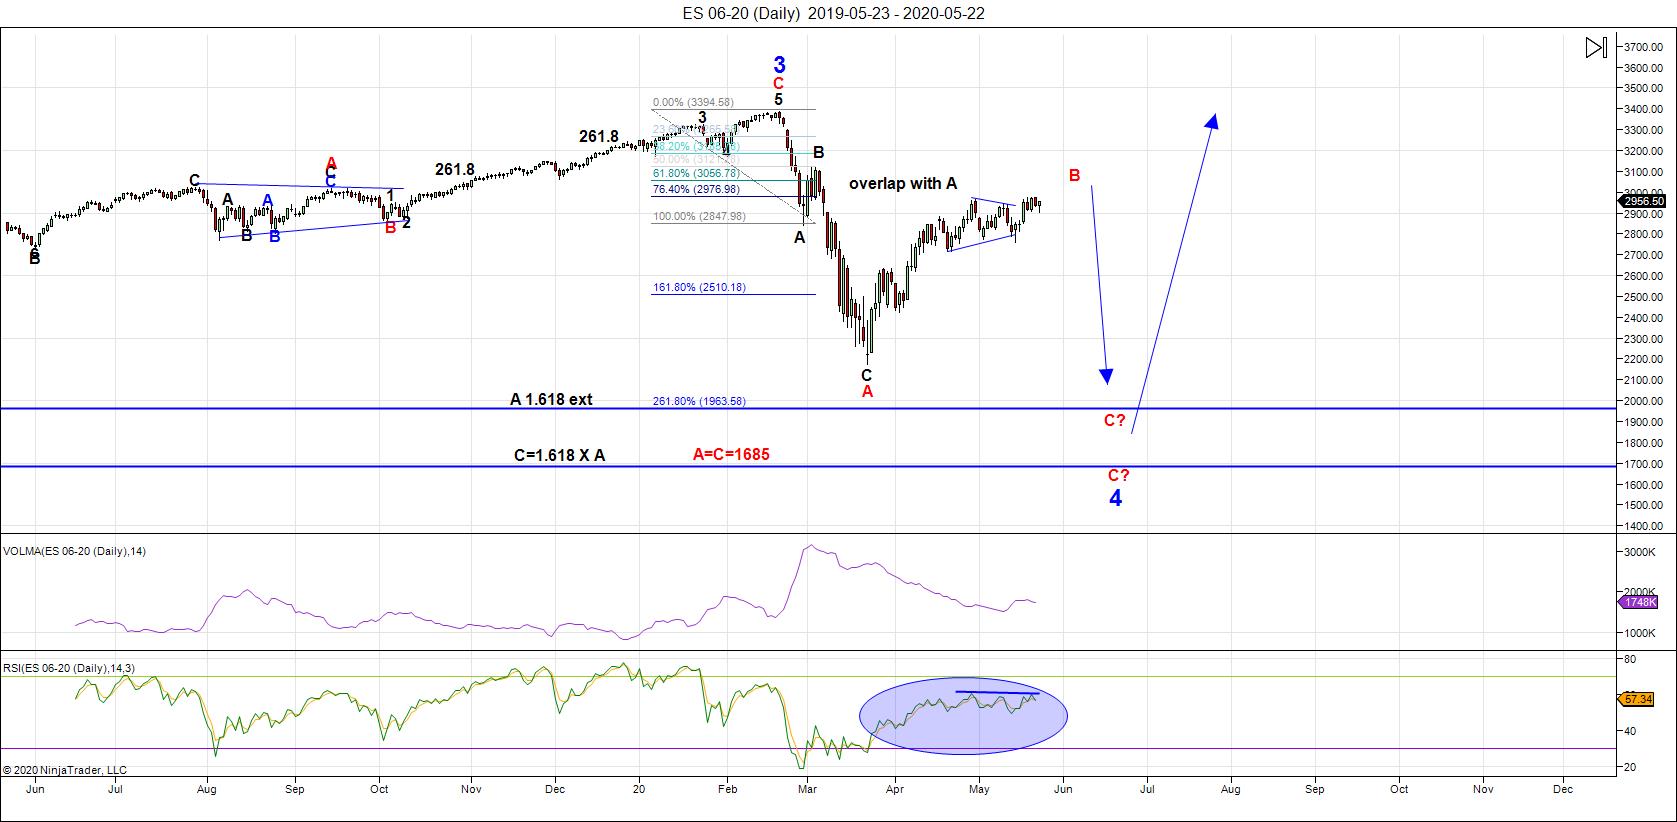
Above is the daily chart of ES (click to enlarge, as with any of my charts).
The US indices are clearly on their last legs — they're struggling to complete the last sub-wave up to a new high.
Elliott Wave is great on defining targets and direction (corrective waves are more problematic, as they can project several targets, based upon fibonacci ratios). Watching the sub-waves closely can keep you out of trouble, which we've done. That said, the waves for the past month have not been well-defined. That hasn't changed this weekend.
I'm expecting most major indices to reach new highs because the current counts to the downside are corrective and these need to retrace to present a clean slate for a five wave start down. The exception this weekend is the NYSE, which has a count to the downside of 5 waves, but this is on a 5 minute chart, so it's difficult to see the sub-waves. In any case, it's warning: We're very close to topping out.
The counts now between futures and cash are back on track again (last week, they were out-of-sync). This past week saw the typical final wave morphing into a variety of patterns. In ES, we looked like we were tracing out an ending diagonal early in the week, then a triangle, and finally, we dropped to a new fourth wave low.
This weekend, virtually every asset I cover has traced out a fourth wave and is currently in the fifth and final sub-wave.
Under the surface, this market appears to be falling apart.
We're witnessing the "All the Same Market" syndrome, where virtually everything is moving in tandem with the US Dollar Index. The problem over the past few weeks has been the fact that the US Dollar index is in a horizontal contracting triangle. You can't take much guidance from sideways movement.
This week was important for defining the count across all assets. Any day next week could see a top in place.
The zigzags down from the 3400 area in the SP500 took a month for the entire trip. This correction has now almost taken two months, something that is HIGHLY unusual and speaks to the manipulation of the Federal Reserve and the influence on the US Dollar.
As I stated last week: There's a lot of manipulation going on (the Federal Reserve is doing whatever it can to prop up the market with more debt — a very stupid idea, and you and I will pay for it in the end. Inflation through the extraordinary "printing" of debt has had its affect on the market overall. However, the problem is simply too humongous (the dollar is worldwide) and the Fed will fail. We're getting close to seeing the result.
___________________________
Summary: We appear to be in a "combination" fourth wave down from the 3400 area. After the first set of zigzags down, we retraced 62% of the distance from the top. We've been sitting in this corrective ABC retrace for almost two months. However, it's showing signs of a top nearby at the same time it's showing underlying stress — it's close to falling apart.
I'm looking for a top nearby, and next week looks important. Once we top, another set of zigzags down seems to be the most probable outcome for the journey to a new low, but it's early to be sure of the pattern.
Look for a new low below 2100: There are several possible measured objectives below that point. The timeframe has moved to early June, perhaps, for a final low.
Once we've completed the fourth wave down, we'll have a long climb to a final slight new high in a fifth wave of this 500 year cycle top.
_________________________________
Trader's Gold Subscribers get a comprehensive view of the market, including hourly (and even smaller timeframes, when appropriate) on a daily basis. They also receive updates through the comments area. I provide only the daily timeframe for the free blog, as a "snapshot" of where the market currently trades and the next move on a weekly basis.
I do a nightly video on the US indices, USD Index (and related currency pairs), gold, silver, and oil) right down to hourly charts (and even 5 minutes, when required).
______________________________________
Upcoming Webinar — May 26/28, 2020

It's free! Click here for more information and to sign up.


