
Update Friday, May 13, Noon EST
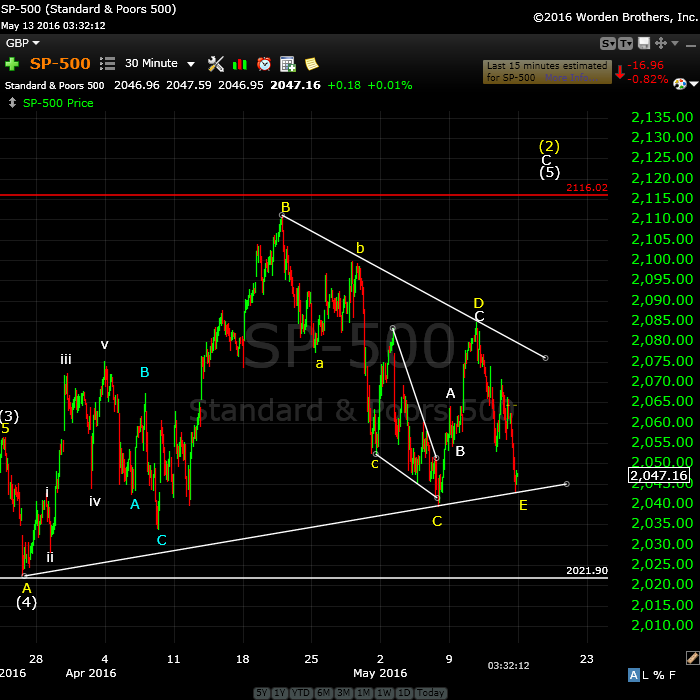
Updated at 3:30 PM EST: Above is the 30 minute chart of the SP500. The triangle appears complete now in the SP500, but not in ES. In the SP500, the direction now is up to a new high—the target still 2116. It may take us a while to get there. The wave up should be in 3 waves.
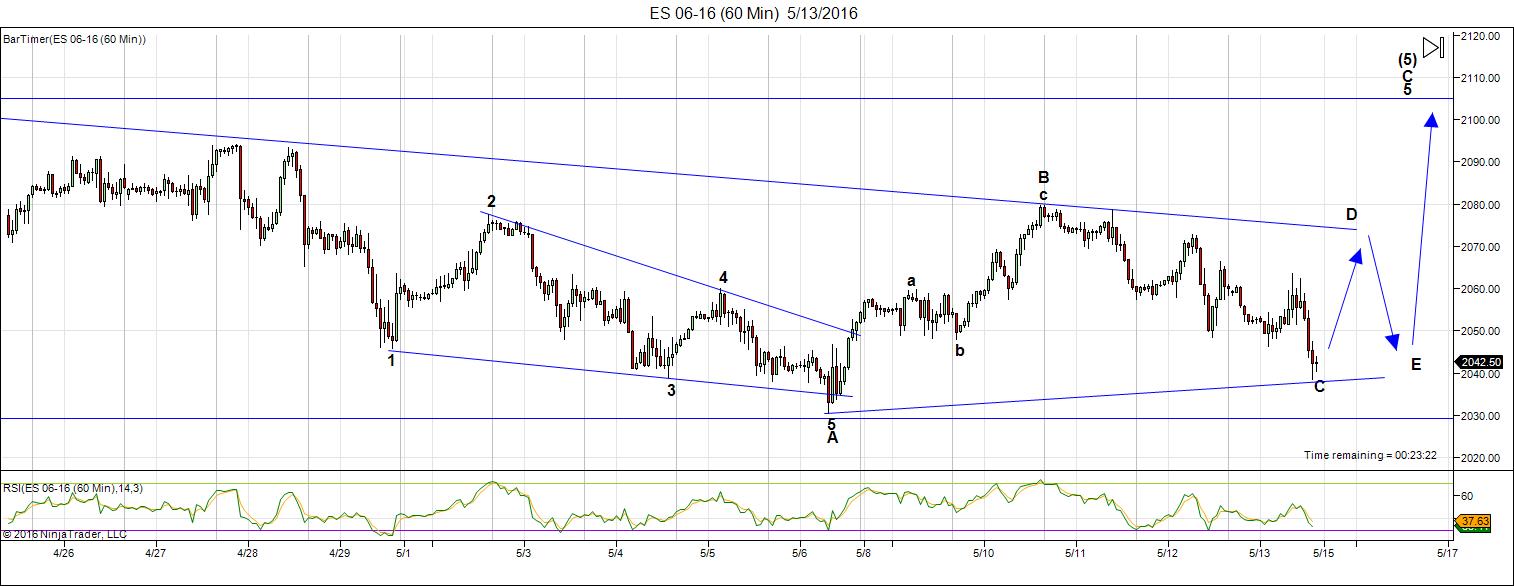
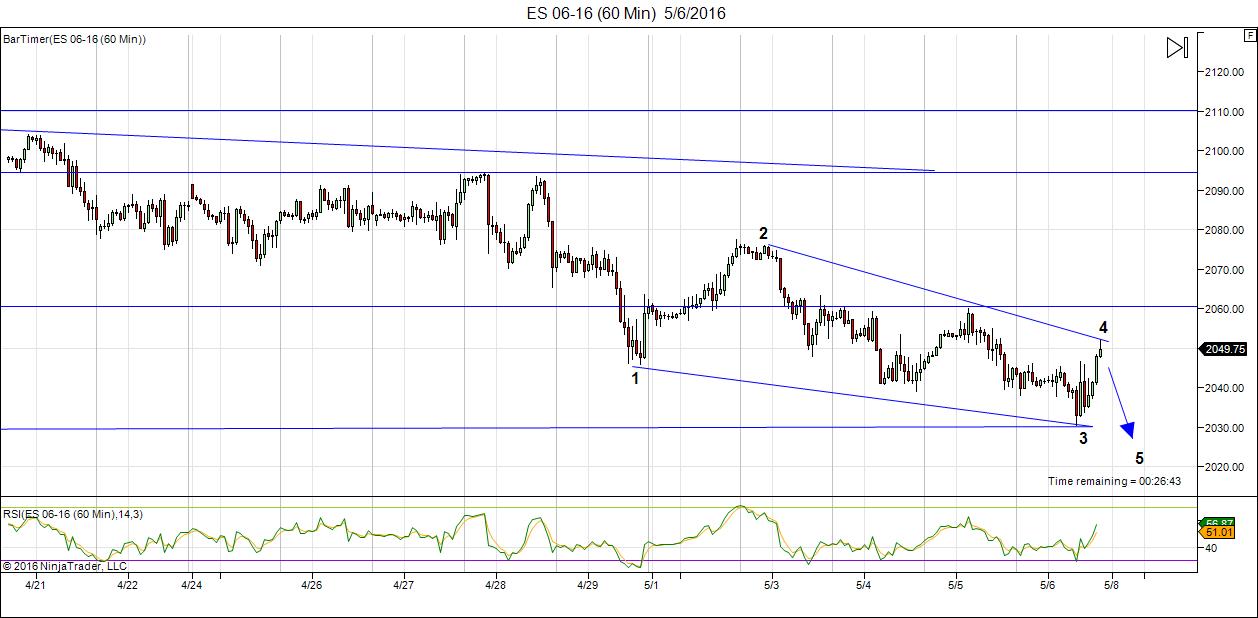
Updated at 3:30 PM EST: Above is the 60 minute chart of the SE (emini futures). The triangle for ES doesn’t match the triangle in SPX, in that the ES triangle has an additional “up-down” sequence to complete. As ES goes around the clock, the extra time it has should allow it to get “back in sync” with cash. However, now we have the full triangle defined and waves should trace out as per the arrows.
It will likely take a while to get to the top, and the target for now is the previous top at about 2105.
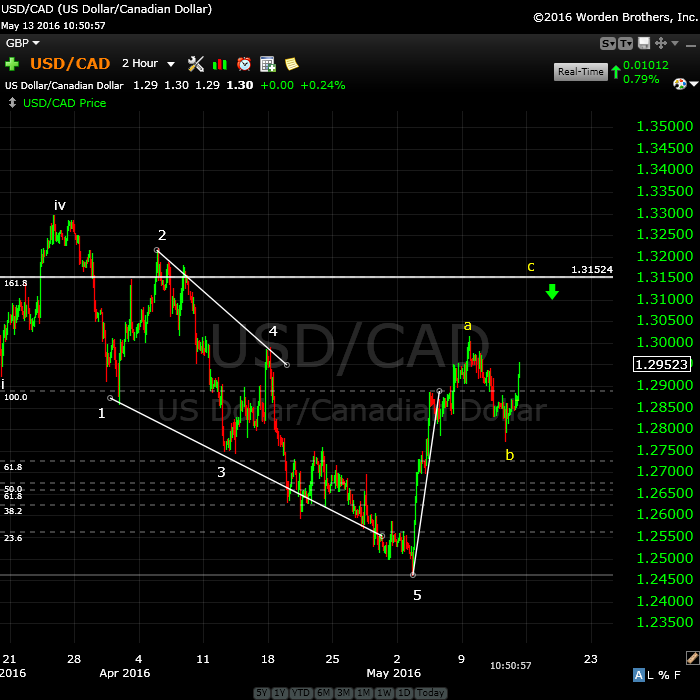
Above is the 2 hour chart of the USDCAD currency pair. This is a setup waiting to happen. After an ending diagonal, the pair has traced out an a and b wave. This is a 3 wave setup that will completely retrace to ~1.245. When it rallies to 1.315, it will be set to head down.
It’s a trade I will likely take but I don’t think we’ll see the setup until ES and SPX are at the bottom of the E wave.
______________________
Update Tuesday, May 10, After the Close
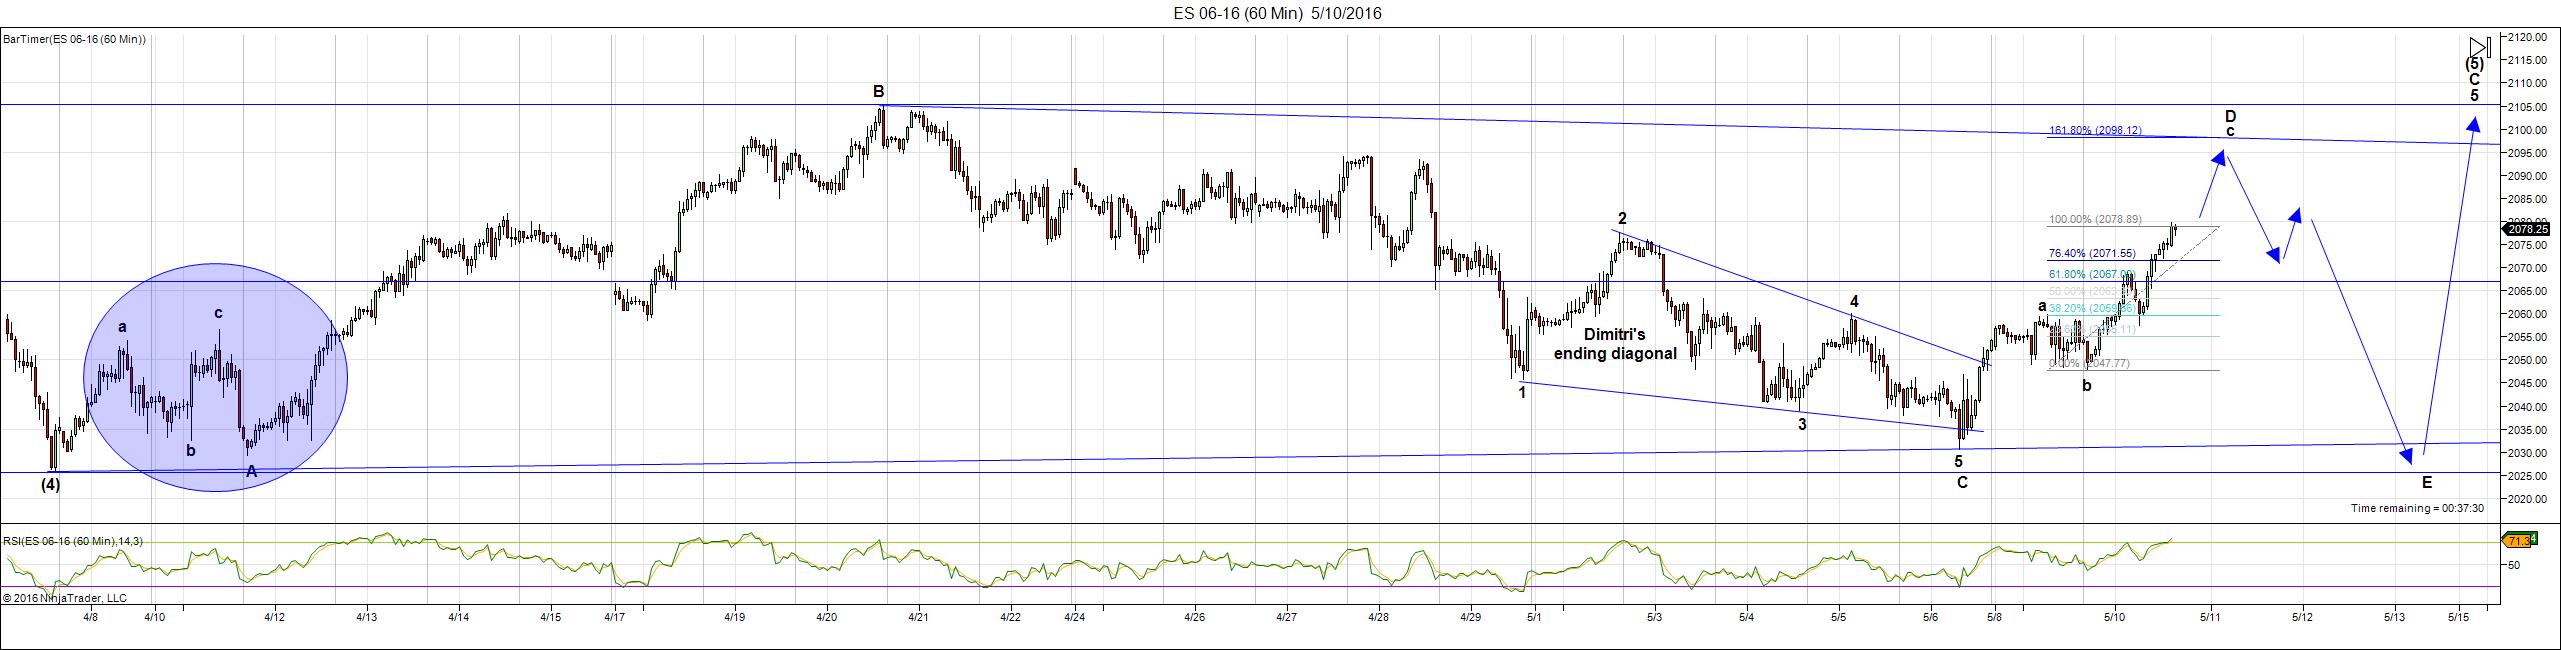
Above is a 60 minute chart of ES (SPX emini futures). Click to expand. This is a close up look at the entire 4th wave triangle so far. We have another leg up to a target for D of ~2095, before a turn down into the E wave.
I’ve placed horizontal lines at the A and B apexes, to show the symmetry of the triangle, which is important. This should give us a fairly accurate target on the downside for wave E (the “E” should be on the up-sloping trendline, not on the horizontal line).
I’m happy we’re in a triangle, as triangles denote the end of the trend. One final wave up (the fifth wave up from E) will end the wave up from February 11.
The blue circle on the left marks an area that gave us a clue as to the triangle early on. The waves in the triangle were in 3’s, meaning the entire pattern to come could not be a simple ending motive wave in 5 waves. All waves of a motive wave have to be in 5’s (waves 1, 3, and 5) or the wave would need to be a triangle of some sort.
In order to erase the influence of the waves in the circle, the structure would have had to correct to the bottom of the fourth wave, which it did not do (although I thought yesterday it would and that led to a very subjective decision on my part that the ending diagonal was not complete). Every once in a while subjectivity creeps in, although I try very hard to keep it on the shelf.
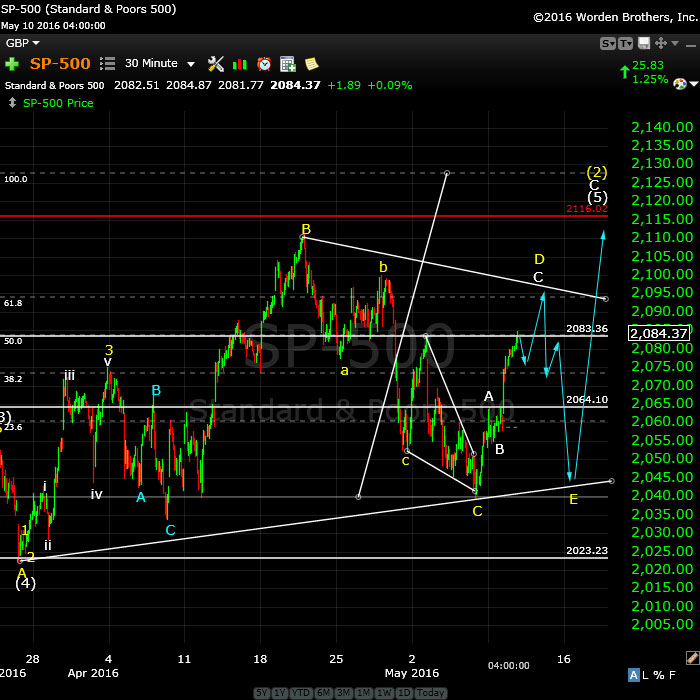
Above is a 30 minute chart of the SP500. The triangle is still alive! This is an updated chart showing the balance of the path to finish the triangle pattern. The target for this wave up, which would be the D wave, is ~2095. Wave C of the D wave would be 1.618 X the length of the A wave at that point.
The entire length of wave D will also be .618 X the entire length of wave B, which is a normal relationship in a symmetrical triangle.
___________________________________
Original Post: Saturday, May 7, 2016
“Trade what you see, not what you think.”
Elliott Waves are how the market moves. You can either refuse to believe and continue to guess or pick off little trades from time to time, or embark on a path to embrace and learn how to use them and spend less time analyzing and more time winning. It may take a while to achieve the latter, but eventually you’ll eventually see huge benefits to your profitability.
It always amazes me how I can be continually correct in my calls (in the 90 percentile) and yet there are many that just will not buy into the fact that the Principle works, or they’ll simply pay it no attention.
There’s a well known quote attributed to Albert Einstein (but he has professed that he never said it) that has been dubbed: “The Definition of Insanity.”
“Doing the same thing over and over again and expecting different results.”
It’s up to you open up to new ways of doing things. A tiny percentage of people in the market can build a nest egg from trading it. It takes lots of study and in-depth analysis of the tools out there. Whether you make the effort to learn everything you can about them is up to you, of course.
Last week, I focussed on the importance of waves in 3. They figure heavily in today’s report, of course, as the reason we’re going to down on Sunday and will finally finish off this fourth wave.
We have ending diagonals in all the indices and futures. We had a set of waves up on Friday in three waves.
I laid out my prediction on Friday (here it is again, if you missed it):
An ending diagonal drops to a throw-over wave (it should exceed the lower trendline). In this case, our target is 2023 for SPX. Ending diagonals are the final waves in a sequence. It will end in a dramatic reversal and the first wave up will go to the beginning of the ending diagonal pattern (in this case, about 2083).
The larger wave down from the top is overlapping and the waves are in 3’s. So this is a corrective wave down. The bottom line is that the medium term direction is still up. We’re looking for a bottom for this wave. I suspect the wave down will last through Sunday, which means we may bottom Monday morning.
A full fourth wave ending at SPX 2033 or a bit lower would suggest a fifth wave up in 5 waves will be the next move.
USDCAD and EURUSD are also in fourth waves now, consistent with that the equities are doing. USDCAD should now turn down and EURUSD up (once the 4th wave in US equities has bottomed).
All the Same Market. I’ve been mentioning for months now that the entire market is moving as one entity, the “all the same market” scenario, a phrase that Robert Prechter coined many years ago, when he projected the upcoming crash.
______________________________
Here’s a video overview of the market for Monday, May 9, 2016:
Market Report for May 9, 2016  |
 |
Make sure you zoom the video to full size with frame expander (arrows) in the bottom right hand corner and also set the quality to as high as your web connection allows. This is an HD quality video so the best viewing is at that level. |
_______________________________
The Charts Going into Monday
On Friday, the market showed its hand. This past week, the highest probability was that we were in a fourth wave triangle. Friday morning, we fell out of the triangle and it was clear that the market was finally going to tell us what it was doing. Cash and futures are now pointing in the same direction with an ending diagonal in progress.
Above is the 60 minute chart of ES showing an ending diagonal (more info in the video). If so, we’ll see one more wave down. The wave up today is in three waves, so it should come down.
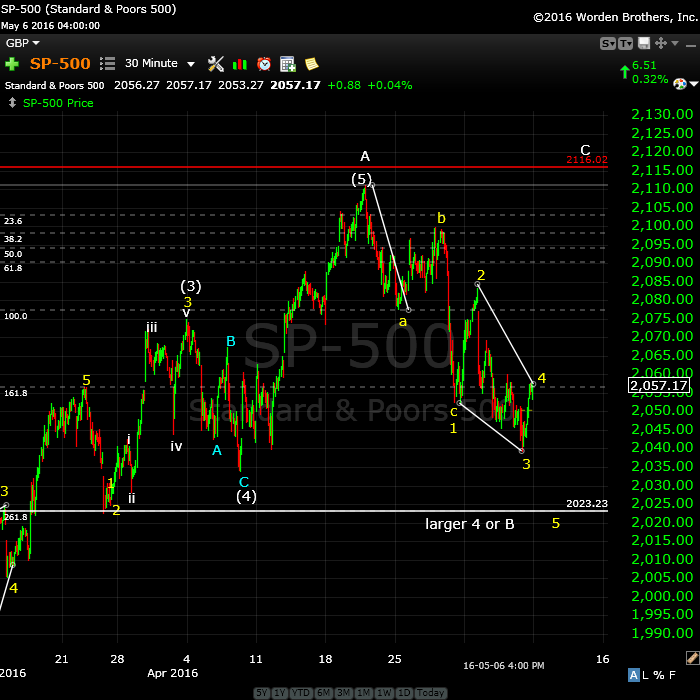
Above is a 30 minute chart of SPX. The waves up on Friday were in 3 waves (you can see the abc configuration in the video). Waves in 3 always retrace. So we need to get to a new low.
An ending diagonal drops to a throw-over wave (it should exceed the lower trendline). In this case, our target is 2023 for SPX. Ending diagonals are the final waves in a sequence. It will end in a dramatic reversal and the first wave up will go to the beginning of the ending diagonal pattern (in this case, about 2083).
Important money-making tool: In terms of the downside target, I’m using the same technique with the fibonacci retracement tool that I showed in the video. This is an extremely reliable tool you can use on all 2nd and 4th corrective waves. You can see that I’ve overlaid it on the chart to span the first wave down (100% level of the fib tool). The extension will almost always point to the end of the C wave (either at the 1.618 or 2.618 level). In this case, it’s pointing to the 2.618 level at 2023. That’s also arguably a 4th wave level (my numbering is a little suspect in terms of which corrective wave is the actual 4th).
The larger wave down from the top is overlapping. So this is a corrective wave down. The bottom line is that the direction is still up. We’re looking for a bottom for this wave. It looks like we’re going to finish this fourth wave. I suspect the wave down will last through Sunday, which means we may bottom Monday morning.
A full fourth wave ending at SPX 2023 or a bit lower would suggest a fifth wave up in 5 waves.
USDCAD and EURUSD are also in fourth waves now, consistent with that the equities are doing. USDCAD should now turn down and EURUSD up (once the 4th wave in US equities has bottomed).
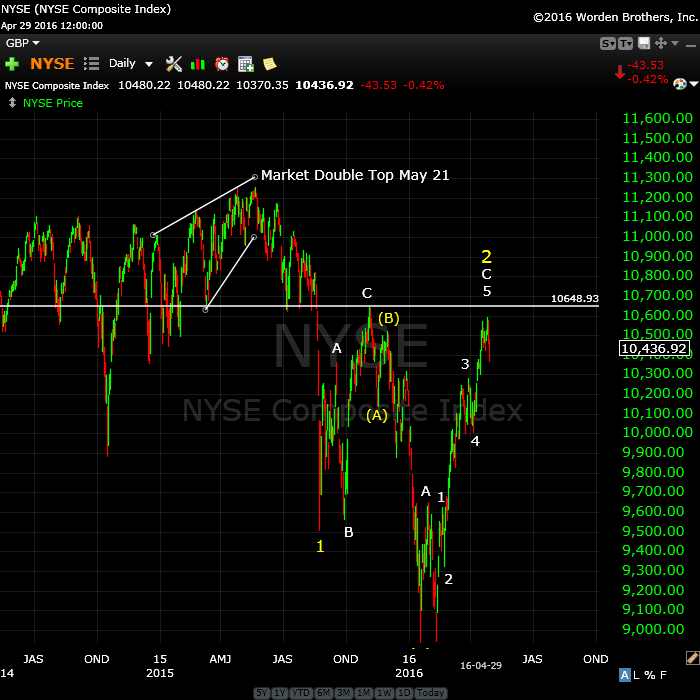
Above is the daily chart of NYSE. I keep a fairly close eye on this index as it’s by far the largest in the world (in terms on capitalization). We are at the top of an ABC corrective wave (a bit more to go). I’m expecting a termination of this 2nd wave up at ~10648. This would “correct” the truncation and end in a double-pronged second wave. Third wave down should drop to around 6100.
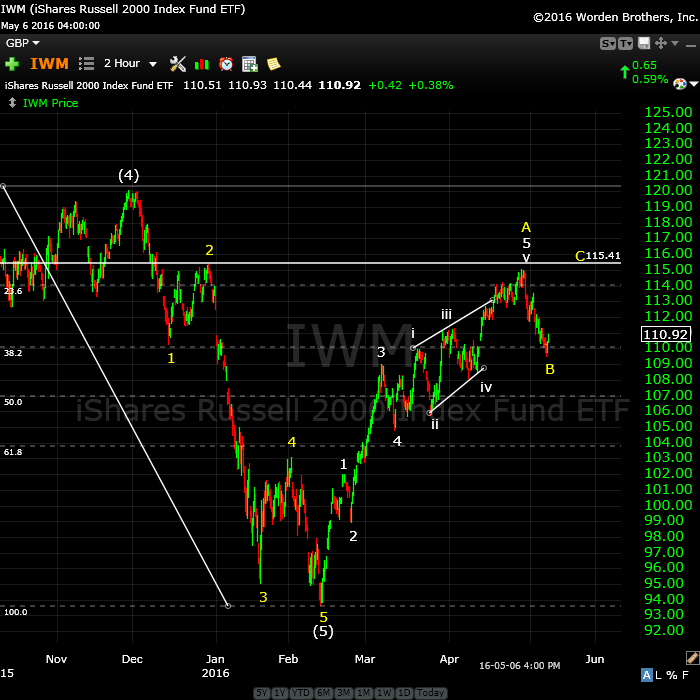
Above is a two hour chart of IWM (Russell 2000). This shows another perfectly valid way to label this wave up. It’s traced out a very obvious ending diagonal with the “throw-over” to complete. The first wave up has no second wave (as per the major indices), so as with the major indices, this is a corrective wave. The current B wave down should now turn up to create a double top. I expect to see 5 waves up from here.
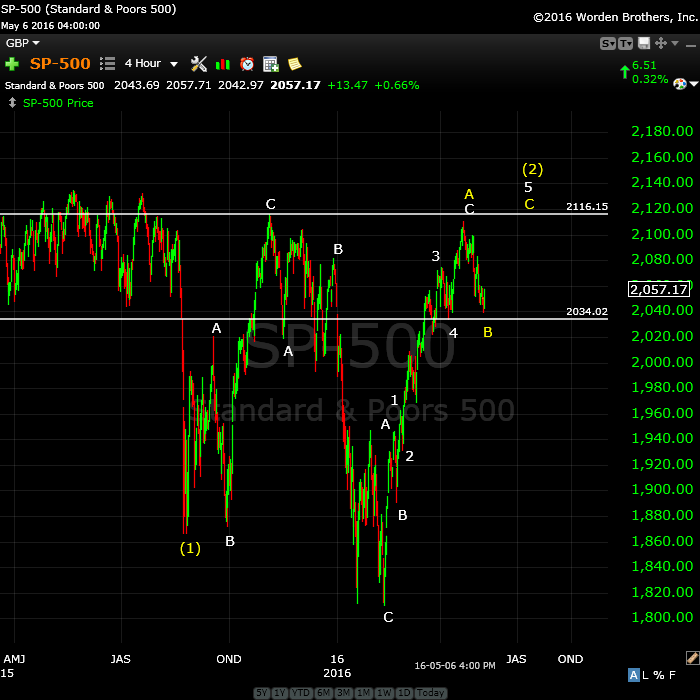
Above is the 4 hour chart of the SP500, showing the double 2nd wave top waiting to finish tracing out. This would negate the “truncation” and create a spectacular EW textbook set up for a huge third wave down.
Second waves have few restrictions. The key rule is that they can not retrace to the previous top. They should retrace between 62 and 100% (but cannot hit the 100% retrace level). I expect us to reach 2116 before a turn down.
It’s typical in a bear market for second waves to trace out a double prong (an ABC wave down in this case and a 5 wave structure up). The five wave structure, however, is not motive (subwaves won’t necessarily all be in “legal” 5 wave motive configurations). I have therefore labelled this wave more correctly, showing that it is indeed a 3 wave corrective wave, with the C wave up expected to produce a final ending wave of 5 waves.
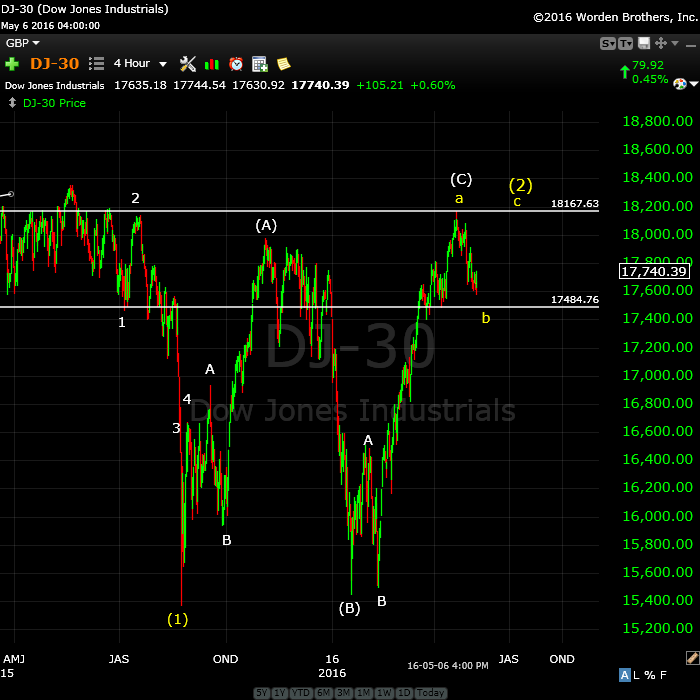
Above is the 4 hour chart of the DOW. It’s similar to all the other indices, as it should be. I predicted we’d reach the previous 2nd wave high and that in fact is what we’ve done. Look for a double top with the most recent high before a turn down. The reason I show this index is that I’m always looking to other indexes for confirmation of a move. You’ll note that the DOW did not come down to a new low in February, so this puts it clearly in a corrective abc wave up. As all the indices move in tandem, this supports the fact that SPX is also in a corrective wave.
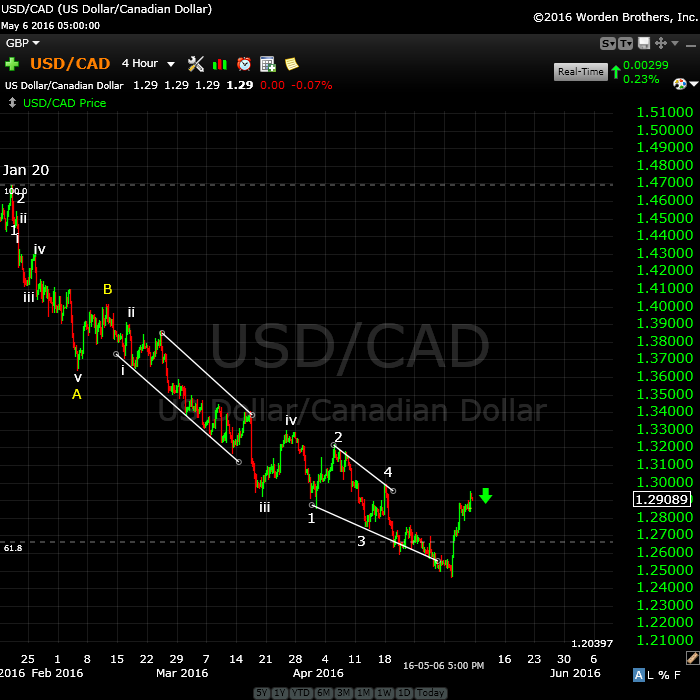
Above is the 4 hour chart of USDCAD. I have been stalking this for some time, waiting for it to bottom and we have the first signs now.
The larger pattern is an ABC corrective wave, and we have an ending diagonal, which looks to be complete. However, I expect this wave up in 3 waves to trace out a double bottom (to ~1.246) before turning back up into a very large 5th wave.
The euro, Australian dollar, dollar, and Canadian dollar are all at similar major inflection points.
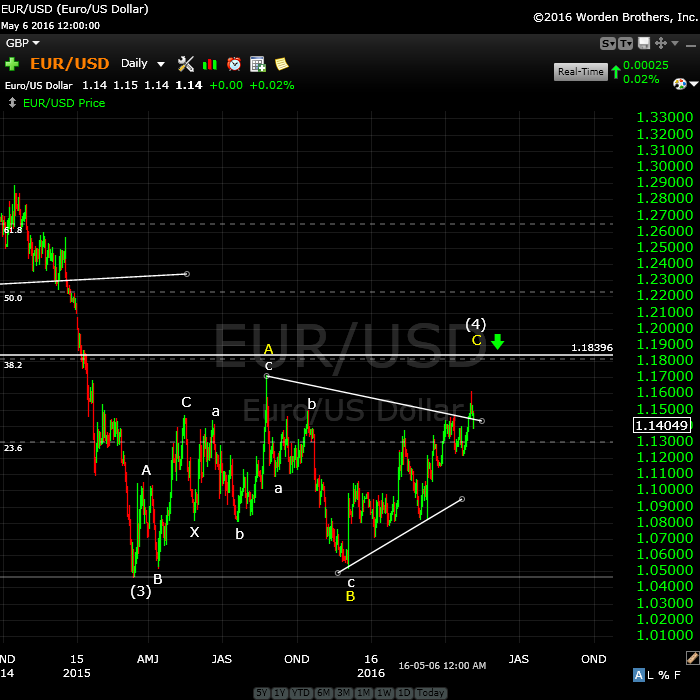
Here’s the daily chart of EURUSD showing the major corrective pattern from the low of March, 2104. The triangle configuration hinted at with the converging trendlines is no longer, so I predict we’re going to hit the 38% retrace level, that I’ve been suggesting for the past 8 months or so is my preferred turning point.
It should turn in tandem with the US equities.
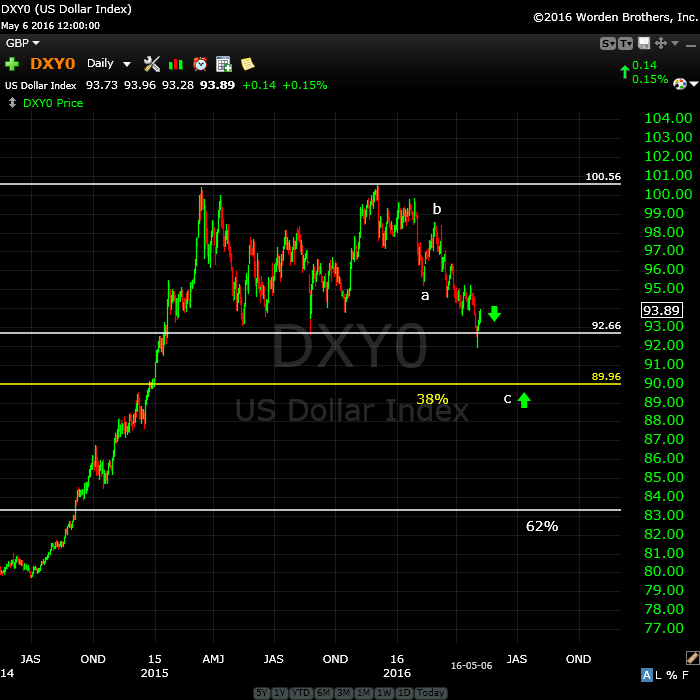
The US dollar (this is a 3 day chart) should do the same thing but in the opposite direction (up). I’m up in the air right now about the structure of this entire wave. Although in 5 waves, it looks more corrective to me than motive.
Short term, however, we’re heading down to the 38% retrace level (which would be the expected place to end this correction).
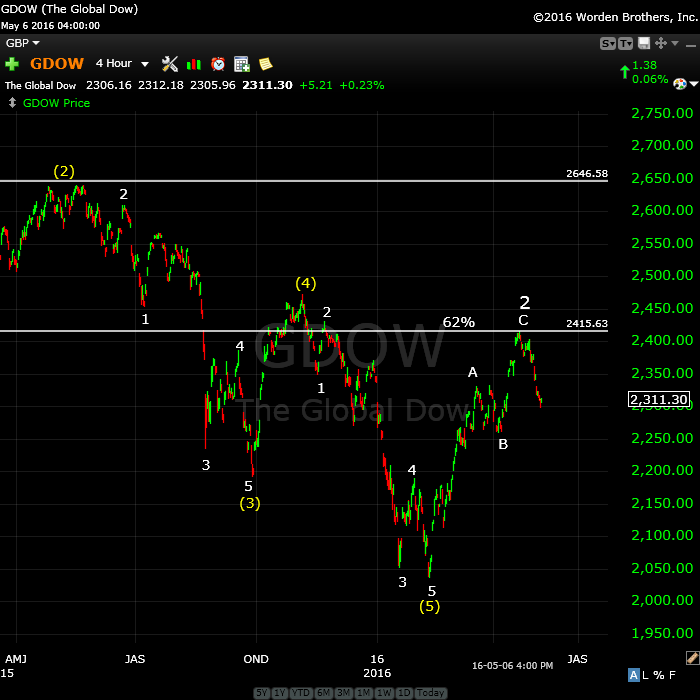
Above is the 4 hour chart of GDOW (Global DOW) showing the current count. The short story here is that we’ve done a complete set of 5 waves down. As a result, the new trend is officially confirmed at DOWN. The second wave we’re in now has retraced exactly 62%.
Bottom line: All the indices are lining up for a HUGE third wave down. More confirmation!
Major international indices like the GDOW and NYSE are where I do for the overall count. I can be much more committed (as I was on the SP500 first wave down, while everyone was questioning it) when I see a count on these two indices which is clear.
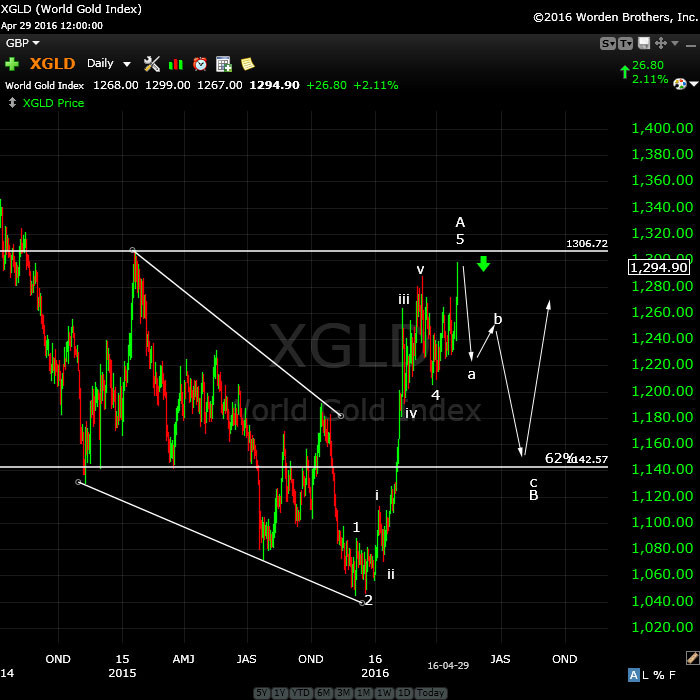
Above is the daily chart of XGLD (gold). No real change here in the past week. The bottom line is that we should turn down here. If we go much above the previous fourth (horizontal line) then I’m obviously wrong and something else is going on.
The target on the low side is the 62% retracement level, somewhere close to 1142.
________________________
First Wave Down – What to Watch For
This weekend we’re dangerously close to a top of a second wave (in the fifth of the fifth, with an ending diagonal pattern).
What we’re looking for to confirm a turn is a motive wave down in 5 waves.
Because we have an ending diagonal, the first wave will likely drop to the previous fourth, which is also the beginning of the ending diagonal pattern (~2022). After that, we should get a second wave that will retrace in 3 waves about 62%. That’s the preferred EW entry point. So don’t feel you have to rush in. There’ll be a much better opportunity at the second wave level than at the top and the risk is substantially reduced.
__________________________
History: The 1929 crash
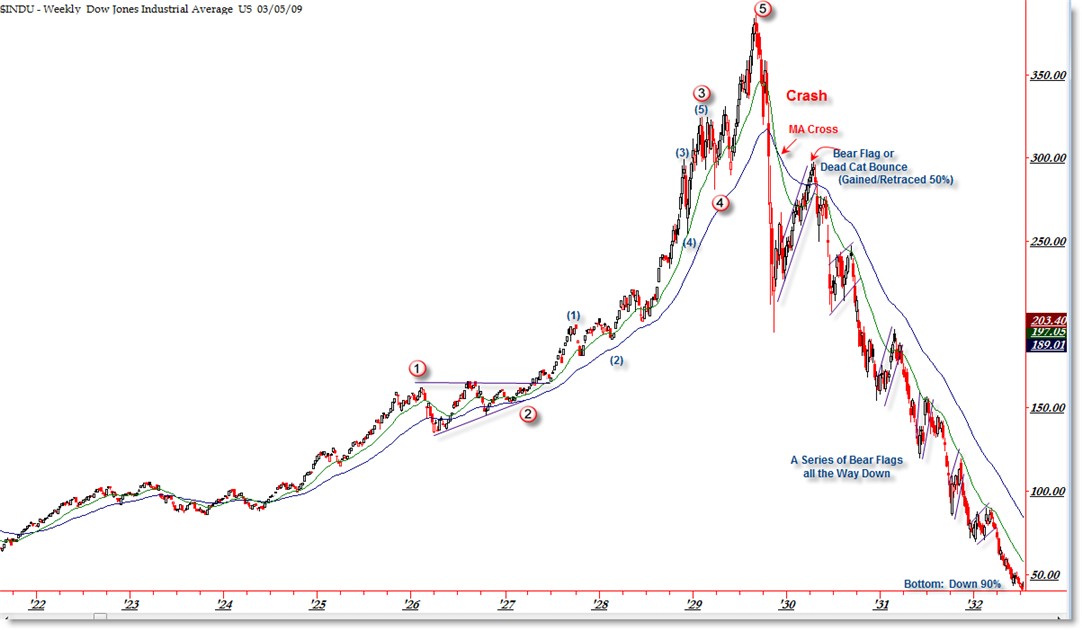
I think it’s important to look at 1929 and the wave structure (above and below), which was the same as 2007—to a point. I will show the 2007 crash below in the “What If” section.
The wave structure of the 1929 crash was in 3 waves overall. There were 5 waves down from the top (the A wave) and then a very large B wave retrace. The final C wave down was a stair-step affair and lasted over 2 years.
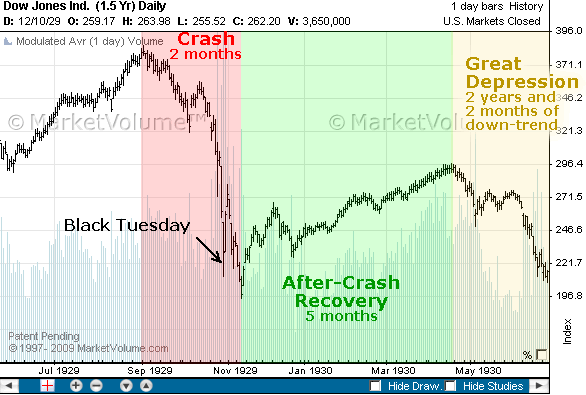
Let’s look a little close at the timing of the 1929 crash because the similarities to today are uncanny.
The market peaked on September 3, 1929 and then it took 2 months for the crash to actually happen (to reach the bottom of wave 5 of the A wave). The larger crash which we always hear about began on October 23, 1929. Then there was that large B wave, which lasted 5 and a half months and finally (which I explain a little further in the cycles section below), the C wave which went on for more than 2 years. This might be the scenario we’re looking at going forward.


Peter,
looking at the 1929 chart, if this crash duplicates 1929, would this upcoming (high) in the S and P at ( 2016 )correspond to the lower high (october 23, 1929) before the bottom fell out into early november 1929 taking 9-10 trading days.
I would say, “probably.” This is a second wave, although it’s retraced almost back to the top (as second waves can) likely due to the elevated social mood influenced by media, government, and all the other forces at work trying to keep this false economy alive. Those forces weren’t in existence in the ’30s.
Thank you Peter, Very good presentation , It could not be clearer….n
clear, concise, easy to understand…thanks for sharing!?
Great work Peter…do you see a correlation with the markets and the Yen going down together..or is that correlation non existent?
That should be the correct correlation. The US dollar will head up as equities head down and yen will travel down. USDJPY, should continue to correct a bit further before reversing. I see that in against the pound, as well. Yen should head up – the correction is almost over.
How long do you see this last 5th wave up playing out? Days, weeks, longer? Thanks for all you do!
Don’t know at the moment. We should be done before the end of the month, I would think.
Peter,
I really appreciate you taking the time to explain this subject. I still feel there is subjectivity to it but I’m also learning. I have a specific question about your current wave count in the SPX. If you look at the daily and compare your NYSE count and your daily DJIA count to your SPX count, You have labelled the FEB 1st high in the former two as A and the FEB 11th low as B. But on the SPX you ignore the FEB 1st high and have labelled Feb 17th as A. That seems inconsistent to me. I am wondering, is that because the FEB 11th low in the SPX violated the Jan 20 low but it didn’t in the former two? Just want to understand the rules.
Thanks!
Duke
Duke,
Yes, exactly. The DOW not having gone to a new low makes it very obvious this wave up is a corrective wave. The indices can never have different overall counts. Or maybe a better way to put is that the indices can have slightly different counts overall, but can’t be out-of-sync overall. So because the DOW is obviously in a corrective wave up, the other indices have to be also. So it just confirms that the waves up are corrective in all of them.
And btw, there’s subjectivity to it if you don’t play by the rules. The key is to stay totally objective and be meticulous in your analysis. Then your level of accuracy sky rockets.
hmmm….so peter – question….for a brief while you had a “truncated” wave ‘v’ for A of 2 for the spx.. [you subsequently changed it – but this is a hypothetical]. ‘hypothetically’ – what “if” the way you initially had the count was “correct” – that wave v of A was truncated. then in “that” world – wave C did in fact make a new high above the wave v of A at the 2111 price level? in that world, the c wave could be “complete”?? hypothetically?? 🙂
last week, i commented as to seeing a move to the bottom of the bollinger band at 2040 area. we hit 2039. then on friday i saw an “anemic” move to the 2066ish area – give or take a few points as unlike you, i am seeing a series of 1-2, i-ii, [i] [ii] ‘s to the downside. if we go higher – to the 2075 area, then we are retesting the middle of the bollinger band – which is ok too….. For me, the next move for the market is a “potential” break away gap to the “downside”……. hmmmmm…. i guess having many perspectives is a “good” thing…. it what makes a market…
I agree,
We are still in a high correlation with May 2010 and close to where the bottom fell out..
If …. than we will visit the Februari lows in now time.
I bought some puts..
Good luck to all..
so john, the way i see it – in this algo driven market – that the algos have a tendancy to “spike” the vix and generate “panic” selling [which is in fact a short term- algo “bullish” behavior] for wave iv’s of any degree. this leads to the wave v up.
so far, we have been algo “walked” down, with NO spike in the vix, and NO panic selling. this tells me that in the ‘algo’ world – a much bigger move is being incubated. Given where we are in the wave count – it could be a “potential” for a the ‘hatching’ of a very big move – in this case to the downside…..
Last 24 hours has produced mostly 7s on the K index which is the highest in quite some time. Today is Mercury inferior conjunction. Elevated K index is probably due to effect of Mercury moving between sun and earth.
Valley,
How is PALS system for this week. Is it aligning with Peters expectation.
Bill
Hi Bill, I am long one AAPL call exp. 5/20, and one SPY call exp 5/13. This week and next are seasonally weak and PALS is mixed but AAPL bet was on snap back which isn’t happening and SPY bet is based upon slight chance of ramp up into Friday based upon post N declination pattern where every few months there is a ramp week after N declination. I am assuming a financial mania (Sat in Sag) in next two years that will double Dow but we may get major selloff soon to make it even more profitable.
Thanks Valley,
will you get in quick short if we reach 2095
I don’t know since PALS is mixed next few weeks and even though May is usually choppy and not bullish, we could get a ramp that lasts three or four days, with all the gains given up in a few days after that.
slow to move which is why i do not like 4’s and b’s.
The SPX and ES went slightly above the target. In each case, the C wave was exactly 1.618 X the A wave up. We still appear to be in an ending diagonal in those indices. I’m not sure about the Nasdaq, though, as the trendlines don’t seem to be converging. I don’t have a downside target for it.
I still expect a continuation down, as the waves up were in 3 waves. A whole lot of churning today.
how did you truenews interview go today Peter? doesn’t look like it has been posted yet
Scott,
It went well, I think. We were all over the place in terms of content. It should be posted shortly, they tell me. Thanks for asking.
Well, the market continues to escalade the curtain.
My count is now wrong. But I can’t figure out the right one. This must still be a triangle, I think. It is not an ending diagonal, if it ever was.
My count was wrong at 2060 ES. We’re going up. I can count 5 waves up, but the first one of course was in three waves and we look to have a shallow b wave. So I suspect we’re in a triangle after all. If we were going up in an ending wave, we would have to have a motive wave up. And this is not a motive wave.
I posted a chart of ES with the count as I now see it.
You may have been right with the ending diagonal, but there was virtually no throw-over, so more like a wedge. I placed a chart of SPX at the top of the chart showing the triangle.
interesting cycle chart to look at syncs up with 2 previous waterfall selloffs 8/17 and 01/02/2016 https://pbs.twimg.com/media/CiC4R58VAAEWems.jpg:large
December 29, 2015 + 134 calendar days = Wednesday, May 11, 2016
This is really interesting!
5/11 is a bradley turndate
http://1v1in9i1muw2u2mg2be81tyt.wpengine.netdna-cdn.com/wp-content/uploads/2014/07/2016-SP-500-Bradley-Siderograph-Turn-Dates-Large-2016-04-18.png
http://1v1in9i1muw2u2mg2be81tyt.wpengine.netdna-cdn.com/wp-content/uploads/2014/07/2016-SP-500-Long-Terms-Turn-Dates-Large-2016-04-18.png
134 days peak to peak…?
December 29, 2015 + 133 calendar days = Tuesday, May 10, 2016
here is another symmetry chart showing days between tops and bottoms targeting a low on 6/16/2016 . we have had 4 tops 5/20/15-4/20/15 and four bottoms 8/24/15-2/11/16 https://pbs.twimg.com/media/CiCsmPuVEAAWWwZ.jpg:large
Cool chart. Thanks for posting.
ZigZag is the master of stock market symmetry…?
My Trunews interview: http://www.trunews.com/trunews-050916-peter-temple-facebook-fascism/
The count has changed this morning. I should have stuck with the triangle. It seems that it’s the operative pattern. This is a very tough market to analyze and trade at the moment. The wave up is not well formed, but I place us in the C wave of the D wave of a triangle (the same pattern we were watching last week).
As I’ve been saying, we only have two options here – either a triangle or a traditional fourth wave (which would require 5 motive waves up in a 5th wave to the top). We don’t have that so far, so the fallback option is still the triangle.
I replaced the ES chart with a new one at this morning just before the open.
Critical juncture. Some really good analysts are saying Feb was the bottom, consistent with A/D line, 4 yr cycle low, it is a clear ABC down from the top, and the strength shown. The bearish case is our Elliott count as well as Caldaro’s. Phillip J Anderson’s idea that 2008 was the RE cycle low and all is good until 2025 keeps popping up in the back of my mind.
There should be a correction coming up soon (the fourth of the third, I think). Then we should continue up after that. Perhaps it will be overnight. In SPX, it should happen about 2083.
Is this 1980 to 1998 redux? 1980 Reagan (a outsider, non politician conservative with media skills) is elected at end of 17 year market slow down.
2016 Trump (an outsider, non politician conservative with media skills) is/may be elected at end of 17 year market slow down.
Reagan was governor of California, but was for decades known mostly as movie actor.
Hi Valley,
Now you are talking my language. I think we have one more drop before we get the start of the next 17.6 year secular bull market cycle. My 22nd May low now looks unlikely but between here and end Oct I expect to get an big buying opportunity (Feb 2017 at the latest).
ATB,
Kerry
so is this how Citadel and the top 10 HFT Hedgefund traders make $13billion a in a year? wait for week tops, put/call ratio of 1.55 (like today) then jam futures and spoof the ask all day during low volume days? 56mm shares in spy today
Peter,
where do you see the end of the 4th wave in ES or SPX ?
ES: 2071.57. That measures 1.618 extension from wave 1 down so far and also 38% from the start of wave 3 up, so I’d say that’s pretty likely it. It could also go a little lower to the bottom of the previous 4th at ~2069, but when those two measurements match, it’s more likely to be the first number.
pretty small drop.
ES drifted a bit lower before doing a B wave, so I would put the low target at the previous fourth (about 2069).
I posted two new charts at the top of the post (ES and SPX).
Peet,
You remain my hero! 😉
Cheers,
W
You’re alive! 🙂
I am but very busy my friend! 😉
Cheers,
W
Mercury inferior was yesterday, K index still elevated. Probably what is giving gas to this rally.
Hello Peter,
Will Wave E for both ES and SPX retest May 6 low? Tomorrow maybe at end of day or Thursday?
No, not if this is a triangle. It has to stay within the trendlines, which are converging. It will get close, though, but that depends on how long wave E takes to drop.
Thank you Peter. BTW, tomorrow is May 11.
January 11, Feb. 11 and April 11 were all down days. Two days from now is Friday the 13th. Based on Detrick’s stats, Friday the 13th on May is the 3rd worst month for the year. November and October were the first and second worst, respectively. http://ryandetrick.tumblr.com/post/133082620500/should-you-fear-friday-the-13th
Despite the stats above, I went long some stocks at the morning dip for a swing. I may get out at the open.
We should get the start of the E leg down within the next 48 hours.
So if I understand this correct, we have a little more upside, then another downturn to 2040 followed by one last trip up before a waterfall?
Correct, again if this is a triangle and that certainly looks like what it is. If we go outside the trendlines or don’t follow the path I’ve laid out, something else is going on. Once you get a triangle set, they can wander around the confines of the trendlines a bit, but that’s about it. 🙂
Futures went right to the 4th wave target overnight, so the open will send the cash indices down slightly, then we should turn up to head up today to the wave D target.
Peter, still looking for 2098 ES as the D target?
It’s more like 2095.
Now that we’re awake … lol.
ES and SPX have now retraced the required 38%. We should turn here. It shows how important the fibonacci ratios are. We’re starting this 5th wave over again, by the looks of it.
Thanks Peter very clear,
Yesterday I had an update from HFT trader :Algo’s and Darkpools were both selling this rally from the lows (2040).
So I saw a top yesterday and bought shorts also the bradley made a sharp turn yesterday till beginning of June,Mercury still retograde in Taurus like 2010 so a big drop is likely so this is my contrarian dutch Tulp view (lol).
Our culprit is the SP500, which has dropped to the previous 4th wave low, slightly below the 38% retrace level. This should be the final resting place (the previous 4th wave is at 2071.50)
Boy … surprises to the downside! Well, we’re down in 3 waves all over the place, so the direction is still up. No changes in terms of targets.
Peter,
is the triangle still in tack given we have broken 2071?
if so, how far could we drop and keep the d wave target?
thanks
tjames
tjames,
I said yesterday, I think it was, that waves within a triangle (because they’re corrective and in 3’s) can wander just about wherever they want but have to stay within the confines of the trendlines. There really aren’t any rules about the waves themselves. A B wave can be as long as it wants.
However, the waves have to eventually hit the apexes, 3 on the lower trendline and 2 on the top, before a final wave up. Those are about the only rules.
In spite of the selling occurring today, does your wave count still see the likelihood of seeing 2090s ES by the close on Friday?
Yeah, I would think so. This is a triangle do anything’s possible, as I said, within the confines of the trendlines. Never sure of timing, but the 2090s are no far away.
welcome to babylon – where everything is controlled by the globalists using the cycles to their benefit https://www.youtube.com/watch?v=yoH5kI8xun4
Hee hee we are the flying monkey’s we like to f… up your mind we trade what ever we want to..
If you think you have figured me out the season is already changing so if you think we crash we buy…
https://www.youtube.com/watch?v=6ge53QaDpKQ
Dear swissmaple,
I have been following Peter from the beginning and I think It is not fair to judge Peter this way he made lots of good calls and you can’t win them all.
He does a lot of work for free so please show some respect.
Your targets have been wrong all week. On Sunday, you said we were going down at start of week but instead SP rallied hard up; oops you said you counted waves wrong. Then we were to have a mild drop to 2075 today. Oops again. You keep saying in your weekend updates how accurate you are.????? And now ????
Welcome. You’re obviously new here.
Hello Swissmaple,
Looking forward to any price action theory you may want to share so we can all learn together.
I am biased to the downside tomorrow.
Rude.
Must have missed my prognosis for this wave up, which has been in place for a couple of weeks, and then there was my warning about surprises to the downside last week, and the many posts about corrective waves, wandering around a triangle, etc. I didn’t expect the additional drop of 9 points SPX (big deal), but why I don’t like to comment on intraday. So I’m OK. And I don’t trade intraday.
So this is the major B wave of the wave up, since the previous one was so shallow.
hmmm…so on last friday we hit the bottom of the bollinger band in the spx on the daily time frame. the bottom band is “flat” – which make prices “bounce” – so a retest of the middle of the bollinger band was reasonable. we had a retest yesterday. today prices were rejected from this level [2078 – middle of bollinger today]. the middle of the band is “flat” this will act as resistance. So a trip back to the bottom of the band is the “potential” – and then another retest of the middle?? – i am unsure, maybe. it is the same process we went through in january. the bollinger band needs time to curl over and become “negative” sloped.
4/29 we broke through the middle of the bollinger band for the first time. so from 2/11 to 4/29 prices used the middle of the band as support to achieve higher levels.
on 4/29 it became resistance. we retested the middle on 5/2. on 5/3 it was rejected. we retested again yesterday, after hitting the bottom. today it was rejected again. this price behavior “suggests” the top is in, otherwise the spx would be using the middle of the band today as support, for a “retest” of the top.
so far i am seeing some kind of downside subwave 1-2, i-ii forming…. but i admit i need glasses…my eyesight is blurry these days… :-))
Peter –
So far the Fib ratios are playing out quite nicely on the B wave. the C (2082.5-2066) of this B is currently 1.618 of A (2084.6-2074.5). Also from the 2039 we have now retraced just over .382 of the entire move.
ted,
something to consider, there is gap to fill @ [2058] directly below. gap fill can become a magnet for prices.
Yes, I’ve had time now to do the measurements. You are correct! Should turn here. I still expect to see the top of D before tomorrow ends.
I also count 5 waves in the C waves down, so I expect a turn soon for that reason, as well.
The C wave in ES will be 1.618 X A at 2057.50, so we could still drop a little further.
The upside targets for the D wave are shifting slightly. Since we didn’t head up today to the target, the upper trendline converging means that the target is likely dropping by a few points. So we might be looking at 2090/91 or so ES and something similar in SPX.
hmmm, so the bottom of the bollinger = 2046 ish as of today. my vote would be for prices to move to the bottom of the band and test the bottom for a second time. potentially, i see us at this level for friday.
The correlation 2010 is still in place the tsunami drop is right around the corner
The top 2010 was April 26 and the crash bottom May 6 so we are in the timeframe right now risk on May 12-16 I guess…
john,
it seems we are aligned in our “expectations” as to price action/market direction versus the consensus.
let us see what happens.
so i think it is always best to have many eyes looking at the same charts. this is what makes a market….
many of you are missing the forest through the trees IMO. Peter is an excellent forecaster and chartist. i have stated this before. If you are in agreement that 2100ish is a near term top and we could roll over and retest 1800 or in Peter’s end of year opinion much, much lower. then don’t go for the Perfect trade. I put on spreads and have given myself several weeks for them to bear fruit. and don’t bitch when Mercury retrograde or the fickle markets wreck the wave counts
That makes one. haha …. 🙂 Appreciate it. You look at the market somewhat like I do.
Lot of people saying May 19-20 is top. there is something important with that date
New chart of ES posted.
PALS Thursday:
Declination: +
Distance: –
Phase: –
Seasonals: neutral
Planets: post Mercury inferior, positive. Venus approaching superior, negative.
Lunar/Planetary Alignments: Friday is Jupiter lunar alignment. Jupiter planet of plenty may deliver two strong up days.
Position: long Spy and Aapl calls.
I’m confused. Does this now mean the top of this will be lower than the 2116 you had before? Seems this last wave up is taking forever lol.
Yes, I’ve been very clear about that. It’s a triangle and the trendlines are drawn on all the charts, along with the path (on the chart of SPX).
An updated chart of ES is at the top of the post (8:30 AM EST).
The US dollar was active overnight and is now into it’s final wave down. If you follow it, you’ll see it turn with equities.
This is likely to continue to be a brutal market. Waves are down in 3 still, so the overall direction is still up. I don’t think we’re going to make the cycle turn date I have, so we’ll just have to see how this wave plays out.
We’re still in a B wave.
Peter, could you explain what you mean when you say we will not “make the turn date?”
Thanks for everything,
This is an Andy Pancholi turn date; however, it’s ending up in the middle of a triangle pattern. I thought we might reach the top of the D wave today. At the moment and if this bottom holds, in SPX, a C wave of the same length as the A wave puts us at 2100 for a D target high.
Measuring the B wave of the triangle, the D wave is .618 X the A wave at 2094. So we have a D wave target between 2094 and 2100, as far as I can make out. Everything I see still points to the triangle. It’s very large, so it will take some time to work its way through.
john – hey john are you there? whats your report update on your 2010 analog? what are your eyes seeing?
hmmm….so 2053 is the 50 day moving average. it is worth watching how prices behave at this level?? will the 50dma support prices? hmmm….
Rich, watch out for those algos. They know exactly where those moving averages and pivitol points are.I always allow a little wiggle room for the algos to play, before I either buy or sell if need to. All the best.
Hey Rich,
Im still bearish till the beginning of June
I see two scenario’s a sharp fall or a slump but in August mania will return back in the market and I see us making new highs again.
good luck.
There are fibonacci wave relationships in futures and SPX that suggest we’re at a short term bottom. Wave C currently is 1.618 X wave A.
SPX: 2056
ES: 2051
NQ: 4310
Still 3 overlapping waves down.
A C wave in ES from this bottom the same length as the A wave up from 2032 would give a high of 2097.
I took the past hour to concentrate on wave structure. Although close (waves start to look more motive as we get closer to a top or bottom, in my experience), I cannot find a motive structure. Within waves, yes, which is what you’d expect, but not as a whole.
I will be away from the market the rest of today.
I will add quickly that the same equal waves ratio in SPX gives us a wave D high of 2098.50. So these all these targets from equal wave lengths appear to be at the upper trendline limit, which may be giving us the signal of how this wave will unfold. A C wave up should go up in 5 waves more or less (what I mean by that is that they may not be perfect, as they would be with a motive wave).
Peter, I really appreciate the time you spend free of charge to help us learn more about wave structure and price targets.
🙂 Thks. I updated the ES chart at the top of the post so you can see the wave relationship I’ve been talking about. SPX is similar.
I did let go of my shorts from Tuesday. As stated last Friday, I was expecting a bounce Monday. Instead I waited for Tuesday bounce to short the spys. I am now long for another bounce before going short again.Still fully expect a down draft in the markets over the next two weeks. All the best every one.
Hey Dave , do you also have a target SP for your down draft over the next two weeks?
Thanks.
John.
John, I am not in the severe BEAR CAMP. We may see 1980 as a bottom. I will not be waiting for that particular area to get out. I will be selling as we make our way down with approx. 3 batches. BEARS AND BULLS MAKE MONEY PIGS LOSE OUT.Many years a go, I use to try and pick the exact bottoms and tops only to see my winning trades vanish. Now, I am very happy to just make 45 to 70% of the move. All the best John.
John, when the selling starts I will be looking closely at volume and pivitol points. As the selling volume starts to dry up, I will be dollar cost averaging back to the long side. John, here are some cheat sheets for the pivtol numbers. Very useful, Again allow the algos to slightly penetrate the pivit points and the moving averages before selling and buying.
http://www.barchart.com/cheatsheet.php?sym=$SPX
Babak @TN · 57m57 minutes ago
AAII wkly #sentiment survey: 20.4% bulls, 31.3% bears, 48.3% neutral
Thanks Dave.
I updated the post with an NQ (futures chart) showing the motive structure. ES and SPX look the same.
Just realized I’ve been labelling everything “Wednesday” – sorry.
When it is still Wednesday in Alberta it may be already Thursday in Moscow.
So, don’t worry we know the day ?
haha 🙂
This website is for educational purposes relating to Elliott Wave, natural cycles, and the Quantum Revolution (Great Awakening). I welcome questions or comments about any of these subjects. Due to a heavy schedule, I may not have the time to answer questions that relate to my area of expertise.
I reserve the right to remove any comment that is deemed negative, is unhelpful, or off-topic. Such comments may be removed.
Want to comment? You need to be logged in to comment. You can register here.