
 The Fed is Delusional
This week at Jackson Hole, Jerome Powell attempted to justify his continuing pipe dream of a 2% inflation rate. He also tried to paint this scenario as a “good thing.”
It would be a good thing for central bankers (!), as it allows them to keep stealing our money. However, it’s a long way from reality. A deflationary environment, as I’ve maintained for a very long time, lies dead ahead. The US Dollar is about the turn to the upside for good (or at least, for the foreseeable future).
DXY, the US Dollar Index, which has been in a bottoming process for the past few weeks, now has the final wave of an ending diagonal to complete. That means one more low (watch for pundits to once more herald the end of the dollar).
Ending diagonals are ending patterns and warn of an impending trend change. We’ve known it’s been coming for a long time, because the wave down February of this year is a corrective, second wave. It predicts a turn a back up into a protracted bull market with five more waves up to new highs. That’s most definitely deflationary.
That’s not good for either silver or gold.
There are ending diagonals in other USD currency pairs, in AAPL, for example, and in other assets scattered throughout the market.
This trend change is going to see virtually everything turn together and could be quite a “show.” However, it will pale compared to the eventual market collapse, which I don’t see happening until next year.
This has prompted me to update my long-term charts for NDX and SP500, which you’ll find below.
Also note that the webinar playback from this past week (Elliott Wave Basics) is below as well. It’s a link to the Youtube version, which allows for stopping and starting.
Lots in this report this weekend. We’re finally ready for the balance of this 500 year rally to top out.
————————————————
Big Picture: NDX and SP500
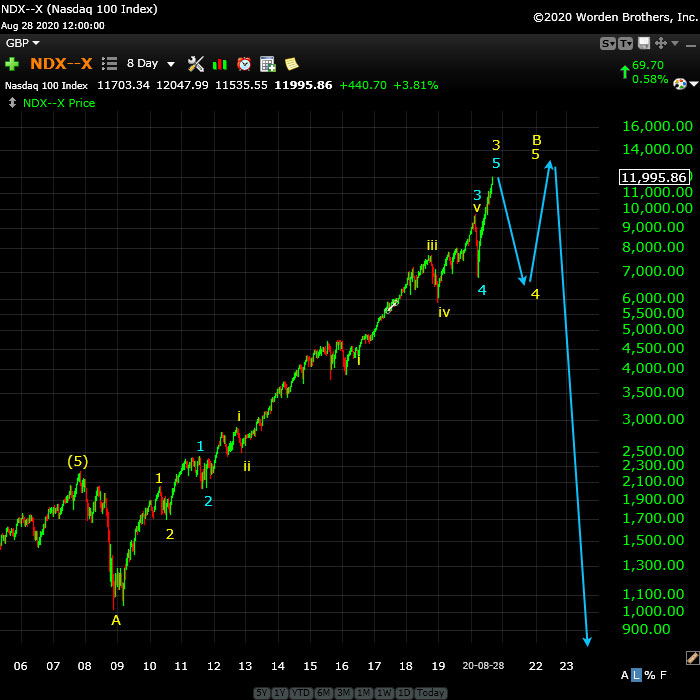
Above is the 8 day chart of NDX. The yellow circle 5 on the left bottom denotes the cycle high, which was in 2007. Then central bankers weighed in a injected a huge amount of debt into the market through the banking system. This created an “unnatural” B wave, which we’re never supposed to have, according to Bob Prechter’s book, the Elliott Wave Principle (this was a change he made to Mr. Elliott’s original work).
However, here we are. It’s a corrective wave, and since we’ve never seen one of these B waves at the top of a market before, it makes it more difficult to analyze, more so for the SP500, which has a much more complicated pattern (below).
In any event, for NDX, we’re still looking for a fourth and fifth wave and they’re denoted by the blue arrows. When they’re done, the market is going to give us the show of a lifetime (or several of them — lifetimes, that is). Then it will be time to be prepared for the aftermath, a very long depression, and civil war around the world.
I put us at the top of the third wave, and that’s why it has been somewhat relentless.
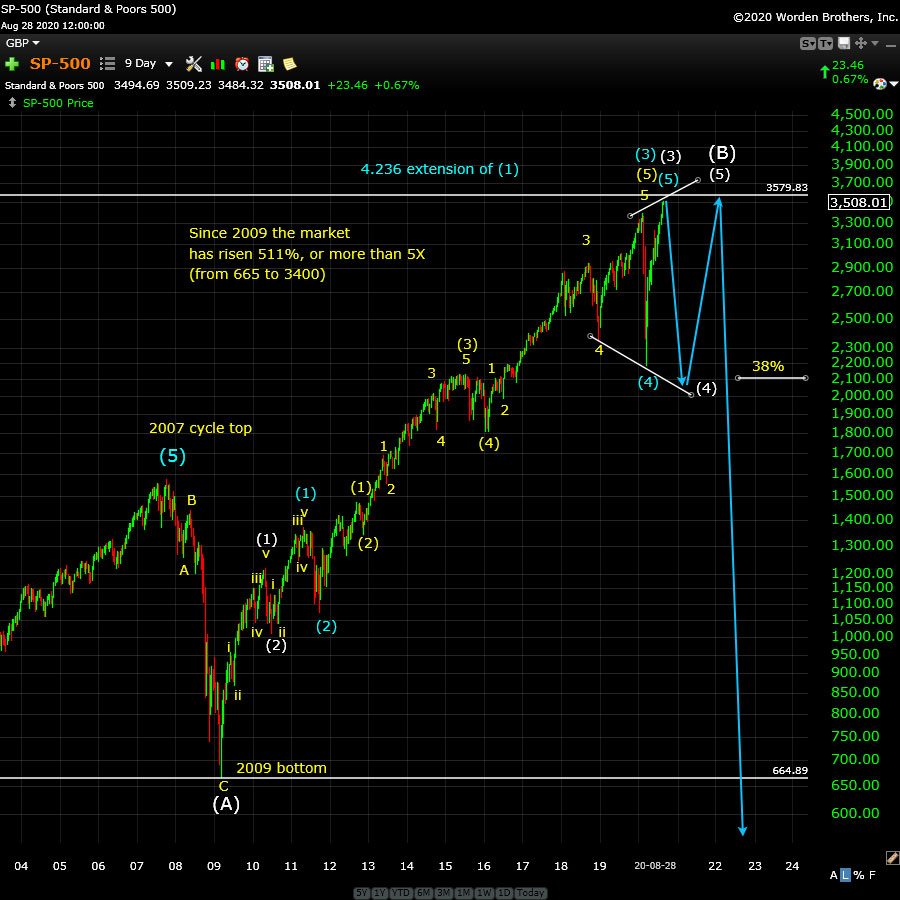
Above is the 9 day chart of the SP500. This is a much more complicated chart than NDX, but puts in the same place, expecting a final large fourth and fifth wave.
I did not expect the current wave to end up being an intermediate third wave (due to not appreciating the importance of the while circle 1 wave set. Again, this is a B wave up from 2009, which makes this market an anomaly.
To back up the current count, you can look at a stock like AAPL and see that it’s clearly at the top of wave three (in an ending diagonal), which means it also has a large fourth and fifth wave to trace out to a new high.
Third waves are blow-off waves, fifth waves are not, and that’s why this current rally has been so relentless.
Know the Past. See the Future
_______________________
Free Webinar Playback: Elliott Wave Basics
 If you’re new to the Elliott Wave Principle, or even fairly comfortable with it, this webinar will give you a solid introduction and comprehensive understanding of the difference between trending and counter-trend waves, the various patterns for both types of wave patterns, and a good overview of how fibonacci ratios determine trade targets.
This is link to the YouTube playback video, allowing you to review, stop and start, etc.
____________________________
Want some truth?
My new site now has two extensive newsletters in place. Videos now explain the banking system and deflation, and I’ve provided lists of what to do and what the start collecting in preparation for the eventual downturn, which will last for decades. The focus of my new site is now to retain your wealth, plan for deflationary times, and stay healthy in the process. I’m also debunk a lot of the propaganda out there. It’s important to know what’s REALLY happening out there! Getting to the real truth, based on history, is what I do, inside the market and out.

To sign up, visit my new site here.
All the Same Market.
I’ve been mentioning for months now that the entire market is moving as one entity, the “all the same market” scenario, a phrase that Robert Prechter coined many years ago, when he projected the upcoming crash.
We’re in the midst of deleveraging the enormous debt around the world. Central banks are losing the control they had and we’re slowly sinking into deflation world-wide, with Europe in the lead.
The US dollar is fully in charge of both the equities and currencies markets. They’re all moving in tandem, as I’ve been saying since September of 2017. Over the past three years, their movements have been moving closer and closer together and one, and now they’re in lock-step, with the major turns happening at about the same time.
it’s challenging because often times currency pairs are waiting for equities to turn, and other times, it’s the opposite. The other frustrating thing is that in between the major turns, there are no major trades; they’re all, for the most part day-trades. That’s certainly the case in corrections, where you very often have several possible targets for the end of the correction.
We’re now close to a turn in the US indices, currency pairs, oil, and even gold. Elliott wave does not have a reliable timing aspect, but it looks like we should see a top very soon.
_________________________________
Couldn’t be happier … KK 2
Couldn’t be happier …The analysis and insight you provide is simply amazing! I’ve been trading the futures and equity markets for well over thirty years and usually average around 5% monthly. Since joining your Traders Gold Service two months ago, that number has better than doubled. I couldn’t be happier.—KK |
A true expert in Elliott Wave FL 2
A true expert in Elliott Wave …You are a true expert in EW analysis. What you provide is not available anywhere and is priceless. Subscription on your services is the best thing I have ever done. Many thanks for your effort to make me a better investor. I now have more trust in my investment decisions. I hope you will continue the excellent work! —FL |
Get an upper hand … JC 2
Get an upper hand in trading …Seeing all the different currency pairs and the wave structures and hearing you explain why this has to do that on a nightly bases gives one a upper hand when trading. Elliott Wave applies to all stock and indices and can be applied to any candlestick chart. If someone ask what you want for Christmas – Tell them a membership to Peter’s “Traders Gold!”—JC |
Have not had a losing week RW 2
Have not had a losing week …I have been with Peter almost a year. The only thing that matters is have I made money with his service. I think I have finally turned the corner using Peter’s EW. I have not had a losing week in the last 5 months. Thanks Peter, for your amazing amount of hard work. —RW |
Rise above the rest … SM 2
Rise above the rest …I have only ever met a few people who, in their chosen fields (astrology, medicine, music, martial arts, technical analysis), rise above all the rest and you are one of them…you have ‘the gift’…and that’s why I’m a Trader’s Gold member. —SM |
The best of them JL 2
The best of them …Last couple of years, I subscribed to several ‘market traders’. You are by far the best of them and the personal contact is awesome. Daily and daily updates are very well written! Besides your expertise in EW, I also like your cycles analysis. Best investment I ever made! —JL |
the real deal SM 2
The real deal …‘Educational, insightful and thorough market analysis for all levels of traders. It’s Elliott Wave at its best….Peter Temple is the real deal’ —SM |
Tops in your field DZ 2
Tops in your field …You are tops in your field. Tried to follow Elliot Wave international for years. They were always behind the market. After discovering you, I perceive that you are an expert in reading the waves, which puts you way ahead of the rest of your peers. And you can read the Waves like you are reading tomorrow’s financial section. I pray you stay healthy. —DZ |
US Market Snapshot (based on end-of-week wave structure)
This chart is posted to provide a prediction of future market direction. DO NOT trade based upon the information presented here (certainly NOT from a daily chart).
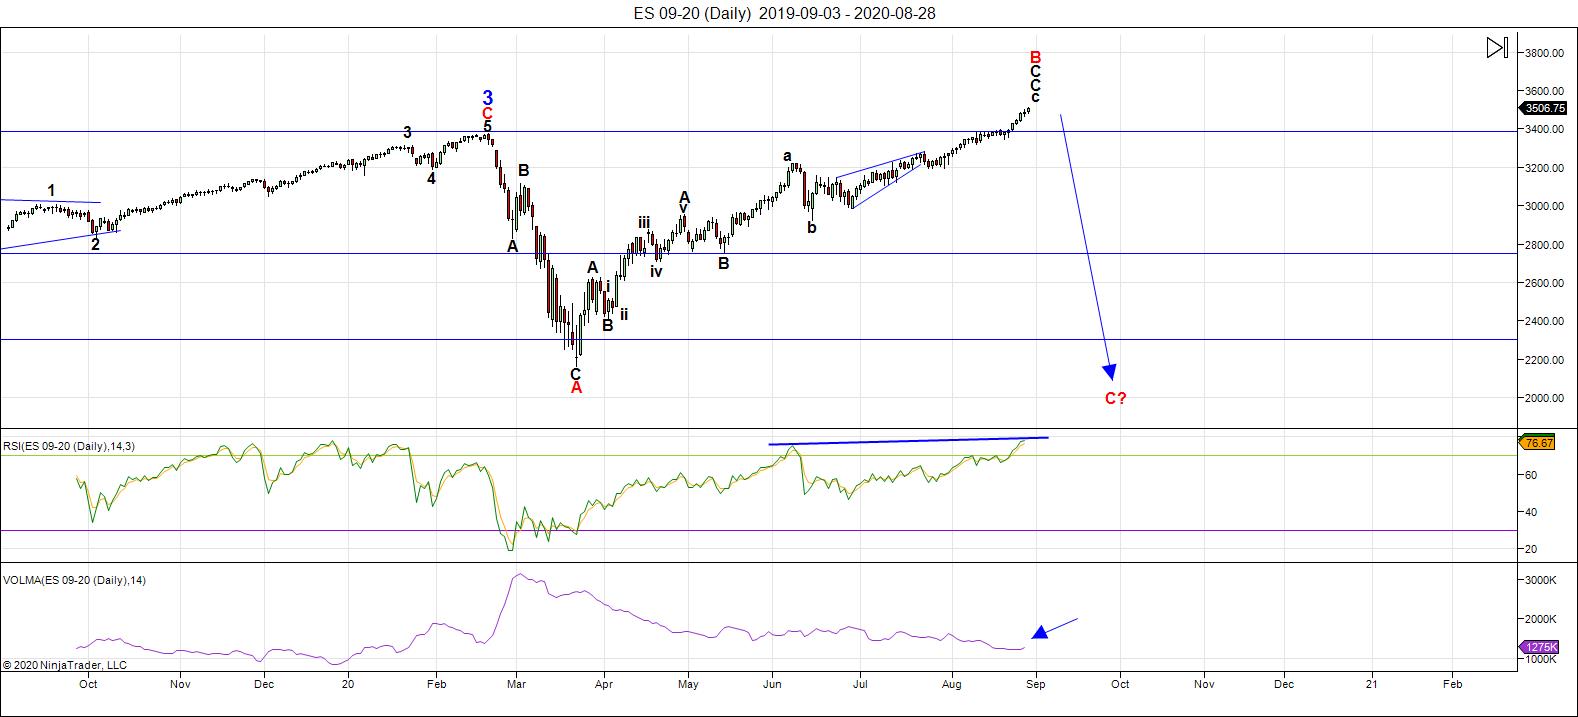
Above is the daily chart of ES (click to enlarge, as with any of my charts).
Topping is always a process, but this particular top has probably broken all existing records for the length of time it's taken to effect a trend change.
There are ending diagonals all over the place now as this extraordinary B wave up from 2009 plays out.
As I've said many times before, the 516 year cycle top was in 2007. The market started down and bottomed in a corrective in early 2009. "Quantitative Easing" had already begun, with central bankers injecting huge amounts of debt into the banking system, which helped inflate the US Dollar and send the markets to unbelievable new highs — the largest bubble in history.
Ralph Nelson Elliott believed we could have "unorthodox" tops in a market, but Robert Prechter thought otherwise and said so in his book, The Elliott Wave Principle. Wrong.
There are a lot more errors in the book; however, I don't consider that a negative, because, if you believe Elliott Wave is a science, you know that science gets refined over time, as we learn more about it.
Now, we've confirmed that B waves are indeed possible, but nobody's ever seen one before, so it's made this new phenomenon at times difficult to analyze. For example, the current wave up is a "five" and looks motive, but it's not; it's corrective.
We also don't new highs in other US indices, and most certainly not in the NYSE exchange. You'll also find that stocks are in a third wave, mostly notably Apple, which is at the top of an ending diagonal. Ending diagonals are ending waves and predict a trend change, when complete. It's more or less complete.
Apple's not the only asset sporting an ending diagonal. You'll find them in currency pairs like CAD and AUD, and particularly the US Dollar Index (DXY). This predicts a dramatic trend change to come.
A trend change across multiple asset classes (and international exchanges) is imminent. There's a full moon on Wednesday, which may be important for the timing of the trend change.
___________________________
Summary: It's an exhausted market about to top.
We appear to be in a kind of broadening top formation (not an EW pattern), with a series of fourth and fifth waves playing out. We have an fourth down in place from 3400, a fifth wave up to slight new high above that same level, but now we have a larger fourth wave down to below 2100. There are several possible measured objectives below that point.
These highs are not supported the the NYSE exchange, which has a more muted corrective wave up, but not to new highs, similar to the Russell 2000. There are different counts for different indices, which makes the US market quite a mess, and can be difficult to understand from a technical perspective. It's a sick market, kept aloft by animal spirits and "funny money."
The coming descent should be a fourth similar to the previous one, and will likely be a combination pattern and, as such, may contain zigzags, flats, and possibly a triangle or ending diagonal at the bottom. However, I lean towards another series of zigzags, which are corrective waves.
Once we've completed the fourth wave down, we'll have a long climb to a final slight new high in a fifth wave of this 500 year cycle top.
______________________________
Trader's Gold Subscribers get a comprehensive view of the market, including hourly (and even smaller timeframes, when appropriate) on a daily basis. They also receive updates through the comments area. I provide only the daily timeframe for the free blog, as a "snapshot" of where the market currently trades and the next move on a weekly basis.
I do a nightly video on the US indices, USD Index (and related currency pairs), gold, silver, and oil) right down to hourly charts (and even 5 minutes, when required).
______________________________________


