
 An Inflection Point
“To be or not to be?” is William Shakespeare’s most often quoted line, and is uttered by Hamlet in the third scene of his play of the same name. He’s at a turning point, contemplating death over life.
It’s often thought that he holds a skull in that scene, as he unveils his inner thoughts on suicide, but that’s in fact, not he case. He holds that human skull two scenes later. Ah … we have selective memories.
The market is also at a crossroads this weekend, contemplating what direction to move. Are we watching the death of this five month extraordinary, Federal Reserve-fueled bull run?
I see a mixed market, with some asset classes (and several assets within those classes) having already changed trend (although in the very early stages, and not yet confirmed technically).
“To turn or not to turn?”; that is the question.
That being said, the chances of a top being in place in the US indices is quite good this weekend.
Ending diagonals are ending patterns and stipulate that once the fifth wave of that diagonal is in place, it marks the end of the current trend. We saw the top of the ending diagonal on Wednesday of this week in both SPX cash and futures, and then we had a test of that level on Friday. I have a full Elliott Wave count in these indices.
The NYSE “mother exchange” looks to me as though it’s already topped, although, with all the gaps in that exchange speak to the necessity to wait for a FULL first wave and second wave combination before getting too excited. In any case, I can provide a case for a top already being in place.
DAX also may have topped, but both these exchanges require confirmation of that top; it’s a little bit early in the process to be sure. It looks like we’re at the top of the second wave.
DXY (the US Dollar Index) appears to have changed trend and the related USD currency pairs are showing signs of a top in place, but again, nothing technically confirmed. I still don’t have a first wave in the pairs; however, I do have one in DXY.
Gold and silver are still questionable.
Oil appears to me to still require a stop, because the waves down appear to be corrective. We could see that top over the weekend or into early next week.
NQ is at a top, as well, although the pattern is very different from ES.
This weekend, I’m looking at tops potentially forming in AAPL, AMZN, and FB. AAPL sits at the top of the final 5th wave of an ending diagonal this weekend, right at the measured maximum level (500) that this pattern allows. AMZN is at a potential double top.
Overall, the market is mixed this weekend, with more and more punditry hitting the airwaves: The dollar is dying, gold is going to 10,000, Apple hits the $2 trillion market cap level. All this news on market extremes signals a change is due. I see the signs everywhere.
In summary, I see potential tops in place in some asset classes, but not in others. We need to wait for confirmation, but it seems it’s close at hand. The next few days looks to be very important.
Know the Past. See the Future
_______________________
Free Webinar: Elliott Wave Basics
 If you’re new to the Elliott Wave Principle, or even fairly comfortable with it, this webinar will give you a solid introduction and comprehensive understanding of the difference between trending and counter-trend waves, the various patterns for both types of wave patterns, and a good overview of how fibonacci ratios determine trade targets.
This is link to the YouTube playback video, allowing you to review, stop and start, etc.
____________________________
Want some truth?
My new site now has two extensive newsletters in place. Videos now explain the banking system and deflation, and I’ve provided lists of what to do and what the start collecting in preparation for the eventual downturn, which will last for decades. The focus of my new site is now to retain your wealth, plan for deflationary times, and stay healthy in the process. I’m also debunk a lot of the propaganda out there. It’s important to know what’s REALLY happening out there! Getting to the real truth, based on history, is what I do, inside the market and out.
To sign up, visit my new site here.
All the Same Market.
I’ve been mentioning for months now that the entire market is moving as one entity, the “all the same market” scenario, a phrase that Robert Prechter coined many years ago, when he projected the upcoming crash.
We’re in the midst of deleveraging the enormous debt around the world. Central banks are losing the control they had and we’re slowly sinking into deflation world-wide, with Europe in the lead.
The US dollar is fully in charge of both the equities and currencies markets. They’re all moving in tandem, as I’ve been saying since September of 2017. Over the past three years, their movements have been moving closer and closer together and one, and now they’re in lock-step, with the major turns happening at about the same time.
it’s challenging because often times currency pairs are waiting for equities to turn, and other times, it’s the opposite. The other frustrating thing is that in between the major turns, there are no major trades; they’re all, for the most part day-trades. That’s certainly the case in corrections, where you very often have several possible targets for the end of the correction.
We’re now close to a turn in the US indices, currency pairs, oil, and even gold. Elliott wave does not have a reliable timing aspect, but it looks like we should see a top very soon.
_________________________________
Get an upper hand … JC 2
Get an upper hand in trading …Seeing all the different currency pairs and the wave structures and hearing you explain why this has to do that on a nightly bases gives one a upper hand when trading. Elliott Wave applies to all stock and indices and can be applied to any candlestick chart. If someone ask what you want for Christmas – Tell them a membership to Peter’s “Traders Gold!”—JC |
Have not had a losing week RW 2
Have not had a losing week …I have been with Peter almost a year. The only thing that matters is have I made money with his service. I think I have finally turned the corner using Peter’s EW. I have not had a losing week in the last 5 months. Thanks Peter, for your amazing amount of hard work. —RW |
The best of them JL 2
The best of them …Last couple of years, I subscribed to several ‘market traders’. You are by far the best of them and the personal contact is awesome. Daily and daily updates are very well written! Besides your expertise in EW, I also like your cycles analysis. Best investment I ever made! —JL |
Rise above the rest … SM 2
Rise above the rest …I have only ever met a few people who, in their chosen fields (astrology, medicine, music, martial arts, technical analysis), rise above all the rest and you are one of them…you have ‘the gift’…and that’s why I’m a Trader’s Gold member. —SM |
the real deal SM 2
The real deal …‘Educational, insightful and thorough market analysis for all levels of traders. It’s Elliott Wave at its best….Peter Temple is the real deal’ —SM |
Tops in your field DZ 2
Tops in your field …You are tops in your field. Tried to follow Elliot Wave international for years. They were always behind the market. After discovering you, I perceive that you are an expert in reading the waves, which puts you way ahead of the rest of your peers. And you can read the Waves like you are reading tomorrow’s financial section. I pray you stay healthy. —DZ |
A true expert in Elliott Wave FL 2
A true expert in Elliott Wave …You are a true expert in EW analysis. What you provide is not available anywhere and is priceless. Subscription on your services is the best thing I have ever done. Many thanks for your effort to make me a better investor. I now have more trust in my investment decisions. I hope you will continue the excellent work! —FL |
Couldn’t be happier … KK 2
Couldn’t be happier …The analysis and insight you provide is simply amazing! I’ve been trading the futures and equity markets for well over thirty years and usually average around 5% monthly. Since joining your Traders Gold Service two months ago, that number has better than doubled. I couldn’t be happier.—KK |
US Market Snapshot (based on end-of-week wave structure)
This chart is posted to provide a prediction of future market direction. DO NOT trade based upon the information presented here (certainly NOT from a daily chart).
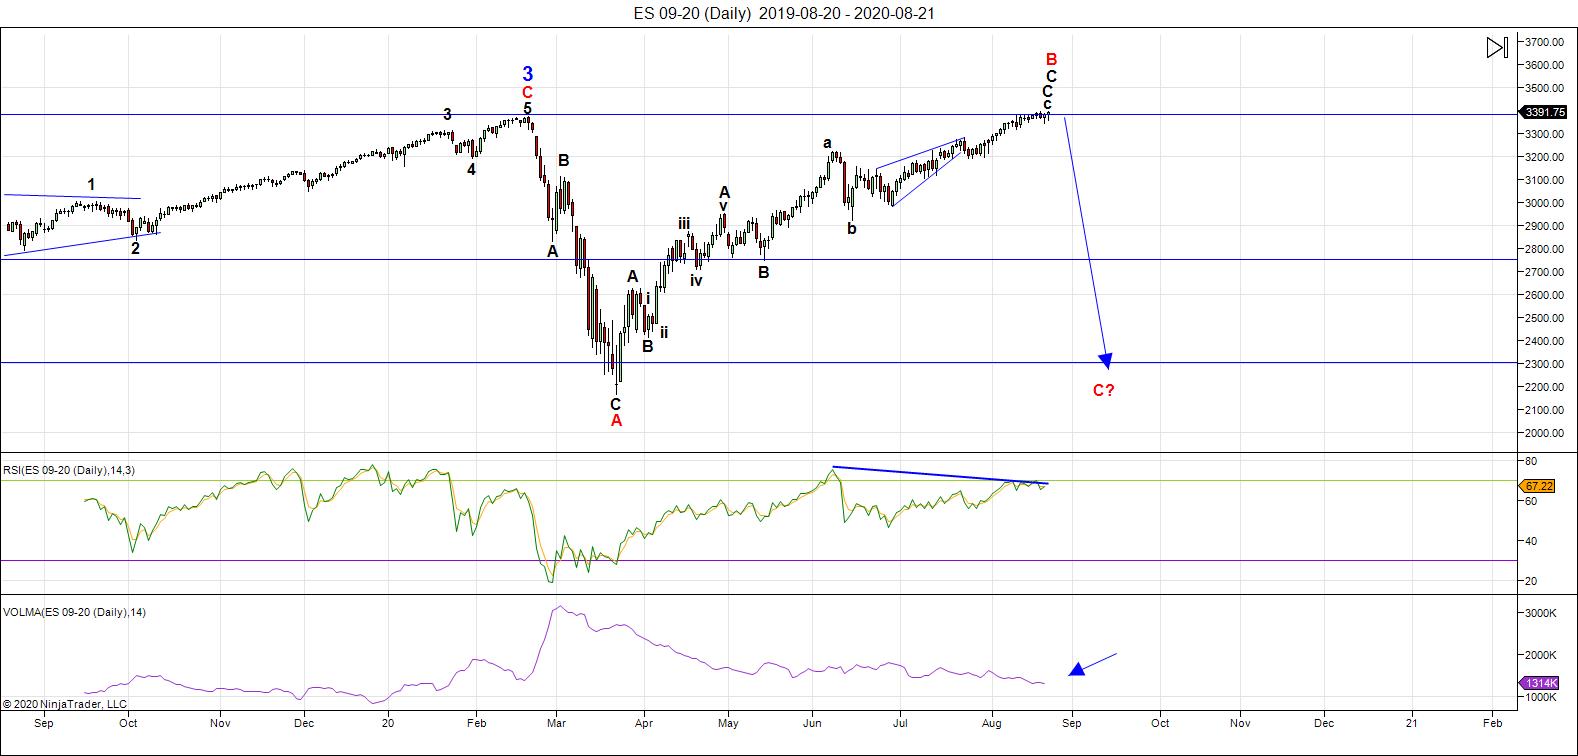
Above is the daily chart of ES (click to enlarge, as with any of my charts).
Topping is always a process, but this particular top has probably broken all existing records for the length of time it's taken to effect a trend change.
Friday may well have marked an important top for the SP500 after an ending diagonal. The ending diagonal is better-formed in ES than it is in the SP500. The top of the ending diagonal was actually on Wednesday of this past week, and a turn down was triggered by the Fed Reserve minutes.
Ending diagonals can sometimes drop after the fifth wave and then return to test that level. That appears to be what happened near the end of the day on Friday.
Looking at AAPL and AMZN, you can see they're also at important tops. NQ is in a final fifth wave subwave and has only a test of the current high left.
A good look at the NYSE exchange looks like it's already topped and may be in a third wave of the first heading down. This needs confirmation.
Then, there's the important "contrarian info" on short interest: At the start of August, the median S&P 500 stock had outstanding short interest equating to just 1.8% of market cap, the lowest level in Goldman's 16-year data history.
DXY (the US Dollar Index) appears to have turned, as have EURUSD and AUDUSD. USDJPY has also changed trend, it seems, and although USDCAD may have changed trend, it's too early for confirmation.
DAX seems to have turned weeks ago, but also needs confirmation with a new low.
Gold and silver are debatable at the moment, because the waves down aren't giving any clues, but I'm expecting a top in the very near future.
The big picture pattern for the US indices in general seems to be a broadening top, so the new high by the SP500 (much higher relative to it's mother, the NYSE) seems to have little meaning from a technical perspective.
Everything points to a turning market ...
___________________________
Summary: It's an exhausted market about to top.
We appear to be in a "combination" fourth wave down from the 3400 area. We have an A wave down in place from 3400, a B wave up almost to that same level, and now we're about to complete the C leg down to a new low below 2100. There are several possible measured objectives below that point.
The balance of the drop from February should be a combination pattern and, as such, may contain zigzags, flats, and possibly a triangle or ending diagonal at the bottom. However, I lean towards another series of zigzags, which are corrective waves.
Once we've completed the fourth wave down, we'll have a long climb to a final slight new high in a fifth wave of this 500 year cycle top.
______________________________
Trader's Gold Subscribers get a comprehensive view of the market, including hourly (and even smaller timeframes, when appropriate) on a daily basis. They also receive updates through the comments area. I provide only the daily timeframe for the free blog, as a "snapshot" of where the market currently trades and the next move on a weekly basis.
I do a nightly video on the US indices, USD Index (and related currency pairs), gold, silver, and oil) right down to hourly charts (and even 5 minutes, when required).
______________________________________


