
 Up and Down ….
This market is toying with us. Getting a top in place is like herding cats, or like Whack a Mole!
“Whack a Mole” is a concession-stand game at fairs in which a player tries to “whack” plastic mole-like replicas with a rubber hammer as they randomly pop up from holes in the game surface: Fun at a fair, frustrating in the stock market!
Everything is so close to a top, but when several cats (asset, or often whole asset classes) make it to a new high and one’s out of line, everything tends to drop back and then they try again.
It’s an extremely frustrating (and overly-long) topping process.
In the “market world,” we’ve had a couple of weeks of up and down waves across multiple asset classes. In the US indices, these are the final waves before a trend change.
On Thursday of this week, ES, in a small ending diagonal, missed a test of the previous high by one point. That was the big tease! But, at that point, not all asset classes were completely lined up for a turn. So … we retreated … again.
As of this weekend, the US Dollar Index (DXY) appears to have bottomed, as we now have 5 waves up to the previous fourth wave and we’re currently near the bottom of a second wave. The turn in the US dollar will lead us into a deflationary environment, which I’ve forecast for several years now.
My recent initiative, Thrive Academy has video and written explanations of deflation and how to navigate the changing value of fiat currency. It’s important you understand the financial environment we’re moving into; it will change the value of currency, and assets. More on that, below.
In terms of other USD-related currency pairs, EURUSD has a set of 5 waves down and is also in a corrective second wave. DAX (the German exchange), which I follow, also appears to have topped.
Gradually over the next few days, I’d expect the US indices to turn into a new downward trend. This weekend, we’re closer than ever to having everything lined up, and now that the US Dollar has presumably turned (it’s a little early from an Elliott Wave technical perspective to call a trend change), I would expect to call a trend change before we’re halfway though this coming week.
The mood within society is already quite negative. It will become even more negative as this expected 1300 point drop in the SP500 nears the bottom.
The internet is a-buzz this weekend.
There’s a video being promoted on the internet of a drive through New York City, where you can see store after store boarded up on 5th Ave., in Manhattan.
There’s another video, entitled, Shadowgate that exposes the Deep State artificial intelligence gathering (carried on both RT.com and Zerohedge.com), while there are rumours that President Trump may pardon Edward Snowdon.
We’re expecting to hear from the Durham team as indictments come down in the Russiagate affair, and there’s been one indictment handed down already.
And, the truth is starting to come out about this Dr. Fauci character, who was head of the NIH when it declared in 2005 that hydroxychloroquine “is a potent inhibitor of SARS coronavirus infection and spread.” Here is the latest open letter from a group of renowned doctors in the United States.
Things are heating up! With the US election not that far away, we’re likely to see as much volatility in the real world as we’re going to see in the stock market.
_____________________________
Free Webinar: Elliott Wave Basics
 If you’re new to the Elliott Wave Principle, or even fairly comfortable with it, this webinar will give you a solid introduction and comprehensive understanding of the difference between trending and counter-trend waves, the various patterns for both types of wave patterns, and a good overview of how fibonacci ratios determine trade targets.
Scheduled Date: August 26, 2020, 6pm EST
Even if you can’t make the actual event, you’ll be provided with an video playback link (with no expiration date) so that you can review it at your leisure. A direct youtube link for the playback will also be offered, so that you can play back, stop and start, etc.
Go here for more info and to sign up: Webinar Sign-up Page
____________________________
More Whack a Mole? Uh-oh …
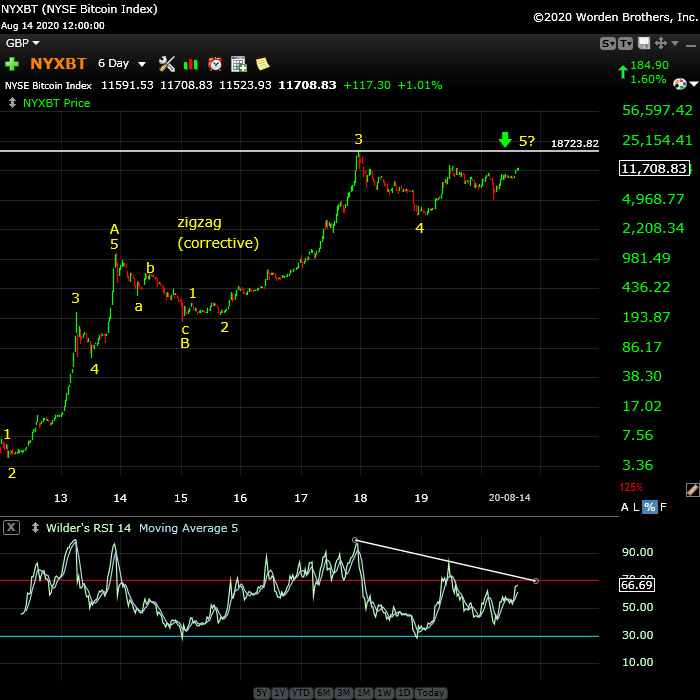
Above is the 6 day chart of the NYSE bitcoin index. I consider bitcoin a “bubble on top of a bubble,” the stock market overall being the “foundational” bubble bitcoin sits atop. That’s because the technicals are warning that we’re in a final wave (see the RSI indicator at the bottom, which is showing major divergence, which you always get at a top — it starts to show up in the final wave).
The pattern up from the bottom is a zigzag, which is a corrective wave and will eventually fully retrace. It looks like we could get a top with the top in the larger market. In any event, it appears close at hand, relative to the overall pattern.
Bitcoin is like a fiat currency. It’s digital, with nothing of intrinsic value to support it. It’s certainly not money, but if you own some, you no doubt think it is, and its success depends greatly on others thinking so, as well.
There’ve been lots of bubbles in the past of a similar nature. Bubbles always burst.
Know the Past. See the Future
_______________________
Want some truth?
My new site now has two extensive newsletters in place. Videos now explain the banking system and deflation, and I’ve provided lists of what to do and what the start collecting in preparation for the eventual downturn, which will last for decades. The focus of my new site is now to retain your wealth, plan for deflationary times, and stay healthy in the process. I’m also debunk a lot of the propaganda out there. It’s important to know what’s REALLY happening out there! Getting to the real truth, based on history, is what I do, inside the market and out.

To sign up, visit my new site here.
All the Same Market.
I’ve been mentioning for months now that the entire market is moving as one entity, the “all the same market” scenario, a phrase that Robert Prechter coined many years ago, when he projected the upcoming crash.
We’re in the midst of deleveraging the enormous debt around the world. Central banks are losing the control they had and we’re slowly sinking into deflation world-wide, with Europe in the lead.
The US dollar is fully in charge of both the equities and currencies markets. They’re all moving in tandem, as I’ve been saying since September of 2017. Over the past three years, their movements have been moving closer and closer together and one, and now they’re in lock-step, with the major turns happening at about the same time.
it’s challenging because often times currency pairs are waiting for equities to turn, and other times, it’s the opposite. The other frustrating thing is that in between the major turns, there are no major trades; they’re all, for the most part day-trades. That’s certainly the case in corrections, where you very often have several possible targets for the end of the correction.
We’re now close to a turn in the US indices, currency pairs, oil, and even gold. Elliott wave does not have a reliable timing aspect, but it looks like we should see a top very soon.
_________________________________
Elliott Wave Basics
Here is a page dedicated to a relatively basic description of the Elliott Wave Principle. You’ll also find a link to the book by Bob Prechter and A. J. Frost.
______________________________
Couldn’t be happier … KK 2
Couldn’t be happier …The analysis and insight you provide is simply amazing! I’ve been trading the futures and equity markets for well over thirty years and usually average around 5% monthly. Since joining your Traders Gold Service two months ago, that number has better than doubled. I couldn’t be happier.—KK |
Have not had a losing week RW 2
Have not had a losing week …I have been with Peter almost a year. The only thing that matters is have I made money with his service. I think I have finally turned the corner using Peter’s EW. I have not had a losing week in the last 5 months. Thanks Peter, for your amazing amount of hard work. —RW |
Get an upper hand … JC 2
Get an upper hand in trading …Seeing all the different currency pairs and the wave structures and hearing you explain why this has to do that on a nightly bases gives one a upper hand when trading. Elliott Wave applies to all stock and indices and can be applied to any candlestick chart. If someone ask what you want for Christmas – Tell them a membership to Peter’s “Traders Gold!”—JC |
Rise above the rest … SM 2
Rise above the rest …I have only ever met a few people who, in their chosen fields (astrology, medicine, music, martial arts, technical analysis), rise above all the rest and you are one of them…you have ‘the gift’…and that’s why I’m a Trader’s Gold member. —SM |
The best of them JL 2
The best of them …Last couple of years, I subscribed to several ‘market traders’. You are by far the best of them and the personal contact is awesome. Daily and daily updates are very well written! Besides your expertise in EW, I also like your cycles analysis. Best investment I ever made! —JL |
A true expert in Elliott Wave FL 2
A true expert in Elliott Wave …You are a true expert in EW analysis. What you provide is not available anywhere and is priceless. Subscription on your services is the best thing I have ever done. Many thanks for your effort to make me a better investor. I now have more trust in my investment decisions. I hope you will continue the excellent work! —FL |
Tops in your field DZ 2
Tops in your field …You are tops in your field. Tried to follow Elliot Wave international for years. They were always behind the market. After discovering you, I perceive that you are an expert in reading the waves, which puts you way ahead of the rest of your peers. And you can read the Waves like you are reading tomorrow’s financial section. I pray you stay healthy. —DZ |
the real deal SM 2
The real deal …‘Educational, insightful and thorough market analysis for all levels of traders. It’s Elliott Wave at its best….Peter Temple is the real deal’ —SM |
US Market Snapshot (based on end-of-week wave structure)
This chart is posted to provide a prediction of future market direction. DO NOT trade based upon the information presented here (certainly NOT from a daily chart).
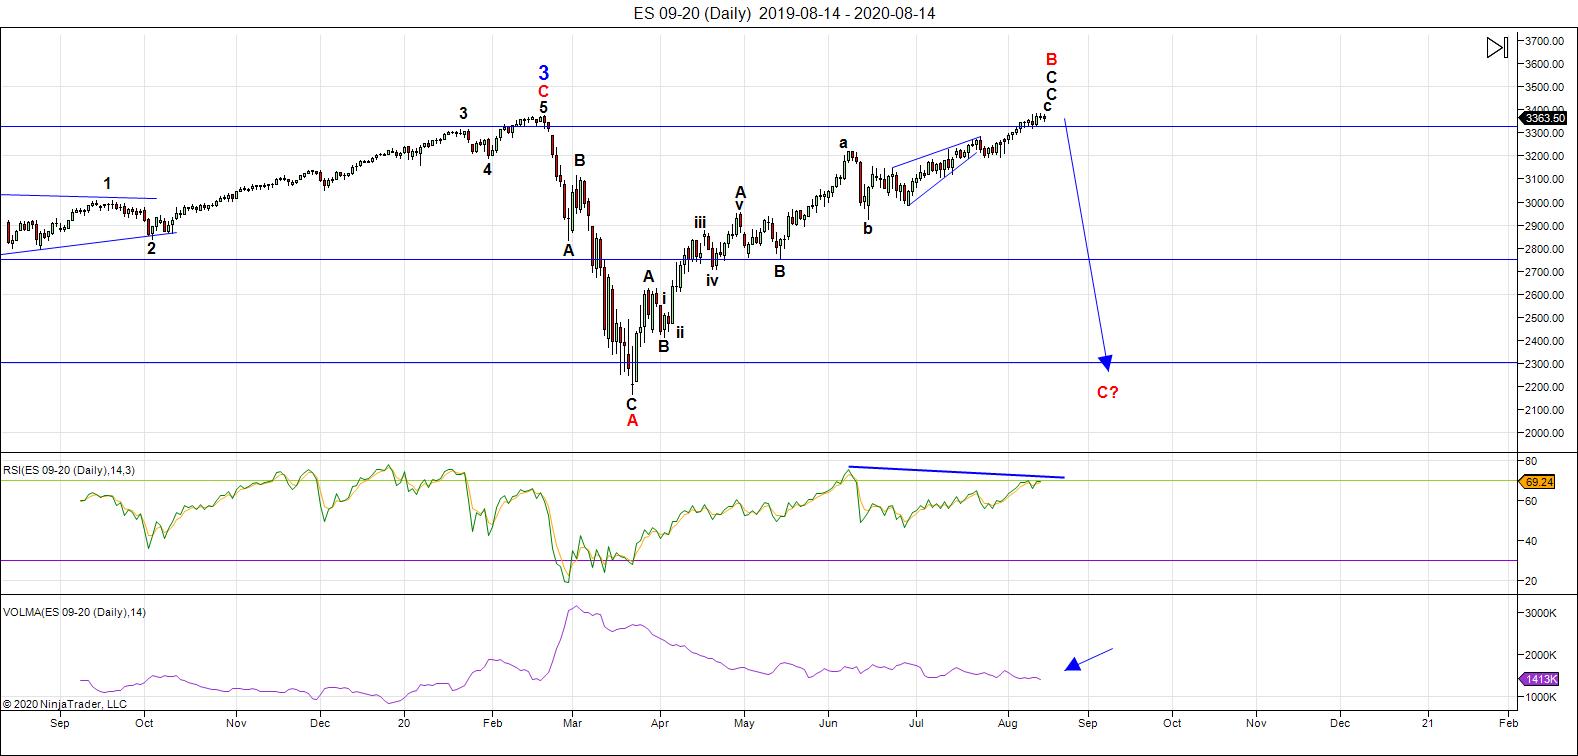
Above is the daily chart of ES (click to enlarge, as with any of my charts).
Topping is always a process, but this particular top has probably broken all existing records for the length of time it's taken to effect a trend change.
On Thursday of this week, SPX almost tested the previous high, but in the case of ES, it missed by a single point. Ah, but it just so happens that oil was not in a topping position. So, SPX dropped again and we're trying to get all my (almost-herded) "market cats" at their respective extreme levels to allow for a trend change together.
As I mentioned last week, all these players have to reach new highs (or lows, as the case may be) and then turn. This relates to asset classes, not individual assets, of course.
We're all so close now, except that oil still needs a new high still, it appears.
DXY (the US Dollar Index) appears to have turned, as have EURUSD and AUDUSD. USDJPY has also changed trend, it seems, and although USDCAD may have changed trend, it's too early for confirmation. Gradually, all my market cats are falling into line and changing trend. The US indices may well be next, as they're very close to tops and have run out of fourth waves (the wave that the market likes to fall back into before it finally tops).
I can't tell you the turn day, but it's a daily vigil now.
Gold and silver appear to be in fourth waves, but I don't suspect they'll top at the same time as the US indices.
The warning from pundits continues and more and more articles in mainstream media are warning of turns in previous metals and the US Dollar. Well, they're actually saying the opposite, but that's the usual contrarian sign I look for. As soon as it hits the news, you can bet it's going to turn.
I showed the wave structure for the USD Index last week, with a very obvious resolution close at hand (this weekend, we sit near the bottom of a second wave. A new high will confirm the top is indeed in place.
___________________________
Summary: It's an exhausted market about to top.
We appear to be in a "combination" fourth wave down from the 3400 area. We have an A wave down in place from 3400, a B wave up almost to that same level, and now we're completing the C leg down to a new low below 2100. There are several possible measured objectives below that point.
The balance of the drop from February should be a combination pattern and, as such, may contain zigzags, flats, and possibly a triangle or ending diagonal at the bottom.
Once we've completed the fourth wave down, we'll have a long climb to a final slight new high in a fifth wave of this 500 year cycle top.
______________________________
Trader's Gold Subscribers get a comprehensive view of the market, including hourly (and even smaller timeframes, when appropriate) on a daily basis. They also receive updates through the comments area. I provide only the daily timeframe for the free blog, as a "snapshot" of where the market currently trades and the next move on a weekly basis.
I do a nightly video on the US indices, USD Index (and related currency pairs), gold, silver, and oil) right down to hourly charts (and even 5 minutes, when required).
______________________________________


