
 It’s a Waiting Game
This market is toying with us. Getting a top in place is like herding cats.
Everything is so close to a top, but when several cats (asset, or often whole asset classes) make it to a new high and one’s out of line, everything tends to drop back and then they try again.
It’s an extremely frustrating (and overly-long) topping process.
This weekend, we have DAX that looks like it’s got a top in place. However, it’s only dropped in three waves so far and the fourth sideways wave is warning that the top may not actually be in. We need five waves down to suggest a top has formed and then three corrective waves up to around the 62% area to confirm one.
We only have three waves down as of this weekend.
Oil has done the same thing. It’s come down in three waves after teasing us with a small double top and a wave that broke the upper trendline of the ending diagonal. So, in fact, it could go right back up to a new high, or larger double top.
The US Dollar Index also rallied from a new low, but did so in three waves. It needs a new low. It’s possible the current pattern is an ending diagonal, which would be good in that ending diagonals are ending patterns and would definitely mark a final low. However, a timeframe is something I don’t have.
Futures are close to final highs but ES may have an additional fifth wave that has to play out. The NYSE and the Russell 2000 are at new highs.
So, overall, we’re exceptionally close across the board, but everything has to get to a new extreme together to turn down. A tedious process, I know, but that’s the challenge.
It will be obvious when it happens and it lowers the risk of a short entry at the top, as the upside is next to nil at this point. We just need a final top from all my stray, somewhat feral cats.
DXY (the US Dollar Currency Index)
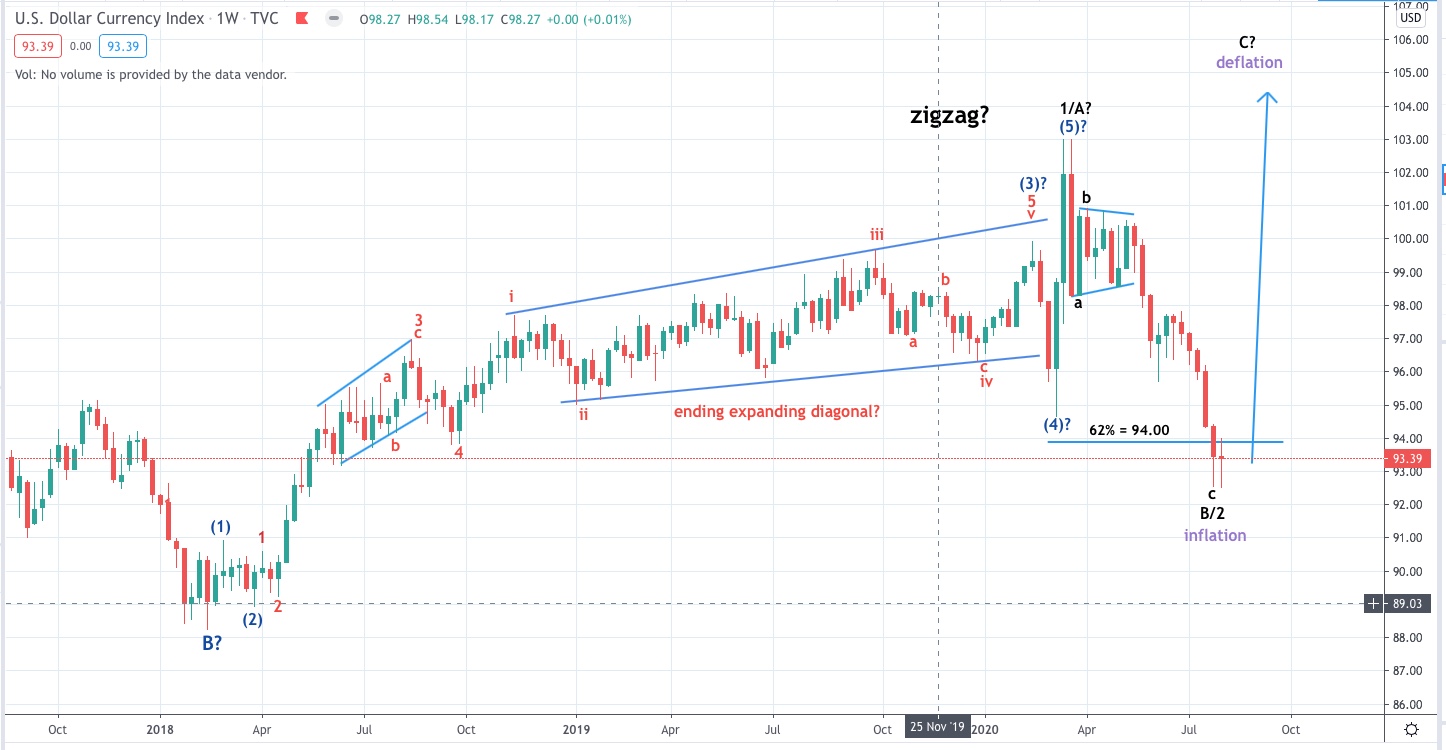
Above is the weekly chart of the US Dollar Index.
The US Dollar Index (DXY) is very closely aligned to the movement of the US indices (and I believe, as the reserve currency, it’s leading markets internationally).
Late in the week, DXY dropped to a slight new low and then bounced. We’re in the process of bottoming and the pattern (as of Friday) might be an ending diagonal (on a 30 minute chart). All the currency pairs are very close to turning points and it’s a day to day vigil, searching for a top for the larger market, a bottom for DXY.
The current turn up is corrective, so we don’t have a bottom in place yet. If we have an ending diagonal pattern forming, it will seek a new low for the final wave down and then turn up dramatically. We’re going to have to wait and see.
On a larger time scale, the turn from the 62% retrace level should result in another, but much larger, set of 5 more waves to the upside (we have one set of five waves up already in place, with the beginning in early 2018 at the 88.00 level (roughly).
That being the case, as DXY rises, we’re going to head into a deflationary environment (in conjunction with the drop of the 4th wave in the US indices). This is something I anticipated, but I expected it to happen once the US indices had reached their final highs, anticipated in the early part of 2021.
Know the Past. See the Future
_______________________
Want some truth?
My new site now has two extensive newsletters in place. Videos now explain the banking system and deflation, and I’ve provided lists of what to do and what the start collecting in preparation for the eventual downturn, which will last for decades. The focus of my new site is now to retain your wealth, plan for deflationary times, and stay healthy in the process. I’m also debunk a lot of the propaganda out there. It’s important to know what’s REALLY happening out there! Getting to the real truth, based on history, is what I do, inside the market and out.

To sign up, visit my new site here.
All the Same Market.
I’ve been mentioning for months now that the entire market is moving as one entity, the “all the same market” scenario, a phrase that Robert Prechter coined many years ago, when he projected the upcoming crash.
We’re in the midst of deleveraging the enormous debt around the world. Central banks are losing the control they had and we’re slowly sinking into deflation world-wide, with Europe in the lead.
The US dollar is fully in charge of both the equities and currencies markets. They’re all moving in tandem, as I’ve been saying since September of 2017. Over the past three years, their movements have been moving closer and closer together and one, and now they’re in lock-step, with the major turns happening at about the same time.
it’s challenging because often times currency pairs are waiting for equities to turn, and other times, it’s the opposite. The other frustrating thing is that in between the major turns, there are no major trades; they’re all, for the most part day-trades. That’s certainly the case in corrections, where you very often have several possible targets for the end of the correction.
We’re now close to a turn in the US indices, currency pairs, oil, and even gold. Elliott wave does not have a reliable timing aspect, but it looks like we should see a top very soon.
_________________________________
Elliott Wave Basics
Here is a page dedicated to a relatively basic description of the Elliott Wave Principle. You’ll also find a link to the book by Bob Prechter and A. J. Frost.
______________________________
Get an upper hand … JC 2
Get an upper hand in trading …Seeing all the different currency pairs and the wave structures and hearing you explain why this has to do that on a nightly bases gives one a upper hand when trading. Elliott Wave applies to all stock and indices and can be applied to any candlestick chart. If someone ask what you want for Christmas – Tell them a membership to Peter’s “Traders Gold!”—JC |
Have not had a losing week RW 2
Have not had a losing week …I have been with Peter almost a year. The only thing that matters is have I made money with his service. I think I have finally turned the corner using Peter’s EW. I have not had a losing week in the last 5 months. Thanks Peter, for your amazing amount of hard work. —RW |
Couldn’t be happier … KK 2
Couldn’t be happier …The analysis and insight you provide is simply amazing! I’ve been trading the futures and equity markets for well over thirty years and usually average around 5% monthly. Since joining your Traders Gold Service two months ago, that number has better than doubled. I couldn’t be happier.—KK |
A true expert in Elliott Wave FL 2
A true expert in Elliott Wave …You are a true expert in EW analysis. What you provide is not available anywhere and is priceless. Subscription on your services is the best thing I have ever done. Many thanks for your effort to make me a better investor. I now have more trust in my investment decisions. I hope you will continue the excellent work! —FL |
The best of them JL 2
The best of them …Last couple of years, I subscribed to several ‘market traders’. You are by far the best of them and the personal contact is awesome. Daily and daily updates are very well written! Besides your expertise in EW, I also like your cycles analysis. Best investment I ever made! —JL |
Tops in your field DZ 2
Tops in your field …You are tops in your field. Tried to follow Elliot Wave international for years. They were always behind the market. After discovering you, I perceive that you are an expert in reading the waves, which puts you way ahead of the rest of your peers. And you can read the Waves like you are reading tomorrow’s financial section. I pray you stay healthy. —DZ |
the real deal SM 2
The real deal …‘Educational, insightful and thorough market analysis for all levels of traders. It’s Elliott Wave at its best….Peter Temple is the real deal’ —SM |
Rise above the rest … SM 2
Rise above the rest …I have only ever met a few people who, in their chosen fields (astrology, medicine, music, martial arts, technical analysis), rise above all the rest and you are one of them…you have ‘the gift’…and that’s why I’m a Trader’s Gold member. —SM |
US Market Snapshot (based on end-of-week wave structure)
This chart is posted to provide a prediction of future market direction. DO NOT trade based upon the information presented here (certainly NOT from a daily chart).
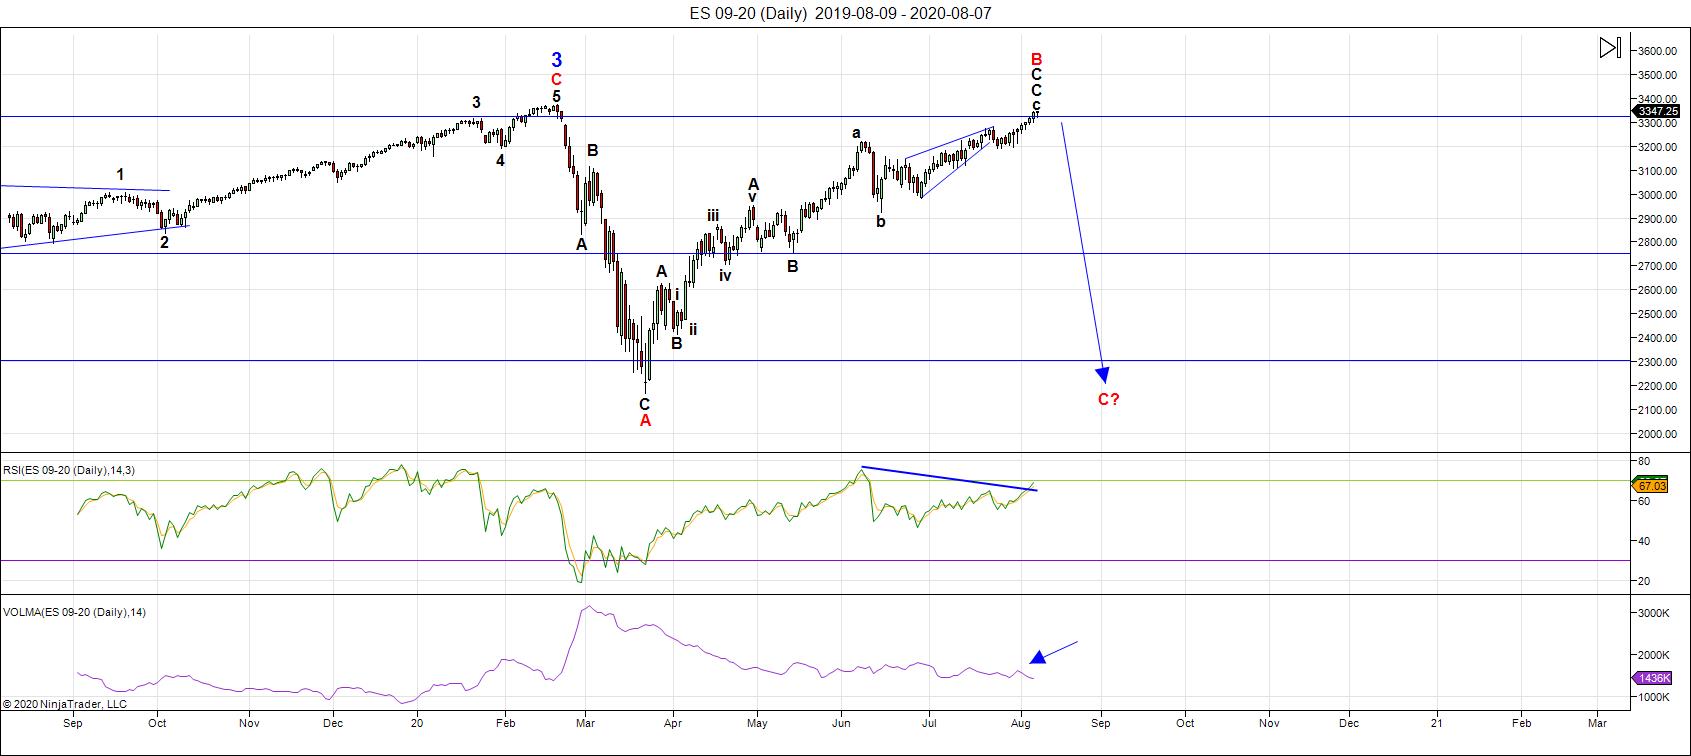
Above is the daily chart of ES (click to enlarge, as with any of my charts).
Last weekend, I noted that "We're at extremes just about everywhere, except perhaps oil." This week, oil finally topped by poking its head above the upper trendline of an ending diagonal. However, the C wave down this week, is corrective and we may have one more visit to the top — either that, or a retrace of just that C wave to the 62% retrace level.
As I've said before, finding this top is like "herding cats." All these asset classes need to start from highs in order to turn down, and you get several of them in place, with one cat out of alignment ... then they fall back and try again.
We're very close to having the herd in place, but it's now (DXY) the US Dollar Index that should provide the trigger. It reached a new low by a few cents, then backed off in a corrective wave; it needs another, final low.
On the US indices side of the equation, NYSE and the Russell 2000 were at double tops on Friday, and we wait for the pack to all be in place for the turn.
It's a tedious process and we're on a day-to-day watch for a turn across multiple asset classes, and, in fact, international exchanges.
Futures are probing new highs, but I don't expect there's much more left in that tank. My count is full, except for a final small sub-wave. We're looking for a first set of five waves down, and then a second wave retrace.
All this week (again), we had the pundits talking about the demise of the US Dollar and the expected gold rally into the stratosphere. These are sure signs the opposite is about to happen.
___________________________
Summary: It's an exhausted market about to top.
We appear to be in a "combination" fourth wave down from the 3400 area. We have an A wave down in place from 3400, a B wave up almost to that same level, and now we're completing the C leg down to a new low below 2100. There are several possible measured objectives below that point.
The balance of the drop from February should be a combination pattern and, as such, may contain zigzags, flats, and possibly a triangle or ending diagonal at the bottom.
Once we've completed the fourth wave down, we'll have a long climb to a final slight new high in a fifth wave of this 500 year cycle top.
______________________________
Trader's Gold Subscribers get a comprehensive view of the market, including hourly (and even smaller timeframes, when appropriate) on a daily basis. They also receive updates through the comments area. I provide only the daily timeframe for the free blog, as a "snapshot" of where the market currently trades and the next move on a weekly basis.
I do a nightly video on the US indices, USD Index (and related currency pairs), gold, silver, and oil) right down to hourly charts (and even 5 minutes, when required).
______________________________________


