
 Out of Gas
On the left is how I’m feeling about this market. Let it end, please!
This weekend, it looks like we’re finally going to get that wish.
There’s a full Moon on Monday with the apex at noon, EST. Full moons often warn of a turn down once their bullish influence wears off.
Sometime during the day on Monday, or at the latest, Tuesday, I’d expect to see our long-waited top (full moons often warn of a top, and we’re certainly ready for one!)
The big question this weekend is whether the structure that I’ve been calling an ending diagonal in both the SP500 and ES actually is one. The internal waves count just as well as a third wave, which would make our current position somewhere near the top of a final fifth wave.
The structures of the waves over the past week leave a whole lot to be desired. They’re impossible to count with any confidence, but they’re at least pointing to a slight new high. Keep in mind that the structure is questionable. The fact that we’re topping is not.
DXY has dropped below the 94.00 area and turned sharply up in what could be a motive wave, but not quite complete, if it is. We need to see a second wave down in three waves to below 62% of this recent wave up. Then we’re looking for a new high to confirm a bottom in is. We still could see another low (or double bottom the way things sit now).
WTI Oil still has one more wave up, the fifth of an ending diagonal, before it will finally turn down.
Gold and silver appear to be very close to, or at, turning points.
Monday is the big day, as far as I’m concerned.
Know the Past. See the Future
_______________________
Want some truth?
My new site and discount for monthly articles and video on how to stay healthy and wealthy over the next five years is now live. Getting to the real truth, based on history, is what I do, inside the market and out.

To sign up, visit my new site here.
All the Same Market.
I’ve been mentioning for months now that the entire market is moving as one entity, the “all the same market” scenario, a phrase that Robert Prechter coined many years ago, when he projected the upcoming crash.
We’re in the midst of deleveraging the enormous debt around the world. Central banks are losing the control they had and we’re slowly sinking into deflation world-wide, with Europe in the lead.
The US dollar is fully in charge of both the equities and currencies markets. They’re all moving in tandem, as I’ve been saying since September of 2017. Over the past three years, their movements have been moving closer and closer together and one, and now they’re in lock-step, with the major turns happening at about the same time.
it’s challenging because often times currency pairs are waiting for equities to turn, and other times, it’s the opposite. The other frustrating thing is that in between the major turns, there are no major trades; they’re all, for the most part day-trades. That’s certainly the case in corrections, where you very often have several possible targets for the end of the correction.
We’re now close to a turn in the US indices, currency pairs, oil, and even gold. Elliott wave does not have a reliable timing aspect, but it looks like we should see a top very soon.
_________________________________
Elliott Wave Basics
Here is a page dedicated to a relatively basic description of the Elliott Wave Principle. You’ll also find a link to the book by Bob Prechter and A. J. Frost.
______________________________
Have not had a losing week RW 2
Have not had a losing week …I have been with Peter almost a year. The only thing that matters is have I made money with his service. I think I have finally turned the corner using Peter’s EW. I have not had a losing week in the last 5 months. Thanks Peter, for your amazing amount of hard work. —RW |
Couldn’t be happier … KK 2
Couldn’t be happier …The analysis and insight you provide is simply amazing! I’ve been trading the futures and equity markets for well over thirty years and usually average around 5% monthly. Since joining your Traders Gold Service two months ago, that number has better than doubled. I couldn’t be happier.—KK |
the real deal SM 2
The real deal …‘Educational, insightful and thorough market analysis for all levels of traders. It’s Elliott Wave at its best….Peter Temple is the real deal’ —SM |
Tops in your field DZ 2
Tops in your field …You are tops in your field. Tried to follow Elliot Wave international for years. They were always behind the market. After discovering you, I perceive that you are an expert in reading the waves, which puts you way ahead of the rest of your peers. And you can read the Waves like you are reading tomorrow’s financial section. I pray you stay healthy. —DZ |
Get an upper hand … JC 2
Get an upper hand in trading …Seeing all the different currency pairs and the wave structures and hearing you explain why this has to do that on a nightly bases gives one a upper hand when trading. Elliott Wave applies to all stock and indices and can be applied to any candlestick chart. If someone ask what you want for Christmas – Tell them a membership to Peter’s “Traders Gold!”—JC |
A true expert in Elliott Wave FL 2
A true expert in Elliott Wave …You are a true expert in EW analysis. What you provide is not available anywhere and is priceless. Subscription on your services is the best thing I have ever done. Many thanks for your effort to make me a better investor. I now have more trust in my investment decisions. I hope you will continue the excellent work! —FL |
Rise above the rest … SM 2
Rise above the rest …I have only ever met a few people who, in their chosen fields (astrology, medicine, music, martial arts, technical analysis), rise above all the rest and you are one of them…you have ‘the gift’…and that’s why I’m a Trader’s Gold member. —SM |
The best of them JL 2
The best of them …Last couple of years, I subscribed to several ‘market traders’. You are by far the best of them and the personal contact is awesome. Daily and daily updates are very well written! Besides your expertise in EW, I also like your cycles analysis. Best investment I ever made! —JL |
US Market Snapshot (based on end-of-week wave structure)
This chart is posted to provide a prediction of future market direction. DO NOT trade based upon the information presented here (certainly NOT from a daily chart).
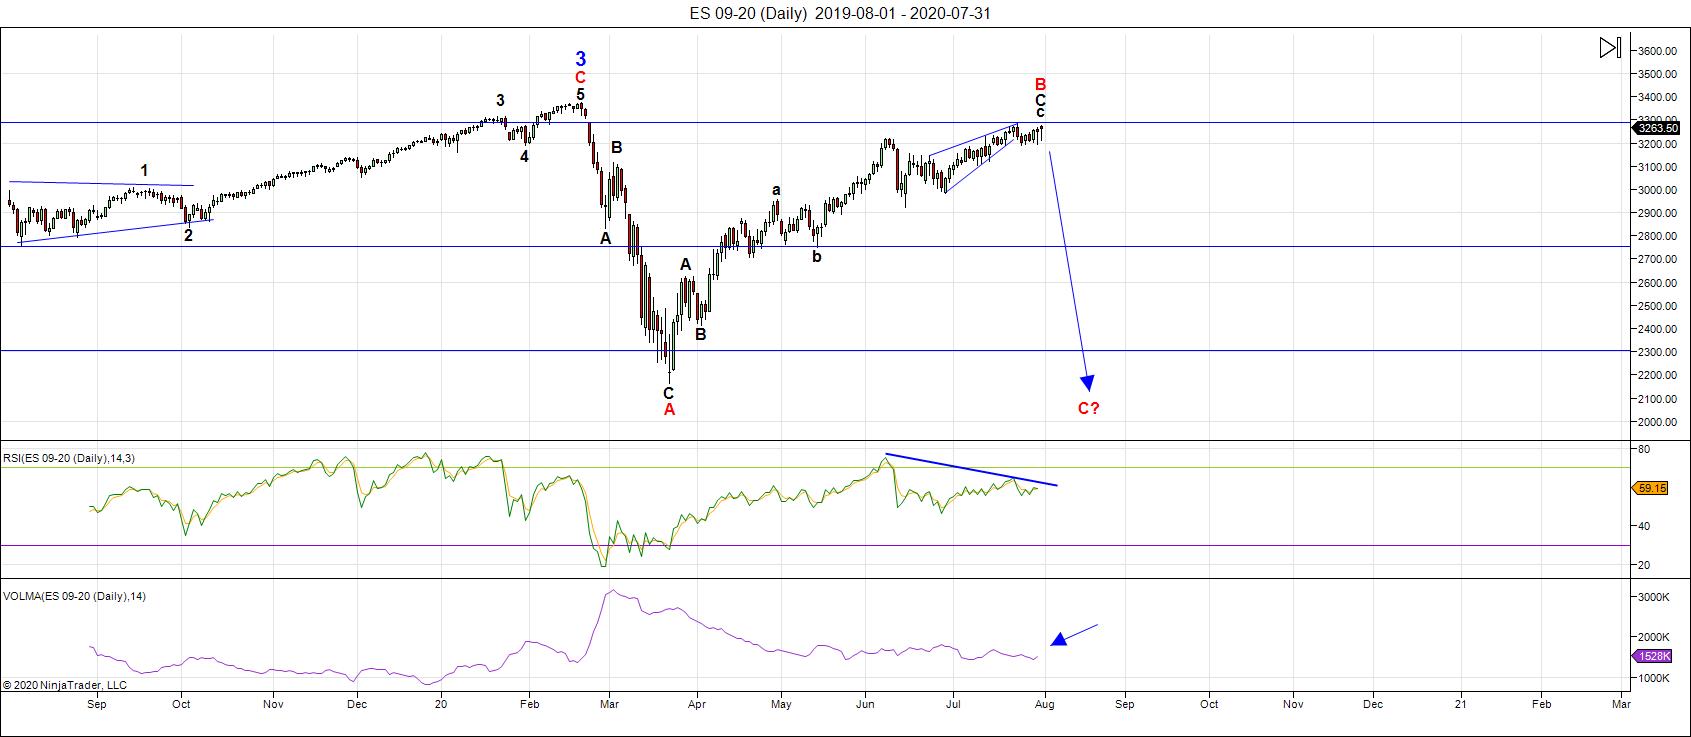
Above is the daily chart of ES (click to enlarge, as with any of my charts).
We're at extremes just about everywhere, except perhaps oil, which is in an ending diagonal, but having difficulty climbing its final wave to the top. Never fear, however, it will get there.
Last week, we finished what appeared to be an ending diagonal in SPX. However, that count is in jeopardy, as I can also count it as a third wave, with the expectation of a new high to finish off this roughly four month rally. The wave structure has become questionable and as a result, I don't have a measurement for a top tick — there are too many options this weekend.
Ending diagonals on rare occasions finish the five waves of the diagonal and then slowly rise "against the current" to complete a double top. That's one option. There's also the option that we're going to see a relatively benign fifth wave, as I can also count the internal waves of the ending diagonal as a third wave. We could also just see a double top, but ES and the SP500 won't both do double tops (they have different current highs in price), and so I'm expecting slight new highs from both the SP500 and ES.
It's become obvious late this week that we're rallying to a final test of the highs in both ES and NQ. Wave action tells me this market is "out of gas."
We have a full Moon on Monday, August 3, at about noon EST. I'd expect this event to have an effect on the market.
I warned on Thursday about the potential tech blow-off at the end of the day (AMZN, FB, AAPL, and GOOG reported) and sure enough, we got it. However, at this late stage, it stands as a last ditch effort to make a positive statement, with little positive data to support it. Look out below.
All this week we had the pundits talking about the demise of the US Dollar and the expected gold rally into the stratosphere. These are sure signs the opposite is about to happen.
___________________________
Summary: It's an exhausted market about to top.
We appear to be in a "combination" fourth wave down from the 3400 area. We have an A wave down in place from 3400, a B wave up almost to that same level, and now we're completing the C leg down to a new low below 2100. There are several possible measured objectives below that point.
The balance of the drop from February should be a combination pattern and, as such, may contain zigzags, flats, and possibly a triangle or ending diagonal at the bottom.
Once we've completed the fourth wave down, we'll have a long climb to a final slight new high in a fifth wave of this 500 year cycle top.
______________________________
Trader's Gold Subscribers get a comprehensive view of the market, including hourly (and even smaller timeframes, when appropriate) on a daily basis. They also receive updates through the comments area. I provide only the daily timeframe for the free blog, as a "snapshot" of where the market currently trades and the next move on a weekly basis.
I do a nightly video on the US indices, USD Index (and related currency pairs), gold, silver, and oil) right down to hourly charts (and even 5 minutes, when required).
______________________________________


