
Update Friday, May 27: Before the Open
US futures have all done double tops (SPX did so yesterday) so we’re all lined up for the fourth wave drop.
USDJPY at an inflection point. Watch for a big drop very soon.
USDCAD and EURUSD continue on to their targets, as does Gold.
______________________
Update Thursday, May 26, At the Close

Above is the 60 minute chart of ES (SPX futures). Not much change since this morning.
I’m showing the path so far of what I would expect in a “normal” market, which this is anything but. Because of the structure of this wave, it’s making targets difficult to identify specifically. The internal waves in futures near the top of this third wave are really cluttered. This morning, we appear to be dropping in the fourth wave, which makes the third wave a little shorter than expected (we often see this at market tops).
In any event, we should eventually see a wave 4 to the 38% retrace level (about 2066) and then a final fifth wave up. Wave 5 may be shorter than the projection here, but at 1.1618 X wave 1, I put the top at 2120 max. Nasdaq, SPX, and DOW show similar configurations.
Even though the underlying structure of the 3rd wave up is questionable, the action in the market now is definitely bullish. As I said in a past post, I expect this fourth wave to be long and drawn out. It may also be shallower than expected.
___________________________
Update Tuesday, May 24, After the Close
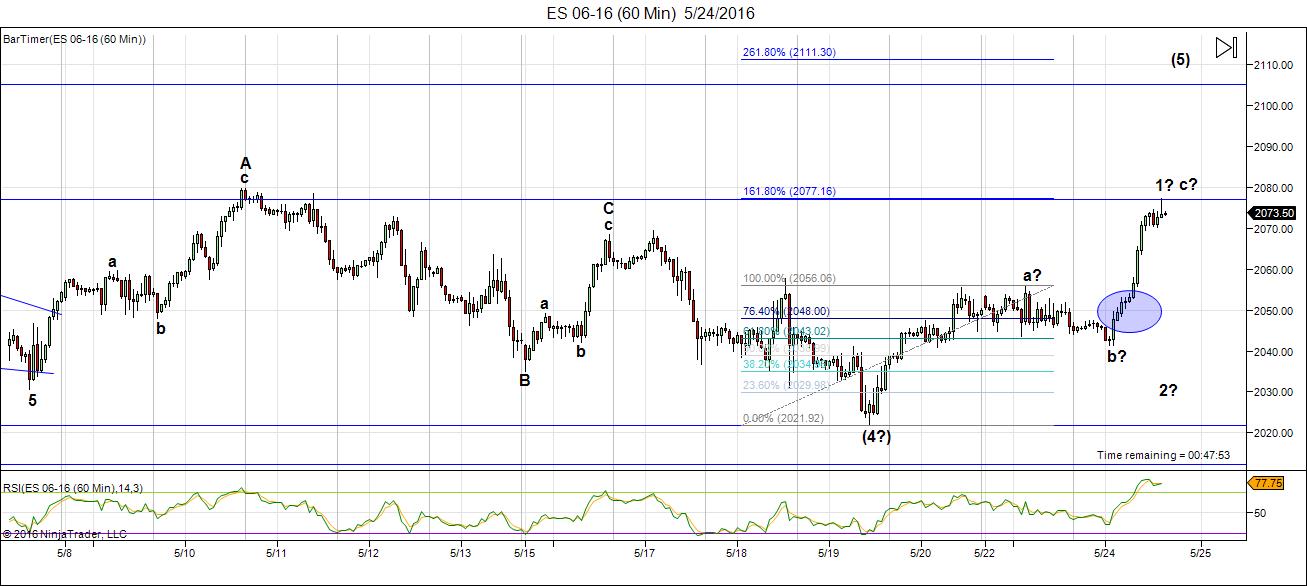
Above is the 60 minute chart of ES. Well, this was an “interesting” day. Let me try to explain the dilemma in analyzing our next move.
We had a very motive set of waves up from the 2022 bottom to a? and then a corrective wave down to the previous 4th wave at approximately 2041. The wave up today is where it gets interesting.
You can see the fibonacci retracement tool on the chart measuring the length of the first wave of the sequence. The extension measurement points to 2077, which is where we stopped. Now this measurement works for both a first wave and an abc corrective wave, so it doesn’t tell us much, except where we expect to stop.
The blue circle surrounds the point where we should have had a second wave if the wave up is the fifth wave of the first. Even if this is a third wave up, there should be a second wave there, but there isn’t. So, this tells me this is a corrective wave, believe it or not. If correct, we should retrace the entire wave up. What makes this more interesting is that I’m still concerned that we didn’t bottom correctly. For those reasons, I’d have to say we’re going back down to the start as the highest probability move.
I have labelled the entire wave an abc wave expecting a move down. I have also left the motive labels on the chart, in case somehow I’m wrong. If this is indeed the first wave up, we’d need to complete a second wave (a 62% retrace of the entire wave). If it’s somehow wave 3, then we’d retrace only 62% of the c wave. Those are all the options I see, the abc wave being my top choice.
There’s one other reason for this. Usually a fourth wave (or any corrective wave) would trace out a double bottom. Wave four did not do that. So we’ll watch what happens overnight and tomorrow.
If we head back down, we still don’t have a clear path to a motive wave, so the direction is still up. This market seems to want to make us all crazy.
The currencies are also pointing to a retrace in the US market. The euro is below. It didn’t change much over the course of today.
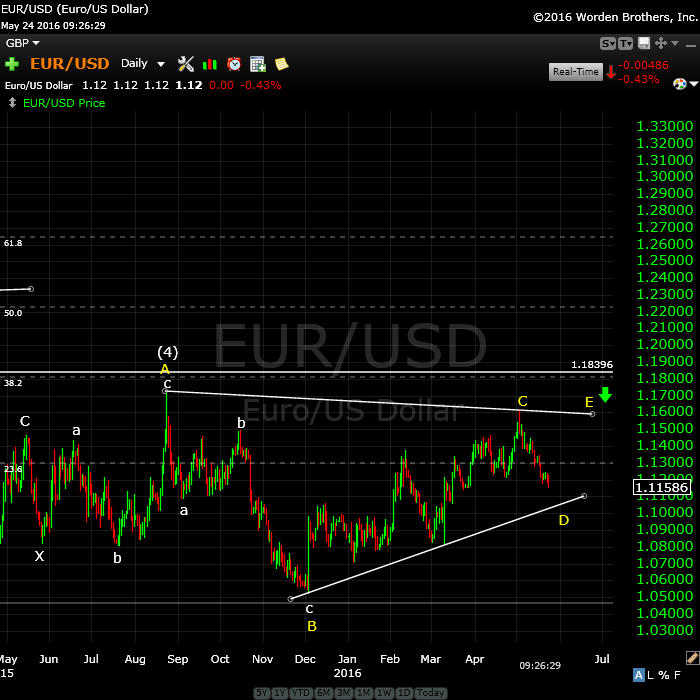
Above is the daily chart of the EURUSD as at this morning. I’m changing the configuration slightly. We’ve dropped to a point where it looks at though the triangle is in play. I would expect to touch the lower trendline in the D wave before heading up in the E wave. It looks like to point A of the triangle is going to be “close enough” to the 38% retrace level to do for the fourth wave.
__________________________
Update: Monday, May 23, After the Close
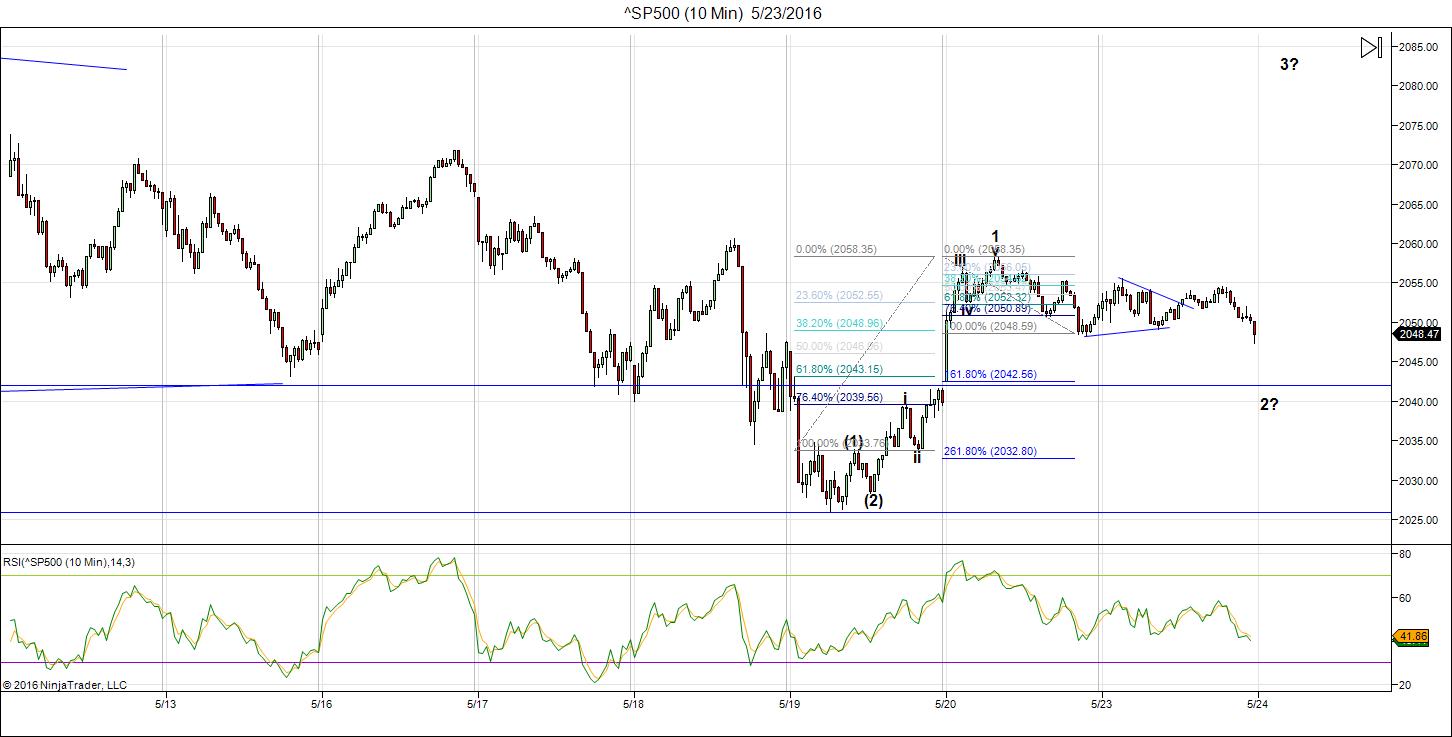
Above is the 10 minute chart of the SPX. Well, this is a bit of a cat and mouse game. I’m not entirely sure what the market is doing—there are at least a couple of options. I’ve labelled the chart a little differently, due to the size of the wave over the past two days.
We have a motive 5 waves within a potential larger wave (due to the (1)-(2) count). So this may be suggesting a shorter drop to a larger degree second wave and then a third, fourth, and fifth, which all together would make up the larger 3rd wave. Finally, we might get a larger fourth and fifth wave higher up.
The direction is up—just not sure how we’re getting there, but this would be my best guess.
I’m showing two fib retracement tools on the chart. The left-most one shows the 62% retracement level of the inner 5 waves. The right-most tool shows the extension of the A wave down. They both point to about the same point as a retracement level (about 2042). This then might turn up into a third wave at that level.
_____________________
Original Post (Saturday, May21): The Last Upper … Yes, this should be the last “up wave” in the US market. For a long time I’ve maintained that the wave up from February 11, 2016 is a corrective wave and that it’s completing wave 2 up, with wave 3 down soon to follow. There are a lot of skeptics out there and even more, crazier projections than I’ve ever seen! 🙂
However, I continue to remain as objective as I can and just follow the wave count. So far, it hasn’t led us astray. We’ve been highly accurate. It’s also the reason I won’t look at any charts you send me and don’t pay particular attention to events in the news. They’re interesting, but they’re caused by human mood. The market is a mathematical representation of human mood. Figuring out the market gives us a clue to upcoming events, but events themselves don’t influence the market to any great degree.
Objectivity is the key to predicting the future of the market based on Elliott waves.
Another huge factor is the All the Same Market scenario we’re seeing at the moment.
I’ve been mentioning for months now that the entire market is moving as one entity, the “all the same market” scenario, a phrase that Robert Prechter coined many years ago, when he projected the upcoming crash.
We’re starting to deleverage the enormous debt around the world. Central banks are losing the control they had and we’re slowly sinking into deflation world-wide, with Europe in the lead.
The US dollar is fully in charge of both the equities and currencies markets. They’re all moving in tandem, as I’ve been saying since September of last year. For a short while, currencies were moving contra to the US market, but for the two months or so, they’ve been moving together.
Watching the charts of the Euro and US dollar provide a foreshadowing of where the US market is headed. It’s the same with gold. As the final wave up in the US indices unfolds, gold should finally head down to complete its second wave—another projection I’ve had out there for sometime now.
The dollar will turn up and the euro will turn down at the same time the US equities market tops in this second wave.
Positive human mood is waning. We’re about to turn negative. My attention is turning to finishing my book, my course, and creating more videos. I will not be around much during the day, but will answer your questions when I can.
Bottom line in the SP500 (and other US indices): We have one motive wave up at small degree almost complete. Once we see a second wave down in three waves, a correction of 62% of the first wave up, we will have confirmed the change in trend. That will lead to a 3rd, 4th, and 5th wave up to a final top. I’m still projecting a top at 2116 in the SP500.
______________________________
Here’s a video overview of the market for Monday, May 23, 2016:
Market Report for May 23, 2016  |
 |
Make sure you zoom the video to full size with frame expander (arrows) in the bottom right hand corner and also set the quality to as high as your web connection allows. This is an HD quality video so the best viewing is at that level. |
Special Treat: Free Video on Motive vs. Corrective Waves
NOTE: You must be registered and logged in to the forum to be able to see this video. It’s a lesson on the difference between motive and corrective waves using the Russell 2000 as an example. It comes from my Elliott Wave Master Class course (in the works).
I will leave it up for the rest of this week. Go to: https://worldcyclesinstitute.com/forum/elliott-wave-resources/motive-vs-corrective-waves/
It’s a YouTube video, so be sure to set the quality to the maximum your connection allows. It’s only about 8 minutes long.
Enjoy!
_______________________________
The Charts Going into Monday
The US indices have found the B wave bottom and are heading up in a final C wave (in 5 waves).
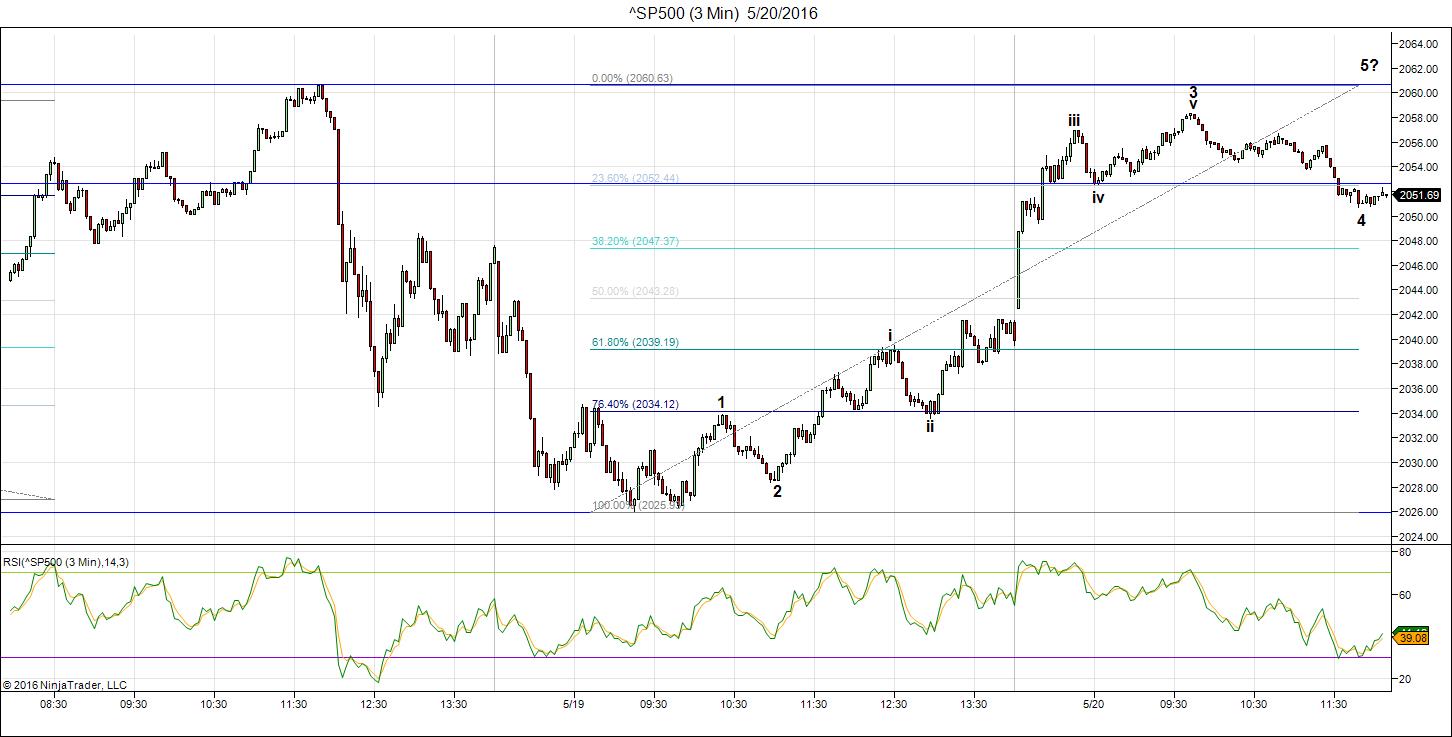
Above is the 3 minute chart of ES now showing a fourth wave of the first wave up looking for a bottom. We should still drop to the 38% level before heading up to complete the 5th wave of the first. Then down in a second wave to the 62% level, before turning up in a third wave (of the C wave). Ending waves should be in 5 waves, unless they’re a triangle, or ending diagonal.
It’s interesting to note that the wave up has a 1-2, 1-2 configuration, which threw me off. I saw overlapping waves and so thought initially that this wave would come back down. However, it’s turned into a motive wave up. The other thing that was somewhat disconcerting (and still is) is that the bottom is not a double bottom. Therefore there’s an extra wave there. That’s the second reason I thought the waves were overlapping. However, I guess in a C wave, that’s good enough. It only missed by a few cents, so the overwhelming construct is of a motive wave.
Technically, the first wave is not confirmed until it’s complete and we’ve seen the following second wave turn up.
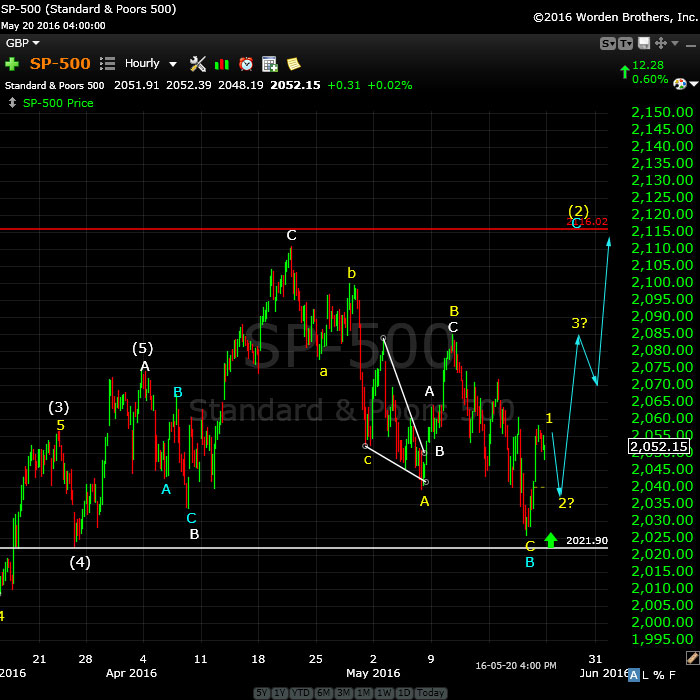
Above is a one hour chart of SPX. We’ve bottomed the B wave and have a larger ending wave still to complete. Ending waves should go up in 5 waves. You can see I’ve put in a projected path.
USDCAD and EURUSD are also in fourth waves now, consistent with that the equities are doing. USDCAD should now turn down and EURUSD up (once the 2nd wave in US equities has bottomed).
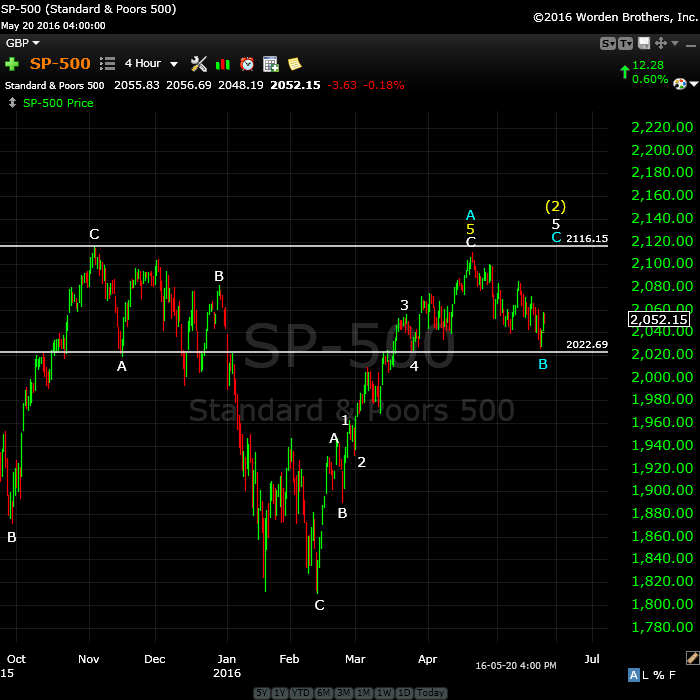
Above is the 4 hour chart of the SP500, showing the double 2nd wave top waiting to finish tracing out. This would negate the possible “truncation” from November of last year and create a spectacular EW textbook set up for a huge third wave down.
It’s typical in a bear market for second waves to trace out a double prong (an ABC wave down in this case from early November and a corrective structure up to where we are today). The wave up shows a C wave with 5 waves up (for simplicity in this chart. The entire wave, however, is not motive, and has traced out a very clear ABC pattern overall. I have therefore labelled this wave more correctly, showing that it is indeed a 3 wave corrective wave, with the (blue) C wave up expected to produce a final ending wave of 5 waves.
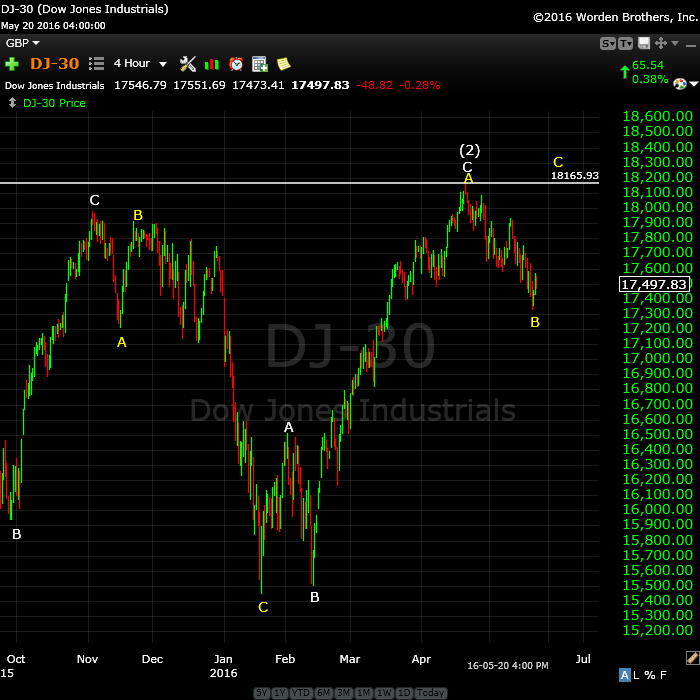
Above is the 4 hour chart of the DOW. It’s similar to all the other indices, as it should be. I predicted we’d reach the previous 2nd wave high and that in fact is what we’ve done. Look for a double top with the most recent high before a turn down. The reason I show this index is that I’m always looking to other indexes for confirmation of a move. You’ll note that the DOW did not come down to a new low in February, so this puts it clearly in a corrective abc wave up. As all the indices move in tandem, this supports the fact that SPX is also in a corrective wave.
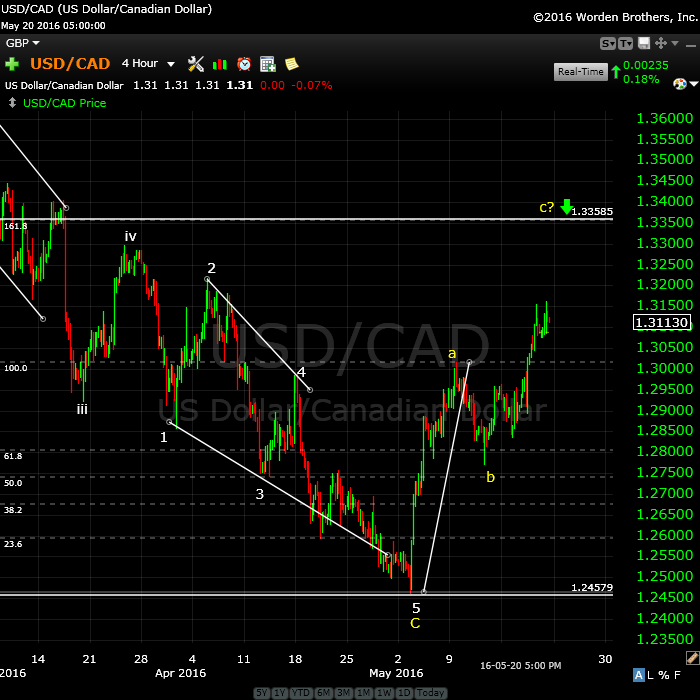
Above is the 2 hour chart of USDCAD. I have been stalking this for some time, waiting for it to top and we’re getting close. I’m presently long, but have only been able to take advantage of the C leg of this wave.
The larger pattern down is an ABC corrective wave, and we have an ending diagonal, which is complete at ~1.24579. However, I expect the current wave up in 3 waves to reach ~1.33585 before turning down to trace out a double bottom (to ~1.246). It could also drop to a lower level. Then it will turn back up into a very large 5th wave.
The euro, Australian dollar, dollar, and Canadian dollar are all at similar major inflection points.
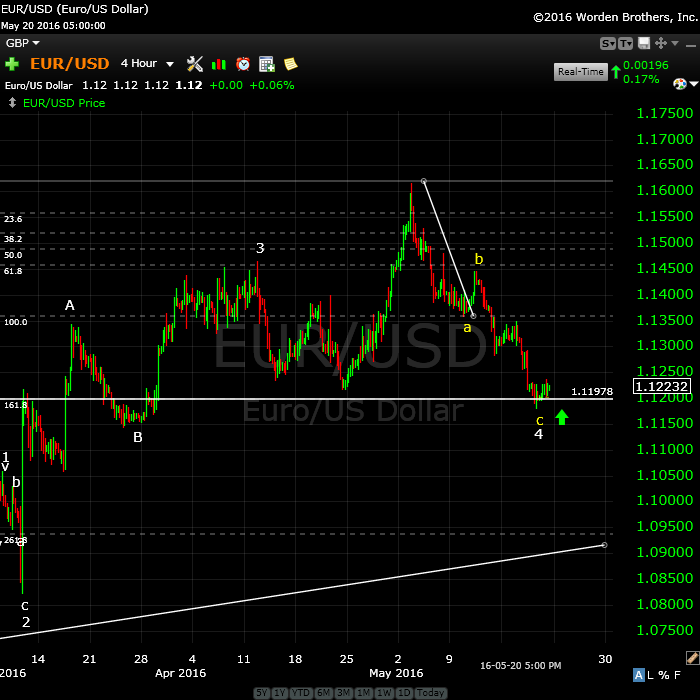
Here’s the 4 hour chart of EURUSD showing the “4th wave” of the major corrective pattern we’ve been in since March, 2014. I predict we’re going to hit the 38% retrace level (~1.182) that I’ve been suggesting for the past 8 months or so (not shown in this chart).
As I explain in the video, the ABC wave heading down (shown above) can be easily measured for an end point using your fibonacci tool. It’s at a bottom, but I expect it to test that bottom before turning around and heading up in its final wave.
It should turn in tandem with the US equities.
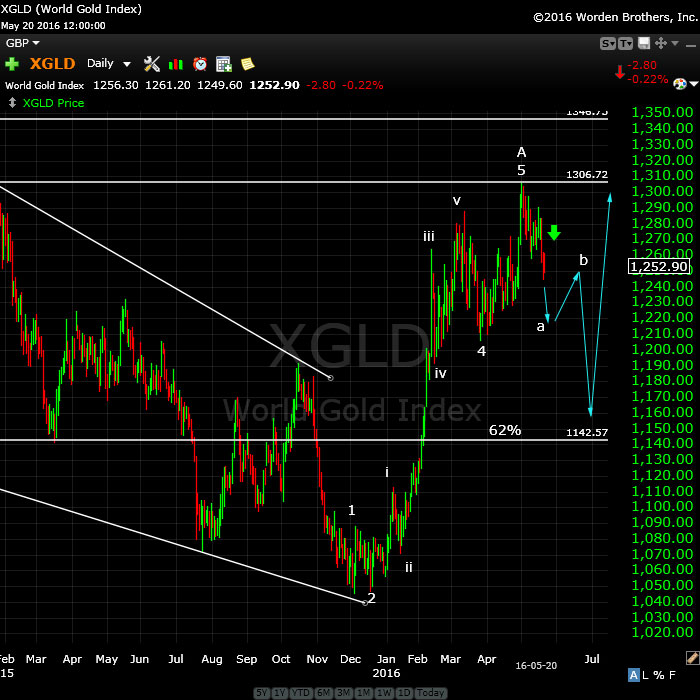
Above is the daily chart of XGLD (gold). We started to move during the last week. The bottom line is that we should continue down here.
The target on the low side is the 62% retracement level, somewhere close to 1142.
________________________
First Wave Down – What to Watch For
This weekend we’re dangerously close to a top of a second wave (in the fifth of the fifth, with an ending diagonal pattern).
What we’re looking for to confirm a turn is a motive wave down in 5 waves at small degree. After that, we should get a second wave that will retrace up in 3 waves about 62%. That’s the preferred EW entry point. So don’t feel you have to rush in. There’ll be a much better opportunity at the second wave level than at the top and the risk is substantially reduced.
__________________________
History: The 1929 crash
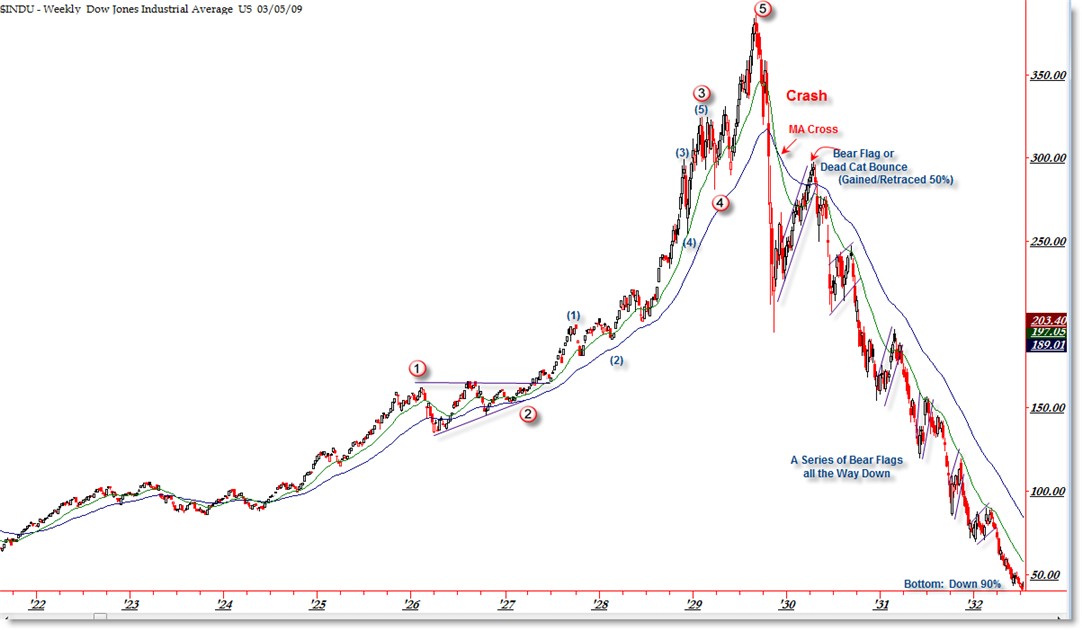
I think it’s important to look at 1929 and the wave structure (above and below), which was the same as 2007—to a point. I will show the 2007 crash below in the “What If” section.
The wave structure of the 1929 crash was in 3 waves overall. There were 5 waves down from the top (the A wave) and then a very large B wave retrace. The final C wave down was a stair-step affair and lasted over 2 years.
Let’s look a little close at the timing of the 1929 crash because the similarities to today are uncanny.
The market peaked on September 3, 1929 and then it took 2 months for the crash to actually happen (to reach the bottom of wave 5 of the A wave). The larger crash which we always hear about began on October 23, 1929. Then there was that large B wave, which lasted 5 and a half months and finally (which I explain a little further in the cycles section below), the C wave which went on for more than 2 years. This might be the scenario we’re looking at going forward.


For the Pancholi folks: I would expect the next major turn date to be the bottom of the fourth wave and the major one after that is likely the top of this monster.
Oke let me guess June 2 is the drop of the 4 wave and June 5 is The monster cookie (mercury max elogation west and Venus conjunct the sun).
Thanks Peter..
Peter,
I follow equity, not so much dollar/euro or dollar/canadian.
is there a chart showing the longer term projected elliott waves, I’m a bit confused looking at the short term chart, i would expect with us stocks going to crash, the dollar should rise against Canada and europe. Sorry if you have answered this. Regards
Looking the US indices shortly after noon market time: I didn’t think ES/SPX were going to make it to the targets but they’re both within a whisker of hitting them. SPX has about a buck to go and ES about 50 cents. That will end what I’m going to label as a C wave in futures. I think futures are in an ending diagonal. I’m not sure about SPX yet, but it may be also. This means we have a big drop ahead of us in a second wave (but not to a new low). Look for a top today … or perhaps the US market will stay up here going nowhere until Tuesday morning.
There’s really not a lot to go on yet in terms of definitively labelling this unfolding pattern, but this set of waves up has looked fishy from the start. I’ll attempt to flesh this out more on the weekend in a video.
By your measurement, what type of drop could we see on SPX in this second wave?
Thank you for all your efforts. You have been spot on!
Charlie,
I’ll handle on the weekend. Likely a video tomorrow.
now people are calling 19,000 on dow
SPY ETF’s 5 day volume moving average is now lower than both Thanksgiving week and the Christmas and New Years holiday.
IWm close to 115
Low volume melt up. Crash calls gone now they r saying no brexit. Fed will raise rates. Strong dollar gold melt down fow going to 21000
Peter in your weekly analysis please include iwm thanks
Rose, it will be similar to all the other indices.
New post: https://worldcyclesinstitute.com/a-predictable-ending/
This website is for educational purposes relating to Elliott Wave, natural cycles, and the Quantum Revolution (Great Awakening). I welcome questions or comments about any of these subjects. Due to a heavy schedule, I may not have the time to answer questions that relate to my area of expertise.
I reserve the right to remove any comment that is deemed negative, is unhelpful, or off-topic. Such comments may be removed.
Want to comment? You need to be logged in to comment. You can register here.