
 A Contested Election
Since we’re up against the November 3rd US election with a fifth and final wave up to go, it’s impossible to know when our top will materialize. I expect it’s before year end, but may depend on the announcement of the winner. Getting there may be a very rocky ride.
Every index now on the NYSE side of the market (not the Nasdaq) is in an ending diagonal — either a regular diagonal or an expanding diagonal.
These diagonals are extremely difficult to trade and, in fact, the Elliott Wave Principle book suggests the only wave you can trade is the final, fifth wave, because you don’t actually know you have a diagonal formed until the fourth wave is in place.
Even at that, the subwaves do not conform to fibonacci measurements and the waves themselves must be corrective. So, trading them is more or less a guessing game. However, if you’re careful, you can day-trade some of the subwaves, once you know more or less where you are in the pattern.
In the world of currencies, the pattern of choice is a broadening top (which is simiilar to expanding triangles). Their traits are similar in some respects to those of ending expanding diagonals, except for the fact that waves tend to wander much more. In other words, they are even harder to predict.
In broadening tops, the wave to trade is also the final fifth wave. The challenge is that it can wander about even more than in ending diagonals. The ideal strategy is to enter near the trendline and simply stay in the trade until the other trendline is reached.
On the Nasdaq side, we now have a contracting triangle forming at the top in both NDX and NQ. Altogether, it’s a minefield.
In short, this is the most difficult market to trade successfully that I’ve ever seen. It requires lots of patience, keeping exposure low, and stops tight.
The other issue is timing. I was expecting we’d see a high at the election on November 3 (or sometime shortly thereafter) but the market has obviously thought otherwise. I think we’ll still see a drop once the final decision is known. However, the market seems to be telling us that this election will be contested, because we’re currently sitting at the bottom of the fourth wave of the ending diagonal.
In SPX, we’re going to see about a 500 point rally to the final target. Tonight I looked at the third wave of the ending diagonal in ES, which was about that length. It took 2 months to play out. Fifth waves generally move up more dramatically than third waves (in ending diagonals), so I expect the time factor to be a bit shorter than two months (although that’s somewhat speculative).
The final caution is that fifth waves have to be abc waves and can be quite volatile. They can be difficult in themselves to trade.
The good news is that these diagonals have targets that can’t be exceeded so that there’s is, in effect, a top to the market. That makes the entry a little bit easier because if we achieve the maximum projected length, you have a lower risk of entry.
I don’t expect any of this to be easy, but the carrot is that the eventual drop will be about 1800 points in the SP500 and should drop at the rate of the set of waves down from February, which ended up being about a month for the entire move.
“May you always live in interesting times.” — Anonymous
___________________________
Toronto Exchange (Big Picture)
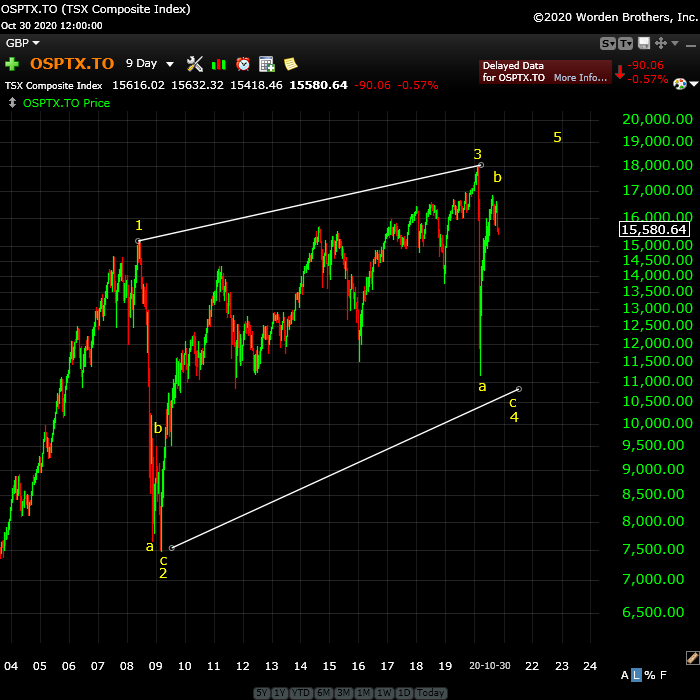
Above is the 9 day chart of the TSX (Toronto Stock Exchange). I’ve said several times that I think this chart is the scariest long-term chart out there. As it turns out, the NYSE chart below is just as scary.
This is an enormous ending diagonal. It began at the top of what otherwise would have been the fifth and final wave of a 500 year rally — in the year 2007. Well, we know what happened!
Central bankers got involved and injected $24 billion dollars on August 9, 2007, which propped up the market. But you can see that all it’s done is make things worse. It’s widened the gap between the rich and poor and prolonged a depression, which we’re going to experience, anyway, under much more trying conditions.
Ending diagonals require 5 waves and they must all be corrective. We’re currently in the fourth wave, but we only have an a and a b wave in place. It requires a c wave down and then one more wave to a new high.
NYSE Exchange (Big Picture)

Above is the 9 day chart of the NYSE.
Ending diagonals require 5 waves and they must all be corrective. We’re currently in the fourth wave, but we only have an a and a b wave in place. It requires a c wave down and then one more wave to a new high.
Now, you might think the fourth wave is already complete because the wave down from white 3 is at abc wave, and that would be a valid comment. It’s why you always look at other, related charts (in this case, another exchange, like the TSX). In the TSX chart above this one, it’s obvious that the A wave down is not a “three” (all waves in ending diagonals must be “threes”) and it’s highly unlikely that two exchanges in this environment are going to top at different times. Everything is moving in tandem and has been for the past couple of years.
As a result, you count the most recent wave down from the top as an A wave, which means you’ll have a C wave after the B wave exhausts itself to the upside (which it’s getting close to doing).
NYSE – Ending Diagonal
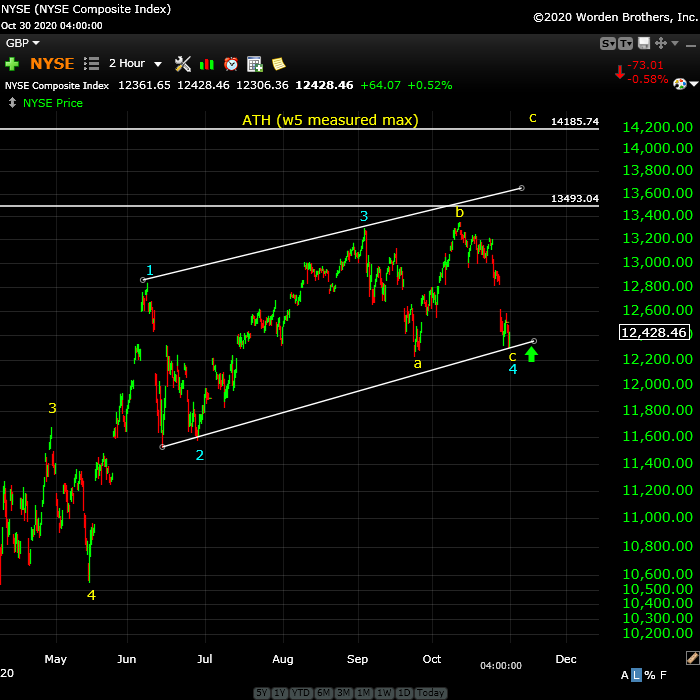
Above is 2 hour chart of NYSE showing us a very large ending diagonal.
The entire wave up from March is corrective, telling us it must completely retrace to the bottom.
The problem with trading ending diagonals is that you don’t really know you have one until the fourth wave is in place and since there are no real rules within ending diagonals, and fibonacci measurements don’t work, it’s impossible to know how long the waves will be. However, with the fifth wave, you know (in this case) that it needs to at least reach the upper trendline and may do what we call a “throw-over” (reaching even higher). However there’s a cap on the throw-over since the fifth wave cannot be longer than the third wave.
We’re currently at the bottom of the fourth wave, expecting a rally to take us to at least the upper trendline. The time factor is the questionable element. Elliott wave does not have a timing component to it. I’m expecting an all time new high around the 13,500 level. But, it will not reach the upper trendline.
DOW – Ending Diagonal

Above is 4 hour chart of the DOW showing us the partially formed ending expanding diagonal.
These diagonals are more difficult to trade than regular diagonals because the trendlines converge and the angles can vary. So, there’s no way of knowing the lengths of the subwaves beforehand. However, once four waves are in place, you know you’re going to have a final fifth wave up, in this case, to the upper trendline.
IWM (Russell 2000)— This Weekend
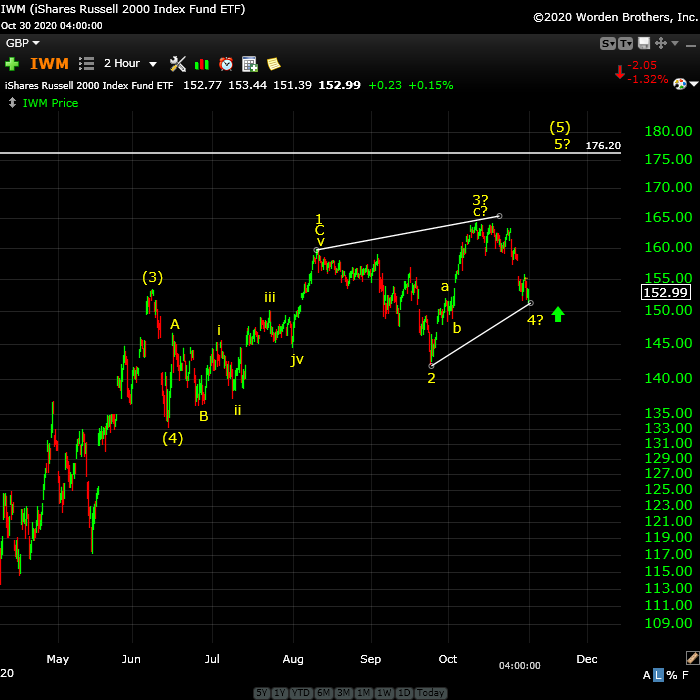
Above is the 2 hour chart of IWM (the Russell 2000) showing us the fifth wave up before a large trend change to the downside.
This week, the current wave down dropped so low that’s it’s now overlapping the first wave up. That means the whole structure cannot be a motive wave up from the bottom of wave yellow (4). It’s quite suddenly become yet another ending diagonal.
The recent wave down is the fourth wave of the ending diagonal, and it’s obviously corrective. So, it now appears that just about every US equities index on the NYSE side is corrective and in some sort of ending pattern.
Both NQ and NDX appear to be in contracting triangle as of this weekend — taken together, this is about as dangerous as a market can get.
Interestingly enough, the measured target here remains the same — in the 176 area.
Know the Past. See the Future
_______________________
Free Webinar Playback: Elliott Wave Basics
 If you’re new to the Elliott Wave Principle, or even fairly comfortable with it, this webinar will give you a solid introduction and comprehensive understanding of the difference between trending and counter-trend waves, the various patterns for both types of wave patterns, and a good overview of how fibonacci ratios determine trade targets.
This is link to the YouTube playback video, allowing you to review, stop and start, etc.
____________________________
Want some truth?
My new site now has several extensive newsletters in place. Videos now explain the banking system and deflation, and I’ve provided lists of what to do and what the start collecting in preparation for the eventual downturn, which will last for decades. The focus of my new site is now to retain your wealth, plan for deflationary times, and stay healthy in the process. I’m also debunk a lot of the propaganda out there. It’s important to know what’s REALLY happening in the world today. This has all been predicted and we know how it’s going to play out. Getting to the real truth, based on history, is what I do, inside the market and out.

To sign up, visit my new site here.
All the Same Market.
I’ve been mentioning for months now that the entire market is moving as one entity, the “all the same market” scenario, a phrase that Robert Prechter coined many years ago, when he projected the upcoming crash.
We’re in the midst of deleveraging the enormous debt around the world. Central banks are losing the control they had and we’re slowly sinking into deflation world-wide, with Europe in the lead.
The US dollar is fully in charge of both the equities and currencies markets. They’re all moving in tandem, as I’ve been saying since September of 2017. Over the past three years, their movements have been moving closer and closer together and one, and now they’re in lock-step, with the major turns happening at about the same time.
it’s challenging because often times currency pairs are waiting for equities to turn, and other times, it’s the opposite. The other frustrating thing is that in between the major turns, there are no major trades; they’re all, for the most part day-trades. That’s certainly the case in corrections, where you very often have several possible targets for the end of the correction.
We’re now close to a turn in the US indices, currency pairs, oil, and even gold. Elliott wave does not have a reliable timing aspect, but it looks like we should see a top very soon.
_________________________________
Couldn’t be happier … KK 2
Couldn’t be happier …The analysis and insight you provide is simply amazing! I’ve been trading the futures and equity markets for well over thirty years and usually average around 5% monthly. Since joining your Traders Gold Service two months ago, that number has better than doubled. I couldn’t be happier.—KK |
Have not had a losing week RW 2
Have not had a losing week …I have been with Peter almost a year. The only thing that matters is have I made money with his service. I think I have finally turned the corner using Peter’s EW. I have not had a losing week in the last 5 months. Thanks Peter, for your amazing amount of hard work. —RW |
A true expert in Elliott Wave FL 2
A true expert in Elliott Wave …You are a true expert in EW analysis. What you provide is not available anywhere and is priceless. Subscription on your services is the best thing I have ever done. Many thanks for your effort to make me a better investor. I now have more trust in my investment decisions. I hope you will continue the excellent work! —FL |
Tops in your field DZ 2
Tops in your field …You are tops in your field. Tried to follow Elliot Wave international for years. They were always behind the market. After discovering you, I perceive that you are an expert in reading the waves, which puts you way ahead of the rest of your peers. And you can read the Waves like you are reading tomorrow’s financial section. I pray you stay healthy. —DZ |
The best of them JL 2
The best of them …Last couple of years, I subscribed to several ‘market traders’. You are by far the best of them and the personal contact is awesome. Daily and daily updates are very well written! Besides your expertise in EW, I also like your cycles analysis. Best investment I ever made! —JL |
the real deal SM 2
The real deal …‘Educational, insightful and thorough market analysis for all levels of traders. It’s Elliott Wave at its best….Peter Temple is the real deal’ —SM |
Get an upper hand … JC 2
Get an upper hand in trading …Seeing all the different currency pairs and the wave structures and hearing you explain why this has to do that on a nightly bases gives one a upper hand when trading. Elliott Wave applies to all stock and indices and can be applied to any candlestick chart. If someone ask what you want for Christmas – Tell them a membership to Peter’s “Traders Gold!”—JC |
Rise above the rest … SM 2
Rise above the rest …I have only ever met a few people who, in their chosen fields (astrology, medicine, music, martial arts, technical analysis), rise above all the rest and you are one of them…you have ‘the gift’…and that’s why I’m a Trader’s Gold member. —SM |
US Market Snapshot (based on end-of-week wave structure)
This chart is posted to provide a prediction of future market direction. DO NOT trade based upon the information presented here (certainly NOT from a daily chart).

Above is the daily chart of ES (click to enlarge, as with any of my charts).
ES, the SP500, and DAX are all tracing out ending expanding diagonals. You can see regular ending diagonal patterns in the DOW, NYSE, and Russell 2000.
We're about the start the 5th wave of the ending expanding diagonal. I'm projecting a max target around the 3800 level. It will result in a dramatic turn and a trend change which will take up below the March low.
The C wave of the fourth wave took 3 weeks to trace out, which was much longer than expected and dropped lower than expected. However, none of the diagonals have broken. Diagonals are extremely difficult to trade, for all the reasons I've outlined above. You can trade the fifth wave, but they're often volatile. Best to wait for the top unless you like lots of risk.
Almost all the currency pairs I cover are in possible broadening tops (except USDJPY), as is oil, and DXY. So, we have ending patterns almost right across the board. Now, it's only a matter of time. The US market needs one more high.
___________________________
Summary: It's an exhausted market getting close to a top, which I now think will happen sometime within the next couple of months. The market may top with the announcement of the winner, but if we expect a contested election, it's difficult to say when that will be.
The bigger picture is that the SP500 appears to be in an ending expanding diagonal. Other US market indices have similar patterns. Diagonals are ending patterns and warn of an impending, dramatic trend change after they're complete. This puts us in the final stages of this rally up from March of this year.
The resulting trend change will target an area under 2100 in SPX, and will likely be a combination pattern and, as such, may contain zigzags, flats, and possibly a triangle or ending diagonal at the bottom. However, I'm leaning towards a series of zigzags, which are corrective waves, and will likely come down fast.
Once we've completed the fourth wave down, we'll have a long climb to a final slight new high in a fifth wave of this 500 year cycle top.
______________________________________


