We Wait
Last weekend, it appeared possible that we had a top in place. We’d traced out five waves down from a fifth wave top.
However, it became obvious fairly soon after that a top was indeed NOT in place. On the other hand, it hasn’t been easy figuring out how we were actually going to end this four month, upward correction until about mid-week. The wave structure across a variety of classes has been difficult to decipher.
Sit on your hands long enough and the market will show its cards and give you a tradable setup. Never enter when you “think” you know where its going; enter when it shows you where it’s going.
“Trade what you see, not what you think”
Once the top is in (across multiple asset classes), virtually everything (certainly everything that I cover nightly) is going to turn down together.
The interesting thing about all this is that the US Dollar is in firm control of the entire market. Where it goes, the market goes.
What does that tell us?
Well, it tells us that the Federal Reserve can have some measure of success in moving the market, but since the dollar is traded worldwide, they can’t possibly have a long-term effect. It’s like pouring a gallon of blue into the ocean (the effect doesn’t last long).
The recent action of the US dollar tells us that inflation is on the way out and deflation is about to take over the economy, because the US Dollar is about to continue its path to the upside, which is deflationary.
It also tells us that the market is now moving based on debt, because when the Fed “prints” money (which is never does, in fact), that it’s creating more digital debt. It’s creating this debt with fiat money, which (in terms of value) is worth less per dollar — has less buying power — than money “printed” in the last hundred years. As a result, it will have less effect on the market than it would have had even 20 years ago.

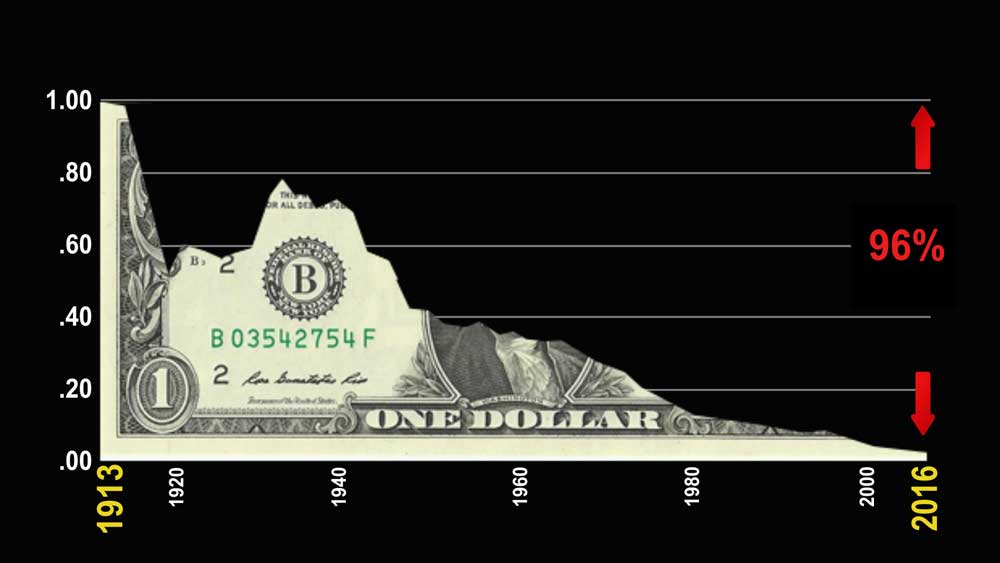
The chart above shows how the value of the US Dollar has been inflated away over the past hundred years. It’s now worth less than four cents comparatively.
In other words, there is no way out of the current predicament. Central banks have, over time, stripped your money of its value (a dollar is now worth less that four cents compared to a hundred cents a hundred years ago). Money today is practically worthless relative to when it was created.
And now central banks want to strip you of printed money, so that they can play only in the digital world, a world in which they can manipulate money at will and charge you for every transaction you make.
Money will no longer belong to you (money was originally developed as a means for people to transact with each other — it belonged to “the people.”) Central bankers tried this experiment in Europe; Europe is deeply in debt and failing badly.
The attempt at a “New World Order” (which is what globalists call it) will fail. Banks hate deflation, which is inevitable, as it increases the size of the debt, often exponentially. It makes debt impossible to pay off in tomorrow’s money, because in a deflationary environment, money gradually gets destroyed and there’s less of it. The value of the dollar increases, but there’s less money in the economy.
It’s often a tough concept to understand because governments make sure this isn’t part of the school curriculum! I explain all of this in detail in Thrive Academy.
With digital money, you have less control of your future, because banks can shut down access to it in an instant. With real money in a safe, you have total control. Keep this in mind as we move forward.
By law, once you put money in a bank, it belongs to the bank (with a promise to pay it back, if available). You’re actually investing in that business! That business is all about speculating in the market (real estate, stocks, government debt, etc.) with your money.
As in any gambling, the “house” has the advantage. It’s a game you can’t possibly win.
So, I tell people that in this shaky environment, you’re best to keep in a bank just the money you need to do digital transactions. Why would you keep any more in a bank? They pay virtually nothing in interest for its use and it’s the riskiest environment there is in a deflationary environment, where mortgages are failing left and right.
Investor beware!
Know the Past. See the Future
_______________________
Want some truth?
My new site and discount for monthly articles and video on how to stay healthy and wealthy over the next five years is now live. Getting to the real truth, based on history, is what I do, inside the market and out.

To sign up, visit my new site here.
All the Same Market.
I’ve been mentioning for months now that the entire market is moving as one entity, the “all the same market” scenario, a phrase that Robert Prechter coined many years ago, when he projected the upcoming crash.
We’re in the midst of deleveraging the enormous debt around the world. Central banks are losing the control they had and we’re slowly sinking into deflation world-wide, with Europe in the lead.
The US dollar is fully in charge of both the equities and currencies markets. They’re all moving in tandem, as I’ve been saying since September of 2017. Over the past three years, their movements have been moving closer and closer together and one, and now they’re in lock-step, with the major turns happening at about the same time.
it’s challenging because often times currency pairs are waiting for equities to turn, and other times, it’s the opposite. The other frustrating thing is that in between the major turns, there are no major trades; they’re all, for the most part day-trades. That’s certainly the case in corrections, where you very often have several possible targets for the end of the correction.
We’re now close to a turn in the US indices, currency pairs, oil, and even gold. Elliott wave does not have a reliable timing aspect, but it looks like we should see a top very soon.
_________________________________
Elliott Wave Basics
Here is a page dedicated to a relatively basic description of the Elliott Wave Principle. You’ll also find a link to the book by Bob Prechter and A. J. Frost.
______________________________
US Market Snapshot (based on end-of-week wave structure)
This chart is posted to provide a prediction of future market direction. DO NOT trade based upon the information presented here (certainly NOT from a daily chart).

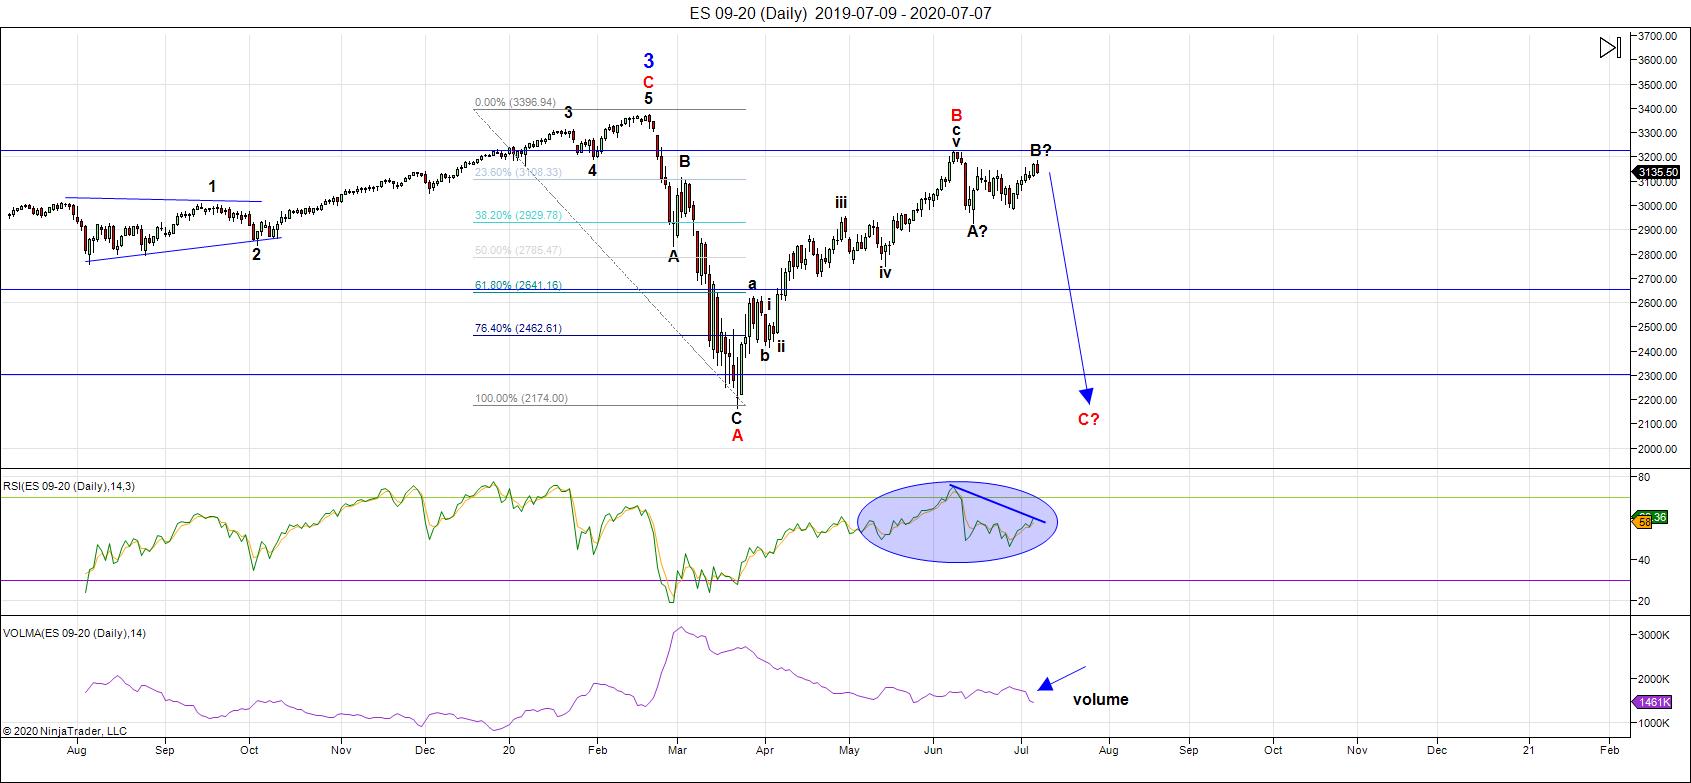
Above is the daily chart of ES (click to enlarge, as with any of my charts).
This week, the rally in ES continued, as expected, but rather than getting a trend change, the market slowed to a crawl. Summer doldrums have indeed locked in. But, that doesn't mean we won't turn down, as expected.
On Thursday, I was already predicting we might run through the weekend.
The US Dollar is still running the show, as far as I'm concerned, and when we get this trend change, absolutely everything is going to turn together. Some stocks have already turned down, while USDCAD appears to have already turned to the upside. The signs of an impending turn are there.
We're going to see international exchanges turn, currency pairs turn, oil, the metals ... but I don't see bonds as part of that mix.
All the assets I cover on a daily basis are sitting very close to targets. It's a case of the market deciding when everything is in place, and that will be soon. Until then, we wait patiently.
As I've said over and over: There's a lot of manipulation going on (the Federal Reserve is doing whatever it can to prop up the market with more debt) — a very stupid idea, and you and I will pay for it in the end. Inflation through the extraordinary "printing" of debt has had its affect on the market overall for a very long time. However, the problem is simply too humongous (the dollar is a worldwide phenomenon) and the Fed will fail. We're getting close to seeing the result, which will be spiralling deflation.
___________________________
Summary: We appear to be in a "combination" fourth wave down from the 3400 area. We have an A wave down in place from 3400, a B wave up almost to that same level, and now we're expecting the long-awaited C wave to unfold.
We have divergence in the waves up across the US indices, and we're waiting for a test of the highs in ES. We should see a sudden turn very soon, but the market has slowed to a crawl, so we wait it out.
The balance of the drop from February should be a combination pattern and, as such, may contain zigzags, flats, and possibly a triangle or ending diagonal at the bottom.
Look for a new low below 2100: There are several possible measured objectives below that point.
Once we've completed the fourth wave down, we'll have a long climb to a final slight new high in a fifth wave of this 500 year cycle top.
______________________________
Trader's Gold Subscribers get a comprehensive view of the market, including hourly (and even smaller timeframes, when appropriate) on a daily basis. They also receive updates through the comments area. I provide only the daily timeframe for the free blog, as a "snapshot" of where the market currently trades and the next move on a weekly basis.
I do a nightly video on the US indices, USD Index (and related currency pairs), gold, silver, and oil) right down to hourly charts (and even 5 minutes, when required).
______________________________________


