
 History Repeating
Corruption and Censorship are always prevalent at warm/dry climate highs like we have right now. We’re on the cusp of a turn down into colder weather. In fact, astrophysicists are expecting another mini ice age, like the Maunder minimum.
Of course, I am, too. I’ve been predicting it for the past ten years. Dr. Raymond H. Wheeler, Ph.D called for a high around the year 2000 and a turn down into at least a 500 year cold/dry climate minimum. History and climate repeat — and they follow each other.
A turn from warm climate to cold always spells the end of the current empire of the day; obviously the American Empire. The centre of power then moves from the West to the East, but over a couple of hundred years. This is why you’re seeing the attention being paid to China. It’s inevitable that the power will shift in that direction; history demands it.
The climate warm highs have historically also meant that corruption and censorship are at a high. That’s somewhat of a misnomer. Corruption has been going on around the world for the past hundred years. What these cycle highs bring about is transparency; the truth always comes out.
Censorship is about the cover up. Governments are broke, they’re scared, and they’ll do what they’re told when faced with the prospect of no more money. These revolutions are always about money and power. This time is no exception.
Here’s an article by Mathew Ehret of the Strategic Culture Foundation on the importance of the November election: Will a Military Coup Undo the November Elections, Donald Trump and the Republic Itself?
The threat to the USA and the rest of the world is much larger than a coup. This is an important video from Australia’s Sky News on the World Economic Forum presentation. They “get it.”
These are the oligarchs who want to take over the world, turn it socialist, and green, and destroy democracy and capitalism. I rate it as a D-level James Bond Movie, except that’s it’s real.

If they have their way, you won’t have yours. Your life will change forever.
Mother Nature is going to have something to say about that. There was similar attempts to undermine the US government in the 1930s, when it was again warm and dry. Remember the dust bowls of the dirty 30s?
In any case, the level of corruption coming out is reaching unheard of heights. At the same time, there’s a concerted effort by the elite (the corrupt) to maintain their way of life and they can only do that by covering up the truth.
The tech giants (Facebook, Google, and Twitter) will do everything in their power to make sure that happens — the truth tellers are “taken down.” That became apparent with the attempt to bar the New York Post and the recent story on Biden’s follies. What they don’t realize is that the internet is far stronger than they are.
It’s interesting that the printing press came out in the 14th century and contributed greatly to the end of feudalism and Divine Monarchy. The same thing will happen here. No sooner did they ban the Biden story than the Streisand Effect took place. The story took on added weight and ended up being “everywhere.”
Tonight, as I write this, Twitter has still not reinstated the New York Post’s account. On deck is that fact that all three tech giants have agreed to attend a hearing of the Senate Commerce Committee. The Senate is getting serious about limiting the protection of the 230 rule that lets these giants hide from litigation. It appears to be a non-partisan issue.
This past weekend, Youtube took down quite a number of accounts whose only error is in the fact that they told the truth.
You need to be concerned about the attempt to end freedom of speech. This was attempted at the top of the British Empire and at the top of the Roman Empire. Eventually, the population rises up against the government. The French Revolution was a good lesson in how to end tyranny.
There’s going to be a showdown on multiple levels.
Curve Balls in the Market
Analyzing this market over the past few months has been a gargantuan task! We’ve never seen anything like this market, where there are so many ending diagonals and triangles, and all asset classes seem to be moving with the US dollar.
The curve ball this weekend is that, after working through everything yet again, new, larger patterns are emerging. The short of it is that we seem to have an ending diagonal formed in the NYSE. I also now see a potential ending expanding diagonal forming in the SP500.
Remember, we’ve been looking at an ending expanding diagonal in DAX now for months, so this, in some respects, isn’t a “bombshell announcement,” to use a favourite term of the main stream media.
If we have them in SPX and the DOW, there’s good news and bad news:
- The bad news is that the final wave structure going forward may be just as tricky to navigate as it has been for the last few months.
- The good news is that it will give us target highs for the market, because ending diagonals have specific targets for the fifth wave, and ending expanding diagonals don’t exceed their upper trendlines (in a bull market).
However, I need to see what happens the next few days in order to confirm these patterns. Friday end of day gave me a hint, and led to the discovery of the ending diagonal in NYSE. It was after that discovery that the ending expanding diagonal in SP500 became obvious. When I checked the DOW, it, too, had traced out an ending diagonal.
I’ve been expecting an ending diagonal at some point (and hoping for one for the reason that they “cap” the final wave with a finite maximum target). It makes sense that we’re in one logically, because oil is in a triangle, as is AUDUSD (I think), EURUSD, USDCAD, and DXY itself. So, is DAX, of course, which we’ve known for almost two months. They’re all moving more or less in lock-step.
Ending diagonals are difficult to call and, according to “The Elliott Wave Principle” shouldn’t be called until the fourth wave is in place because they’re so rare. In this market, they haven’t been all that rare, but you still want to wait until other options are exhausted before settling on them as the answer.
In this situation, they’re all over the place and well supported by action in other asset classes.
___________________________
AAPL — This Weekend
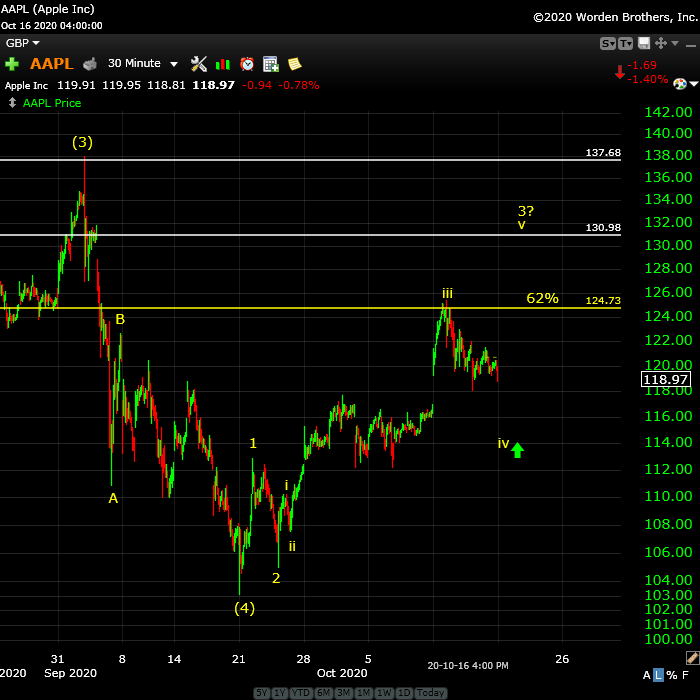
Above is 30 minute chart of AAPL showing us the setup at the end of the day on Friday.
Last weekend, I posted this chart mostly because AAPL looked so weak compared to the SP500. It still does. With SPX almost at a new high, you can start to see the relative weakness in some of the tech stocks. AAPL is on the Nasdaq exchange, but NDX, which is the most watched Nasdaq index, is in about the same relative position as NDX, almost at a new high (in terms of its fifth subwave.
I’m not sure whether AAPL has finished its third wave or not; it doesn’t measure correctly (it’s too short), but if we see more weakness early in the week and develop a full fourth wave down, then it’s entirely possible we only have the fifth wave up to go. The action over the first half of the week should confirm the count.
IWM (Russell 2000)— This Weekend
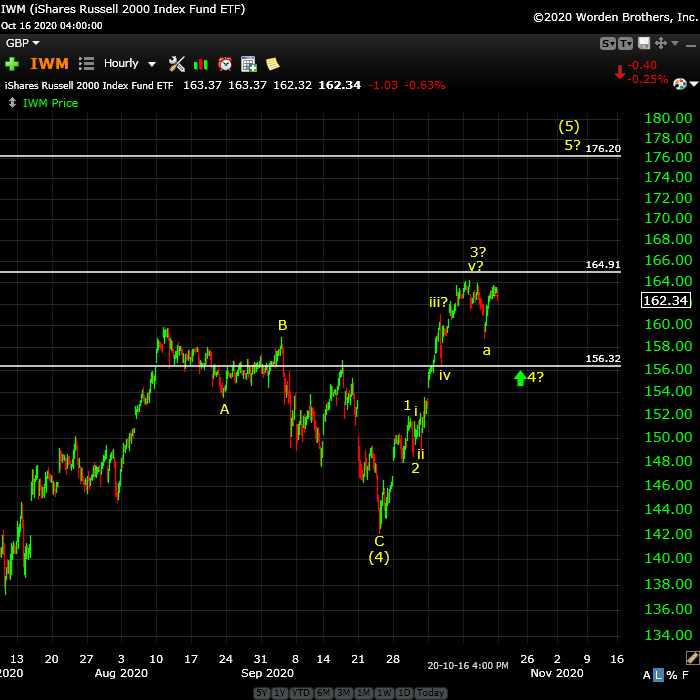
Above is the 1 hour chart of IWM (the Russell 2000) showing us the fifth wave up before a large trend change to the downside.
Note that this extraordinary bullish fifth wave up is missing a valid second wave, similar to what we saw in SPX. However, it’s not in a similar ending diagonal. It looks like we’ll complete a motive set of five wave up to a final high.
Currently we seem to be in a fourth wave. If that’s the case, I expect weakness early this week and perhaps a drop to the 38% level around 156. Then we’d be looking for a final fifth wave up to a new high and beyond.
The final fifth wave is typically 1.618 times the length of the first wave (marked with a yellow 1), but when you have a third wave that is twice the usual extended length, the final wave is usually double the usual length, too, at 2.618 times wave one. That target is 173 (and change), which will take this index to all all time new high. I expect a trend change when it reaches the target.
NYSE – Ending Diagonal
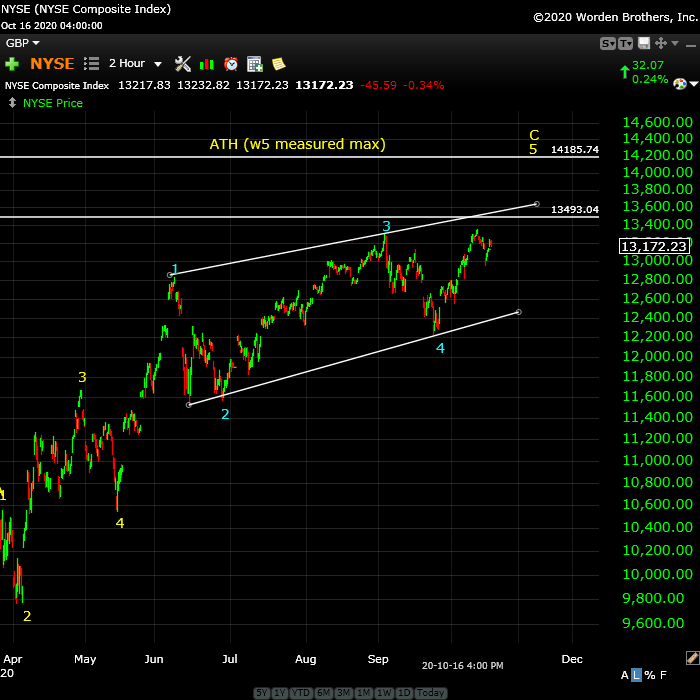
Above is 2 hour chart of NYSE showing us a very large ending diagonal.
What’s extraordinary about this wave is that the entire wave up is corrective. On the left of the chart, you can barely see the top of the first wave up, which overlaps wave four. That’s the sign of a corrective wave. So, on the NYSE side, all the waves up in the sub-indices can be counted as corrective, something I’ve maintained from the start of the wave up in March.
The blue 1 wave up is corrective, which is needs to be to support the ending diagonal pattern. All the waves within the ending diagonal are also corrective. We are currently at the top of the A wave of the fifth wave of the ending diagonal. I’m expecting a B wave down over the next few days and then a large C wave up to likely the maximum target, which is an all time new high around the 13,500 level.
DOW – Ending Diagonal
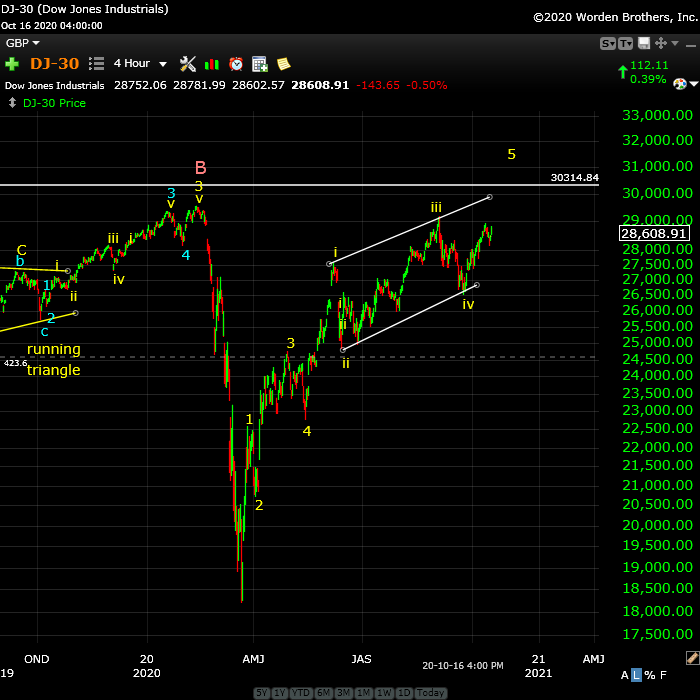
Above is 4 hour chart of the DOW showing us the partially formed ending diagonal.
The is a more textbook version of an ending diagonal, particularly in terms of the third wave, which I like to see as a clear ABC wave. My comments in general here match that of the NYSE and SP500.
Know the Past. See the Future
_______________________
Free Webinar Playback: Elliott Wave Basics
 If you’re new to the Elliott Wave Principle, or even fairly comfortable with it, this webinar will give you a solid introduction and comprehensive understanding of the difference between trending and counter-trend waves, the various patterns for both types of wave patterns, and a good overview of how fibonacci ratios determine trade targets.
This is link to the YouTube playback video, allowing you to review, stop and start, etc.
____________________________
Want some truth?
My new site now has several extensive newsletters in place. Videos now explain the banking system and deflation, and I’ve provided lists of what to do and what the start collecting in preparation for the eventual downturn, which will last for decades. The focus of my new site is now to retain your wealth, plan for deflationary times, and stay healthy in the process. I’m also debunk a lot of the propaganda out there. It’s important to know what’s REALLY happening in the world today. This has all been predicted and we know how it’s going to play out. Getting to the real truth, based on history, is what I do, inside the market and out.

To sign up, visit my new site here.
All the Same Market.
I’ve been mentioning for months now that the entire market is moving as one entity, the “all the same market” scenario, a phrase that Robert Prechter coined many years ago, when he projected the upcoming crash.
We’re in the midst of deleveraging the enormous debt around the world. Central banks are losing the control they had and we’re slowly sinking into deflation world-wide, with Europe in the lead.
The US dollar is fully in charge of both the equities and currencies markets. They’re all moving in tandem, as I’ve been saying since September of 2017. Over the past three years, their movements have been moving closer and closer together and one, and now they’re in lock-step, with the major turns happening at about the same time.
it’s challenging because often times currency pairs are waiting for equities to turn, and other times, it’s the opposite. The other frustrating thing is that in between the major turns, there are no major trades; they’re all, for the most part day-trades. That’s certainly the case in corrections, where you very often have several possible targets for the end of the correction.
We’re now close to a turn in the US indices, currency pairs, oil, and even gold. Elliott wave does not have a reliable timing aspect, but it looks like we should see a top very soon.
_________________________________
the real deal SM 2
The real deal …‘Educational, insightful and thorough market analysis for all levels of traders. It’s Elliott Wave at its best….Peter Temple is the real deal’ —SM |
Rise above the rest … SM 2
Rise above the rest …I have only ever met a few people who, in their chosen fields (astrology, medicine, music, martial arts, technical analysis), rise above all the rest and you are one of them…you have ‘the gift’…and that’s why I’m a Trader’s Gold member. —SM |
A true expert in Elliott Wave FL 2
A true expert in Elliott Wave …You are a true expert in EW analysis. What you provide is not available anywhere and is priceless. Subscription on your services is the best thing I have ever done. Many thanks for your effort to make me a better investor. I now have more trust in my investment decisions. I hope you will continue the excellent work! —FL |
Have not had a losing week RW 2
Have not had a losing week …I have been with Peter almost a year. The only thing that matters is have I made money with his service. I think I have finally turned the corner using Peter’s EW. I have not had a losing week in the last 5 months. Thanks Peter, for your amazing amount of hard work. —RW |
Couldn’t be happier … KK 2
Couldn’t be happier …The analysis and insight you provide is simply amazing! I’ve been trading the futures and equity markets for well over thirty years and usually average around 5% monthly. Since joining your Traders Gold Service two months ago, that number has better than doubled. I couldn’t be happier.—KK |
The best of them JL 2
The best of them …Last couple of years, I subscribed to several ‘market traders’. You are by far the best of them and the personal contact is awesome. Daily and daily updates are very well written! Besides your expertise in EW, I also like your cycles analysis. Best investment I ever made! —JL |
Tops in your field DZ 2
Tops in your field …You are tops in your field. Tried to follow Elliot Wave international for years. They were always behind the market. After discovering you, I perceive that you are an expert in reading the waves, which puts you way ahead of the rest of your peers. And you can read the Waves like you are reading tomorrow’s financial section. I pray you stay healthy. —DZ |
Get an upper hand … JC 2
Get an upper hand in trading …Seeing all the different currency pairs and the wave structures and hearing you explain why this has to do that on a nightly bases gives one a upper hand when trading. Elliott Wave applies to all stock and indices and can be applied to any candlestick chart. If someone ask what you want for Christmas – Tell them a membership to Peter’s “Traders Gold!”—JC |
US Market Snapshot (based on end-of-week wave structure)
This chart is posted to provide a prediction of future market direction. DO NOT trade based upon the information presented here (certainly NOT from a daily chart).

Above is the daily chart of ES (click to enlarge, as with any of my charts).
I've re-labelled this chart to make it a bit easier to see the ending expanding diagonal that has appeared here and in the DAX exchange.
You can see similar patterns in the DOW and NYSE.
If this is correct, expect a B wave down in the current 5th wave and then a C wave up to a new high above the upper trendline of the ending diagonal. I'm projecting a max target around the 3800 level.
It's difficult to provide a target for the bottom of the B wave because fibonacci measurements don't work well inside ending diagonals. You also don't really know you've got one until the fourth wave is in place, because is must overlap the first wave of the ending diagonal.
I've reverted to a different chart this week as, on some charts, the overlap is very slight (having to do with the changes in relationship of futures to cash every three months, I suspect). In any case, they all the charts I've checked seem to easily show the overlap.
We also have diagonals now in NYSE, the DOW, the SP500 and the DAX (the latter, we've known about for a couple of months.
Almost all the currency pairs I cover are in possible broadening top (except USDJPY), as is oil, and DXY. So, we have ending patterns almost right across the board. Now, it's only a matter of time. The US market needs one more high.
___________________________
Summary: It's an exhausted market getting close to a top, which I now think will coincide with the US election.
The bigger picture is that the SP500 appears to be in an ending expanding diagonal. Other US market indices have similar patterns. Diagonals are ending patterns and warn of an impending, dramatic trend change after they're complete. This puts us in the final stages of this rally up from March of this year.
I'm expecting a final high before we have major turn down.
The coming descent should be a fourth similar to the previous one, with a target under 2100 in SPX, and will likely be a combination pattern and, as such, may contain zigzags, flats, and possibly a triangle or ending diagonal at the bottom. However, I lean towards another series of zigzags, which are corrective waves.
Once we've completed the fourth wave down, we'll have a long climb to a final slight new high in a fifth wave of this 500 year cycle top.
______________________________________


