
 Corrective Surprises
The takeaway from this past couple of weeks is that fact that the fifth wave up didn’t have a valid second wave in the usual, expected location.
You can see this in the chart of IWM (the Russell 2000) that I’ve posted below.
It was the same in the SP500 and in futures. The second wave is a critical marker in set of five waves so that you know you’ve completed the first wave and are entering the third wave. It’s important, of course, because in a bull market, the bottom of the second wave is the preferred Elliott Wave long entry. Without it, you’re confidence in where you are in the wave pattern takes a “big hit.”
The first wave is always the uncertain one, particularly in a corrective market, which is what we’re in. You never really know you’re in a first wave until it’s complete, but once it’s in place, all the other waves in the pattern will have a fibonacci relationship to it. This is particularly true in an impulsive pattern. However, in a corrective, five wave pattern, it’s a bit trickier, and, as a result, the second wave carries greater importance.
With this fifth wave up from the 3200 level, all we have is a tiny first wave, followed by an extraordinarily long third wave, which is 4.236 times that first wave. I’ve only seen this pattern a couple of times before. Now, you know it exists.
The problem is, it’s so rare, you tend to discount it, It primarily occurs in really bullish, larger third waves (which we’re in), but not usually in corrective waves, which we’re also in (the wave up from 2009 in the SP500 is corrective).
The bigger picture is that we’re currently in a very large fourth wave that began in January, 2018 (NYSE at 13,637) when we hit the top of a third wave; we’ve been in what appears to be a broadening top formation ever since. Fourth waves are the toughest of all Elliott Wave patterns to trade because almost all the waves within it are corrective, and the internal waves are unpredictable beforehand (but tend to trace out in prescribed patterns — triangle, zigzags, flats, or ending diagonals — once you know the pattern, you can predict the outcome).
Corrective waves themselves do not conform to the most basic of Elliott Wave patterns — the impulsive wave (which hits targets like a Swiss clock announces the time — very accurately).
As of the end of the day Friday, we have the remainder of the third wave to trace out, a high probability fourth wave down to trade, and then, most probably, either a fourth wave contracting triangle or fifth wave ending diagonal (both mostly sideways) to negotiate. I’m still expecting a top at the election.
The current measurements predict a top of the third wave in ES at 3521 (10 points higher in cash). If that comes to fruition, the fourth wave will be a “given.” After that, we’re likely to have a sideways pattern with final spike to a new high at the election on November 3. This is speculative, but logically, it seems to bear the most credence, given our current position across all markets, both domestically and internationally.
___________________________
AAPL — This Weekend
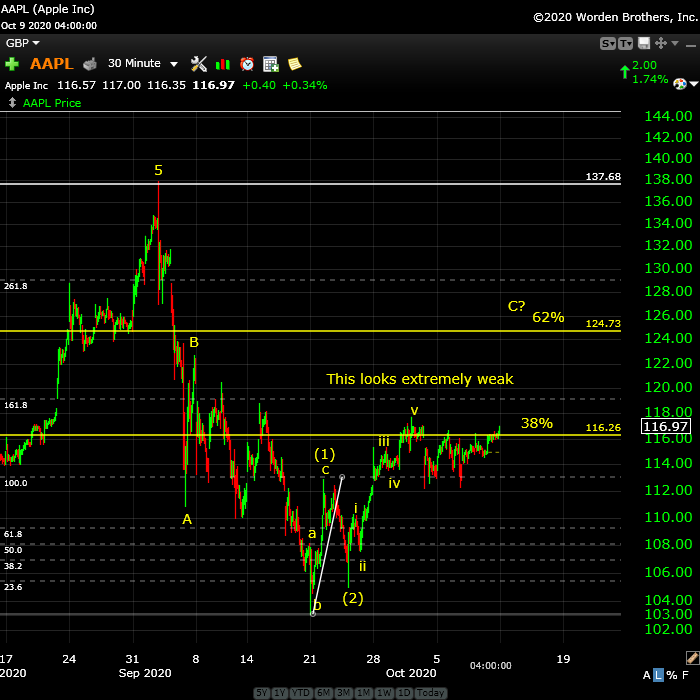
Above is 30 minute chart of AAPL showing us the setup at the end of the day on Friday.
With SPX up above the 62% retrace level, you can start to see the weakness in some of the tech stocks. AAPL is on the Nasdaq exchange, but NDX, which is the most watched Nasdaq index, is also at the 62% retrace level, while Apple is only at the 38% level.
We’ve expecting an ABC wave down once the indices (i.e., SP500) reach a new all-time high. With Apple, it’s certainly possible that we already have an A wave down and are in the B wave, with a final target of the 62% level.
IWM (Russell 2000)— This Weekend
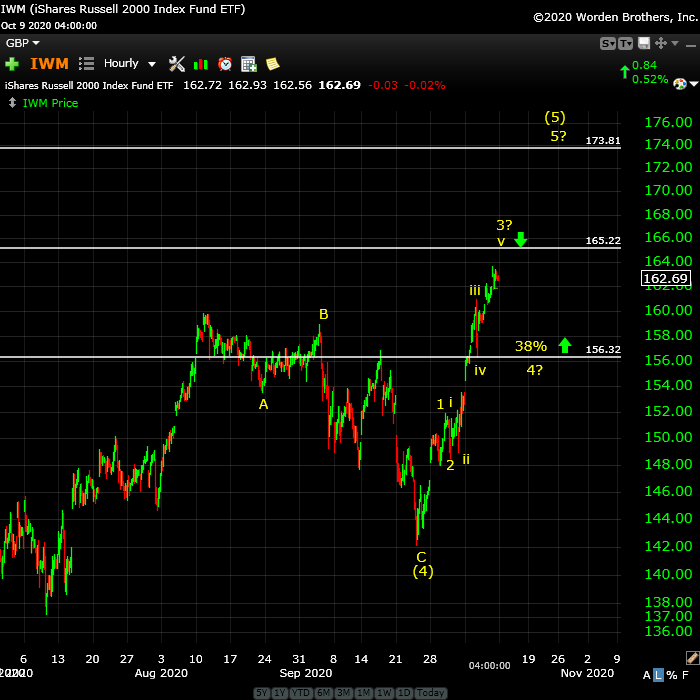
Above is the 1 hour chart of IWM (the Russell 2000) showing us the fifth wave up before a large trend change to the downside.
Note that this extraordinary bullish fifth wave up is missing a valid second wave. I’ve marked one, but’s it’s simply too short: It didn’t even retrace 38% of the first five waves up, which would be a minimum requirement to even consider labelling a retrace wave a second wave. The same phenomenon is present in the SP500.
Presently, we’re completing the third wave of the fifth; it has a target of 165 roughly and will likely make that target in the first half of the coming week. Then I expect a fourth wave down.
Fourth waves typically retrace 38% of the entire fifth wave. In that case, the target for the bottom of the fourth wave is 156.00.
The final fifth wave is typically 1.618 times the length of the first wave (marked with a yellow 1), but when you have a third wave that is twice the usual extended length, the final wave is usually double the usual length, too, at 2.618 times a wave one. That target is 173 (and change), which will take this index to all all time new high. I expect a trend change when it reaches the target.
NDX — Big Picture
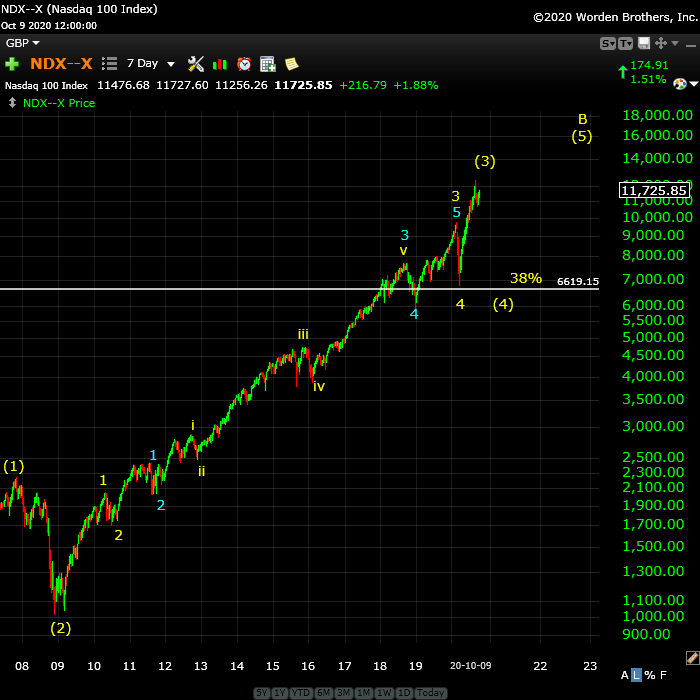
Above is 7 day chart of NDX showing us the third wave up from the 2009 low.
I haven’t posted this chart recently, partly because it hasn’t changed appreciably. I put us at the top of the third wave in NDX (yellow circle 3), with a large fourth wave down to come after the Nov. 3 election, and a final fifth wave up to a new high next year. That will end the 500 year bull market trend.
Know the Past. See the Future
_______________________
Free Webinar Playback: Elliott Wave Basics
 If you’re new to the Elliott Wave Principle, or even fairly comfortable with it, this webinar will give you a solid introduction and comprehensive understanding of the difference between trending and counter-trend waves, the various patterns for both types of wave patterns, and a good overview of how fibonacci ratios determine trade targets.
This is link to the YouTube playback video, allowing you to review, stop and start, etc.
____________________________
Want some truth?
My new site now has several extensive newsletters in place. Videos now explain the banking system and deflation, and I’ve provided lists of what to do and what the start collecting in preparation for the eventual downturn, which will last for decades. The focus of my new site is now to retain your wealth, plan for deflationary times, and stay healthy in the process. I’m also debunk a lot of the propaganda out there. It’s important to know what’s REALLY happening in the world today. This has all been predicted and we know how it’s going to play out. Getting to the real truth, based on history, is what I do, inside the market and out.

To sign up, visit my new site here.
All the Same Market.
I’ve been mentioning for months now that the entire market is moving as one entity, the “all the same market” scenario, a phrase that Robert Prechter coined many years ago, when he projected the upcoming crash.
We’re in the midst of deleveraging the enormous debt around the world. Central banks are losing the control they had and we’re slowly sinking into deflation world-wide, with Europe in the lead.
The US dollar is fully in charge of both the equities and currencies markets. They’re all moving in tandem, as I’ve been saying since September of 2017. Over the past three years, their movements have been moving closer and closer together and one, and now they’re in lock-step, with the major turns happening at about the same time.
it’s challenging because often times currency pairs are waiting for equities to turn, and other times, it’s the opposite. The other frustrating thing is that in between the major turns, there are no major trades; they’re all, for the most part day-trades. That’s certainly the case in corrections, where you very often have several possible targets for the end of the correction.
We’re now close to a turn in the US indices, currency pairs, oil, and even gold. Elliott wave does not have a reliable timing aspect, but it looks like we should see a top very soon.
_________________________________
Get an upper hand … JC 2
Get an upper hand in trading …Seeing all the different currency pairs and the wave structures and hearing you explain why this has to do that on a nightly bases gives one a upper hand when trading. Elliott Wave applies to all stock and indices and can be applied to any candlestick chart. If someone ask what you want for Christmas – Tell them a membership to Peter’s “Traders Gold!”—JC |
Couldn’t be happier … KK 2
Couldn’t be happier …The analysis and insight you provide is simply amazing! I’ve been trading the futures and equity markets for well over thirty years and usually average around 5% monthly. Since joining your Traders Gold Service two months ago, that number has better than doubled. I couldn’t be happier.—KK |
Tops in your field DZ 2
Tops in your field …You are tops in your field. Tried to follow Elliot Wave international for years. They were always behind the market. After discovering you, I perceive that you are an expert in reading the waves, which puts you way ahead of the rest of your peers. And you can read the Waves like you are reading tomorrow’s financial section. I pray you stay healthy. —DZ |
Have not had a losing week RW 2
Have not had a losing week …I have been with Peter almost a year. The only thing that matters is have I made money with his service. I think I have finally turned the corner using Peter’s EW. I have not had a losing week in the last 5 months. Thanks Peter, for your amazing amount of hard work. —RW |
the real deal SM 2
The real deal …‘Educational, insightful and thorough market analysis for all levels of traders. It’s Elliott Wave at its best….Peter Temple is the real deal’ —SM |
A true expert in Elliott Wave FL 2
A true expert in Elliott Wave …You are a true expert in EW analysis. What you provide is not available anywhere and is priceless. Subscription on your services is the best thing I have ever done. Many thanks for your effort to make me a better investor. I now have more trust in my investment decisions. I hope you will continue the excellent work! —FL |
Rise above the rest … SM 2
Rise above the rest …I have only ever met a few people who, in their chosen fields (astrology, medicine, music, martial arts, technical analysis), rise above all the rest and you are one of them…you have ‘the gift’…and that’s why I’m a Trader’s Gold member. —SM |
The best of them JL 2
The best of them …Last couple of years, I subscribed to several ‘market traders’. You are by far the best of them and the personal contact is awesome. Daily and daily updates are very well written! Besides your expertise in EW, I also like your cycles analysis. Best investment I ever made! —JL |
US Market Snapshot (based on end-of-week wave structure)
This chart is posted to provide a prediction of future market direction. DO NOT trade based upon the information presented here (certainly NOT from a daily chart).
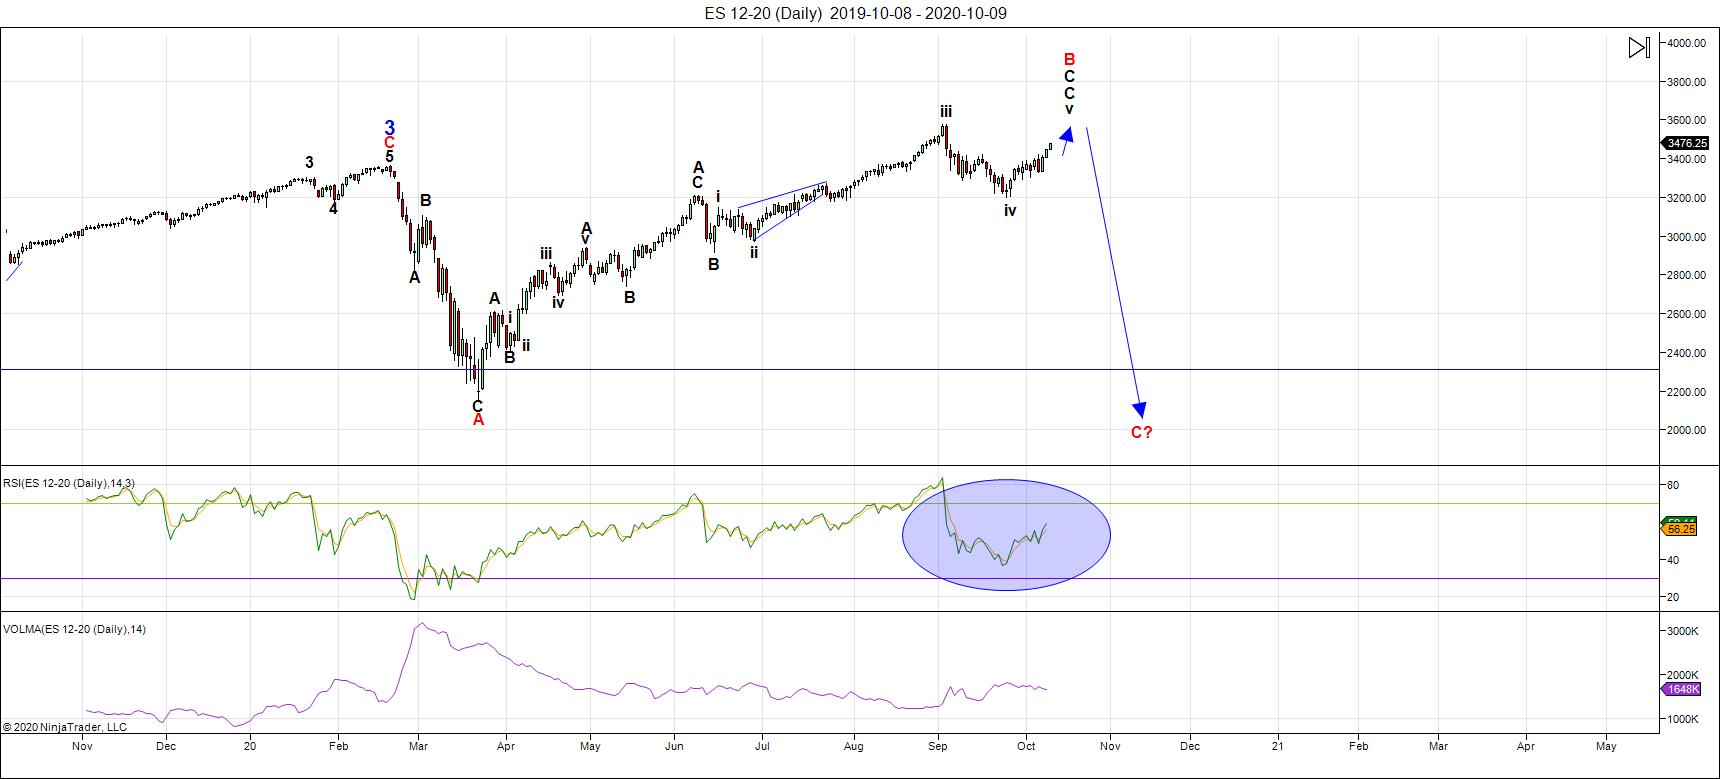
Above is the daily chart of ES (click to enlarge, as with any of my charts).
The blue arrow line down (the red B wave down) denotes that the wave up is corrective and will completely retrace. In fact the entire wave up from 2009 is a corrective B wave. The cycle top, and top of the fifth motive wave, was in 2007.
The final fifth wave up has ended in a very rare pattern, a single wave up, so far, with no second wave. I've only seen a wave like this a couple of times before and they're always difficult to navigate, because the second wave is a major Elliott Wave marker. In fact, it's the preferred entry point for a trade. It's also an important "compass point" that tells you that a first wave is indeed complete, giving you confidence that a third wave is to follow.
In any case, it's clear now that we have a rare patter of a very tiny first wave and a third wave that will be 4.236 times the length of the first wave, when done. We're getting close to that wave three top and I'd expect it in the first half of next week.
After that, we should still get a fourth wave (although, it may or may not be a normal 38% retrace situation.
The fifth wave will be the question, because if this market is going to turn down on November third, then it's logical that we're either going to get a fifth of fifth ending diagonal, or a fourth wave contracting triangle ending is a spike to a new high.
Almost all the currency pairs I cover are in possible broadening top (except USDJPY), as is oil, and DXY. DAX (the German exchange) appears to be in an ending expanding diagonal. So, we have ending patterns almost right across the board. Now, it's only a matter of time. The US market needs one more high.
___________________________
Summary: It's an exhausted market getting close to a top, which I now think will coincide with the US election.
The bigger picture is that the SP500 appears to be in a kind of broadening top formation (not an EW pattern) on a weekly chart. Other US market indices have completely different patterns, which is the sign of a very sick market, and one in the final stages of this 500 year rally, and a corrective B wave up from 2009.
I'm expecting a final high before we have major turn down.
The coming descent should be a fourth similar to the previous one, with a target under 2100 in SPX, and will likely be a combination pattern and, as such, may contain zigzags, flats, and possibly a triangle or ending diagonal at the bottom. However, I lean towards another series of zigzags, which are corrective waves.
Once we've completed the fourth wave down, we'll have a long climb to a final slight new high in a fifth wave of this 500 year cycle top.
_______________________
Trader's Gold Subscribers get a comprehensive view of the market, including hourly (and even smaller timeframes, when appropriate) on a daily basis. They also receive updates through the comments area. I provide only the daily timeframe for the free blog, as a "snapshot" of where the market currently trades and the next move on a weekly basis.
I do a nightly video on the US indices, USD Index (and related currency pairs), gold, silver, and oil) right down to hourly charts (and even 5 minutes, when required).
______________________________________


