Update Wednesday, Jan 27 After the Bell:
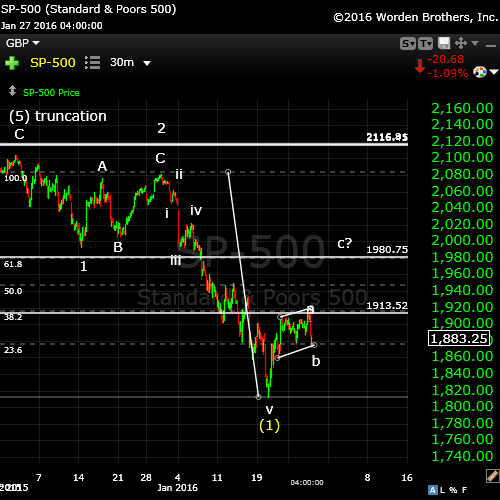
Here’s a 30 minute chart of the SP500 so we can look at what happened today after the FED announcement.
The short story is that we have wave 1 of the third wave down in place. We have a corrective wave continuing to take shape. We’ve completed the a wave (after a lot of up and down action) and today, after the announcement, we completed a more pronounced b wave down and now appear to be reversing up.
If we measure all of wave ‘a’ up and then extrapolate from the bottom of wave ‘b,’ that length again will take us to 1980 in the SP500. That’s an extremely common wave ratio for a corrective second wave. It also happens to be the 62% retracement level from the bottom of wave 1 to the wave top (you’ll see the fib tool on the chart and the horizontal line at the 62% retracement level).
This would be the expected full second wave and lead to the third wave down.
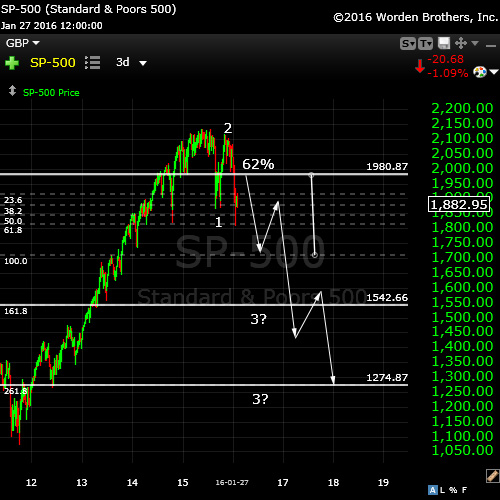
Here’s a 3 day chart of the SP500 so we can look at the expected projection down. I’m feeling comfortable enough now with the unfolding wave count to make this projection of the next wave down. Wave three is typically at least 1.618 X the length wave 1 down and in a bear market of this nature, often extends to 2.618 times the length of wave 1. We’re also looking for a resistance level for it to stop at, as this is usually a requirement to catch a falling knife like this. There is no strong resistance level at the 1.618 ratio point, so my preference is for the lower projection, which could stop at the wave 2 level of the last higher degree wave up.
Wave 3 of three will come down in 5 motive waves and these waves will be in fibonacci ratios, so with some work, we should have a play-by-play assessment of where we are. Wave 2 of three will be a sharp 62% retrace (an abc wave) and we don’t want to get stuck short in that wave.
We wait to see what happens as the current wave 2 up unfolds.
_______________________________________________
Update Tuesday, Jan. 26: How We’re Shaping Up
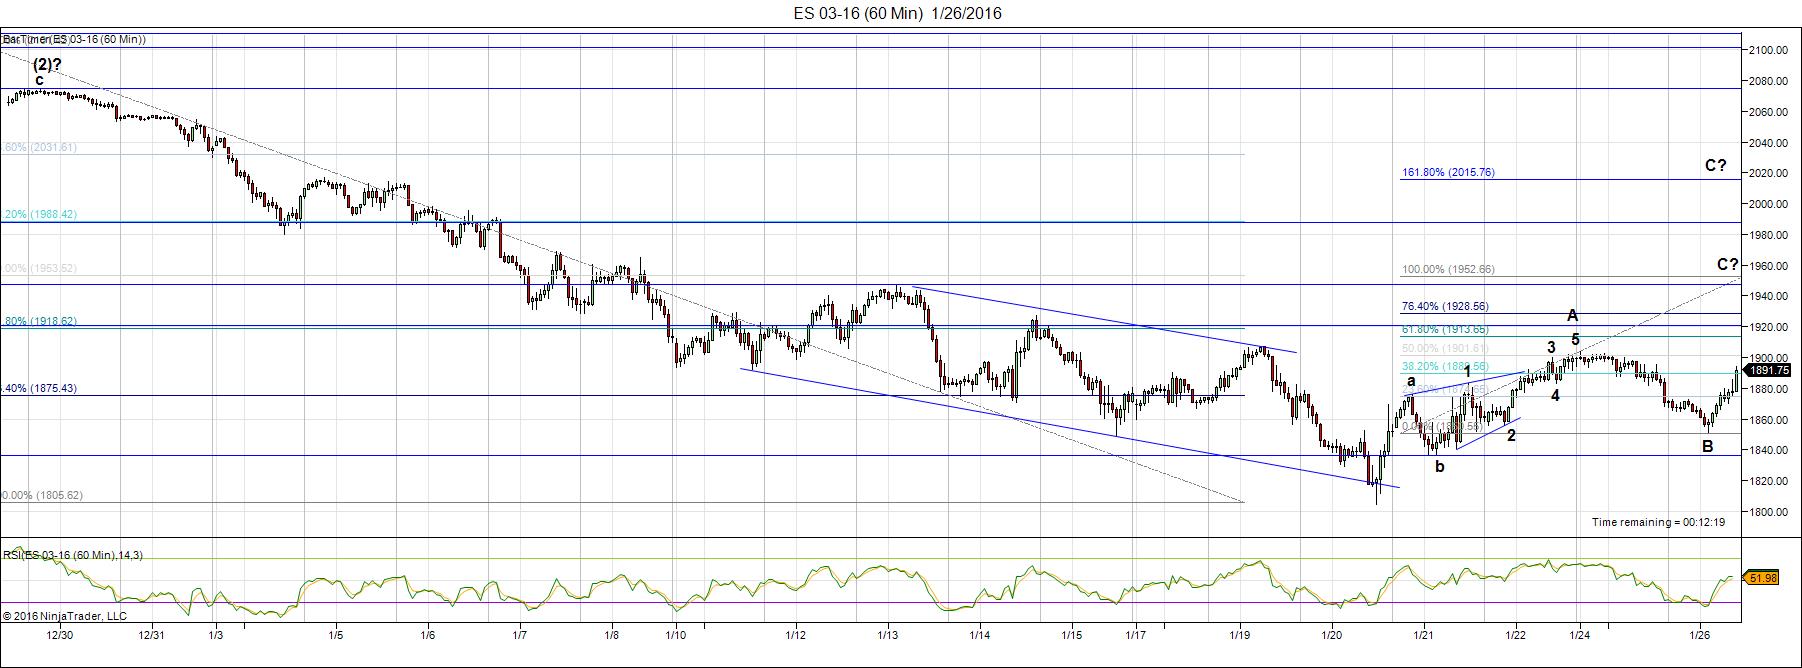
Above is the entire wave down (1 hour chart) from Dec 31 in ES (emini SPX). We’ve now complete the A and B waves of the corrective move up. I’m starting to target upside turnover points more specifically. It’s difficult, as we don’t have a normal wave here (it’s truncated, which is very rare, and so there aren’t any rules for where to measure from).
However the ES gives more clues than the cash indices because of the “full” set of corrective waves up (ES runs around the clock so the waves reflect worldwide sentiment).
In ES, the previous 4th wave (the primary target) is the retrace target at 1947. If wave C traces out to exactly the same length as wave A, it comes to 1950. This area is the most likely target area to me. If we go beyond that level, we are most likely tracing out a full second wave.
My projection is for a fourth wave retrace here and a fifth wave down. My target for a 5th wave down would be about 1626 in ES.

Here’s the 1 hour chart of the SP500. I’ve moved my wave 1 top to December 2, based on a conversation with Wouter (smart guy!) who pointed out that AEX topped on November 27. So did the Nasdaq (Dec 2 specifically) and if you’ll remember my original truncation call, it was with December 2 as a top.
As a result, we have three waves down and require a fifth wave to complete the first motive wave down. This fifth wave, in this instance, will likely be the same length as the first three waves combined. This would give us a downside target of 1620, similar to ES.
The first horizontal line up from the bottom of this chart is at 1950. This is the previous 4th wave and this is my preferred stopping point for this corrective wave. If we exceed that level, we’re likely going to the 62% retrace level. The 38% retrace level (this is a minimum is 1930, or so). That leaves us with a 4th wave retrace range in the SPX of 1930-50.
I will be live on Wednesday/Thursday as I expect this topping process to play out shortly after the Yellen announcement, certainly within the next 48 hours. I will be aggressively short for the fifth wave down. Stick around, it should be fun.
_______________________________
Update Monday, Jan 26:
The B wave in the US indices may or may not be complete (if not complete, it doesn’t have very much lower to go until we see a turn back up). The next major move is up in a C wave. I suspect that we will turn lower at the 38% retracement level, due to the market’s apparent weakness. If that’s the case, we’ll see the fifth wave unfold of this first wave down. The Fed announcement of Wednesday coming is likely to be an upward magnet for the market. Shortly after the announcement, I’d expect a turn down.
All the currencies are doing more or less what was expected. SUD/CAD is in a fourth wave and looks like it will complete the larger 5th wave (2.618 X the first wave) that I mentioned in the video. The eurodollar is completing the E wave of the triangle.
____________________________________
Original Post (Saturday, Jan. 23, 2015):
This is perhaps the most important week of the year (2016). What happens this week will define the path for equities for the next few years. I’ve created a little longer video (15 mins or so) to take you through the SP500, currencies and their relationship to equities, as well as gold and oil. You’ll find some charts below the video.
Events this week: Yellen (US Federal Reserve) announcement 2PM, Wednesday, major cycle turn Jan 27-29.
Market Report for Jan 25 |
____________________________________
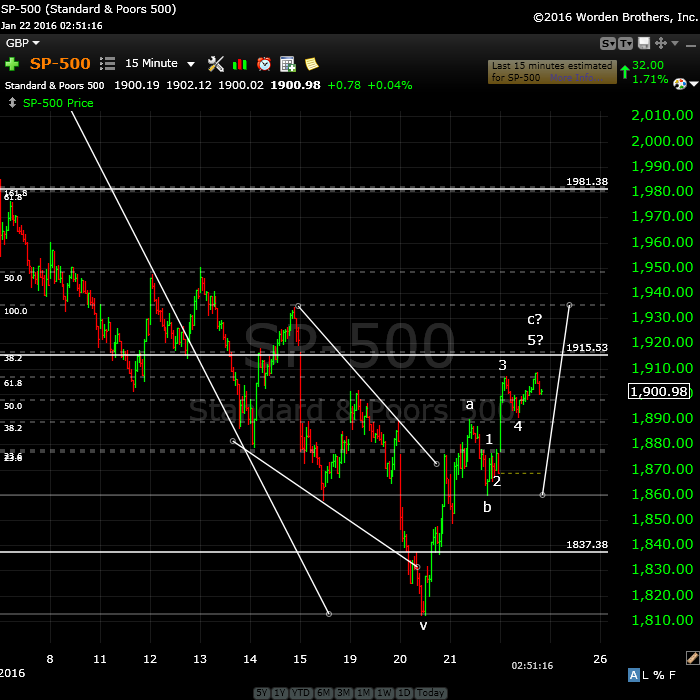
Above is the 15 minute chart of the SP500 as at about 3pm EST, Friday, January 22. You can see the abc corrective wave at an end. We’ve completed the C wave as it’s now in 5 waves. The ES chart is similar and the next move should be down, but not to a new low. We haven’t quite reached the 38% retrace level and this tells me there’s more up in store–how much is the question.
As I mention in the video, we could either do a larger B wave down perhaps 62% of the rise from 1810 or so, and then rise back to either the 1915 level (62%) or shoot up even further to about 1891. The level we rise to will determine the length of the next wave down and even what happens beyond.
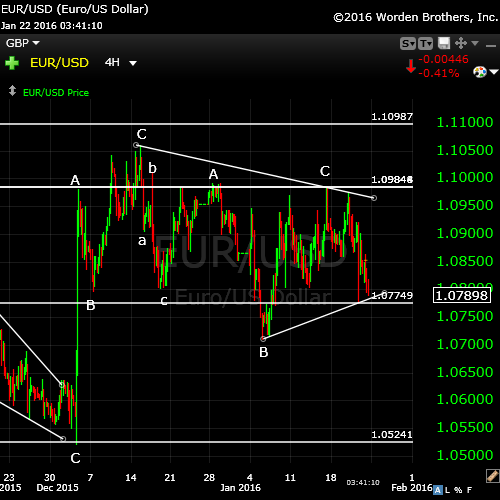
Here’s a chart of the euro/dollar (4 hour) showing the triangle. The euro has been running counter to equities in lock-step pretty much. When it heads down, equities head up. It’s also at an inflection point. I think we’ll head back up starting Sunday (we already did a double bottom and turned at the end of the day Friday.
Longer term, I’ve been expecting it to head down to tag the previous low before heading up in tandem with the rest of the us pair currencies, which have now bottomed (except for the euro).
My operating scenario: that (since this is not a complete triangle–it would need one more leg up) that maybe equities will do a larger B wave down (starting in futures on Sunday) and then will do a larger C wave up (perhaps even to the 62% level) while the euro reverses down to tag the previous low. Remember, they’re close to mirror images of each other.
Speculation, to a point, but based on what I’ve been seeing for a few months now, it seems likely.

Here’s ES at the end of the day (one hour chart). You can see that we’ve completed the a wave (it was in 5 waves up) and then the b wave, along with 5 move waves up of the C wave. After 5 waves, we need a retrace, so we might see another wave down (could go as low as 62% of the distance to the bottom of the b wave) and then the balance of C up. In other words, a double zig zag).
Hard to say how far up we go before a roll-over (either 38 or 62%)–same a equities, of course.
USDCAD
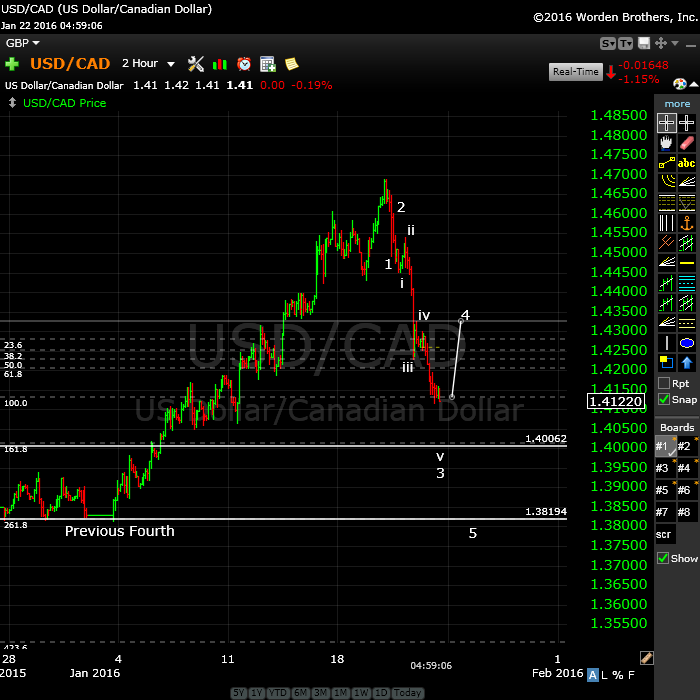
Above is the 2 hour chart of USD/CAD. A lovely motive wave structure, with more still to go. This is how a set of motive waves should look!
Wave 1, as always, sets the tone. Wave i was the same length as wave 1. Wave iii was 1.618 X wave 1 (and i, as they were the same length). Wave v should be 1.618 X wave 1 (or it could extend to 2.618 to meet the previous 4th). Then we’ll have a good sized retrace in wave 4 and finally, wave 5 up to the previous fourth.
Either wave 3 will get us to the previous fourth or wave 5 will–could be either, but you can always tell by the sub-wave structure. Then we’ll have a large retrace 62% (a higher degree wave 2). It’s much more likely wave 5 will get us there.
__________________________________
History: The 1929 crash
I posted the 1929 chart a few months ago and now’s the time to bring it back to the forefront. I would expect a similar path moving forward.
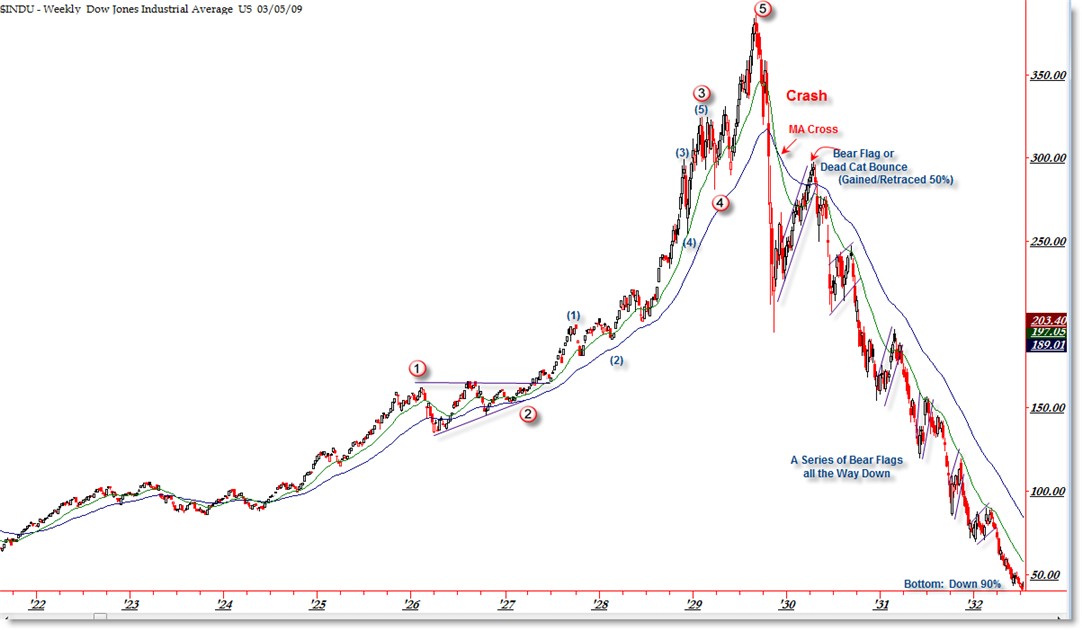
I think it’s important to look at 1929 and the wave structure (above and below), which was the same as 2007—to a point.
The wave structure of the 1929 crash was in 3 waves overall. There were 5 waves down from the top (the A wave) and then a very large B wave retrace. The final C wave down was a stair-step affair and lasted over 2 years.
In our current situation, we’ve had wave one down that’s lasted three months (May, 20, 2015 through Aug. 24). Then we had wave 2 up, which lasted from Aug. 24 through Dec 31, 2015 (approx. 4 months). I would expect the wave 3 sequence down (all the waves—the A wave) to last approx. 3 months. Next is the fourth wave (B wave), which should be at least 6 months, I think and then the final C wave to the bottom, which will likely last a couple of years.
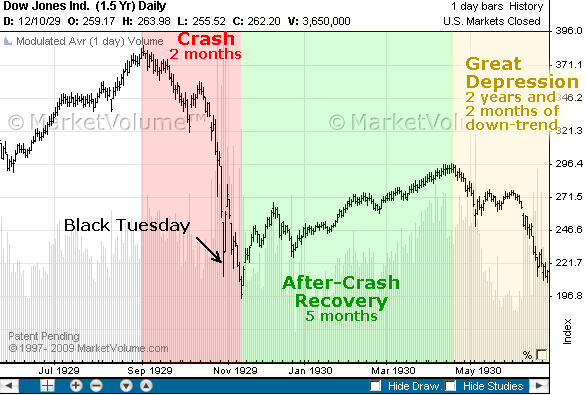
Let’s look a little close at the timing of the 1929 crash because the similarities to today are uncanny.
The market peaked on September 3, 1929 and then it took 2 months for the crash to actually happen (to reach the bottom of wave 5 of the A wave). The larger crash which we always hear about began on October 23, 1929. Then there was that large B wave, which lasted 5 and a half months and finally, the C wave which went on for more than 2 years. This might be the scenario we’re looking at going forward.




From André (posted on previous post today):
The first serious low will be early January 2017. Next week will be down in abc. Then a retrace into 2/7-ish and then down again. I see a very strong date 4/23-26. That will be a low. After that a longer retrace into 8/10-11 before we turn down again heading for 2017. This bearmarket will run into 2020-2021.
This weekend was a major date to test. Even more significant than 12/25. So after this weekend a more convincing downtrend.
I guess this confirms what Peter wrote above.
John
My post the other day was based in variables I’ve seen based on the puetz window .
Taken strictly by puetz and using my observations early feb would be a high
Of sorts ( possible weekly wave 4) then a choppy and sloppy move down into the solar eclipse
March 8 , from the solar eclipse you get a 5 to 10 trading day bounce into the March 23 lunar
Eclipse then a steep decline into 6 days before to 3 days after the full moon that is 6 weeks
After the solar eclipse . That technical back drop fits with Andre’s comments above
As this cycle would end in late April . There are other correlations that also fit with h this scenario .
That all said and why I have 2 counts has to do with the puetz window in August sept last year
Where the dates lined up yet the market did the same exact opposite , look up the late sept 2015
Lunar eclipse and you can see the market rocketed up ( an upward crash ) the key I have noticed
With this cycle is its starting point . In this case it’s feb 3-8th if this forms a low and the market chops
Upwards in a sloppy fashion into March 8 solar eclipse I’d say we are seeing the signs of an inversion
And therefore I’d look for the March 23rd lunar eclipse to be a low of sorts followed by a run higher into
The end of April . It’s to soon to say which is which so I just noted both thoughts .
The cycle ends 6 days before to 3 days after the full moon which is 6 weeks after the solar eclipse .
I forget the exact dates but they fall in the end of April .
A sideways formation is expected as far as I’m concerned do to both set ups .
The rule of alternation would apply to the wave count . Wave 2 was simple so expect wave 4 to be complex .
That could be a triangle or a triple 3 ? Either way it should be complex .
I’m focused more on the weekly bar chart not the daily or intraday.
If I had to chose and was to take the strict bias then late April would be a low .
How ever as I noted prior . We are now at the Jan full moon and Mercury is turning
Direct . Mercury turning direct should normally give a bullish bias since the retro was bearish
It’s not cast in stone but should be allowed for . Lunar eclipses are full moons and Jan 23
Is the full moon . So if we bounce into early February new moon it’s does give a bearish set up
For a crash phase provided that the market chops lower into the solar eclipse on March 8th .
If the market holds up and chops higher into that March 8 solar eclipse then we will most likely
See a low on the March 23 lunar eclipse . Bottom line watch the full moons and new moons
Going forward and see what the market does . The 1 2 I ii set up I mentioned that was watching
For would be the only set up that would imply new highs yet that cannot be called in advance and
Can only be considered when we get closer to March 23 .
I tried to explain myself as b at possible . I’m currently on a tug boat in San Francisco
My big picture view matters for me because I’m not able to see the very short term moves daily .
The puetz window does not always mean crash but it does many times bring strong moves .
The dates do not change .
Sorry if I got long winded Peter
Thanks for your update
Joe
Good update Peter.
Thanks Peter for your update,
CAD, oil and SnP move since few months together in countertrend (not completely but to some degree) to Euro and gold.
And I think it’s easy to understand this correlation.
So, according to your count we should expect them bounce in b-c move up before heading down while Euro and gold may do the opposite.
It seems to me that their counts should generally complete each other.
Peter,
so my question concerns the Eur/Usd.
If you expect that after the b-c bounce the next general move in oil and SnP will continue subdivide down for a long time, in such case Euro should turn up for longterm also.
Otherwise we should suppose the end of carry-trade in Euro at some point.
Dmitri,
This comment is too vague to really answer in a short comment. It depends on what you mean by longer-term. As I said in the video, I expect the eurodollar to turn up while equities head down for this first set of waves … likely until deflation takes over, which I think will be during the larger B wave that will likely last at least half a year.
I haven’t give timeframes for oil–only that it needs to finish up the ending diagonal, and that will likely take it to $10 before it’s over. Gold and oil tend to be inversely correlated, as well. I have a chart somewhere on that.
The thing I didn’t mention in the video or post is that the eurodollar should not go to a new low in the short term. If it does that (or touches the current low), then that creates a higher degree wave down in 3 waves, which should completely retrace … right to the top. So I don’t expect a new low before it turns around and heads up. Short term is up to the top of the triangle, then down to the ending diagonal likely, and then we head up.
Sunday; I feel like contemplating. But I don’t know where to start. There is so much to say, so much to analyze. Let’s just say my own analysis confirms what Peter is saying. In my own words : it will not be the end of the world but we are heading into a massive reset. Or what Shumpeter called ‘creative destruction’. Yesterday I said this bearmarket will run into 2020-2021. But 2025 would be a much more ‘natural’ year.
Before we get there we will have time enough to work out the details.
For now lets focus on the shorter term. There are many reasons why the market needs to make a low by the end of april. But before that feb 22-ish is the most significant low. In March we have the solar eclipse, Pluto and Mars retro and some other proprietary timers. so a pull back into 3/8-15 seems likely before we get into 4/26-ish.
These are just the details in a Multi-year down trend.
Peter has a major timing 1/27-29, But as this is major I think we have a few days either side of this. So I maintain : down into next weekend (strong tidal inversion), then a pull back into the new moon. Then Mercury will be max west and we have the start of a new Mars max cycle. Then we will dive ito 2/22-ish. As a start ;-).
Every weekend I will try to fine-tune the dates that are further down the road.
Cheers, André
THANK you Andre….n
Thank you very much Peter,Joe and André to put so much effort in this Site.
Best regards
John.
André,
I have been diving into my own timing system and improved it a lot the last few months. I can only say: 100% agree on your timing! And about the bearmarket, I see a long bearmarket (at least 3 years) as well.
Cheers,
W
the Wayne Whaley “Turn of the Year” barometer
https://tradetrekker.wordpress.com/
Does not look good>>
I posted a text update at the top of the post.
I’ve posted an update just now with a couple of charts showing my immediate projection for this corrective wave.
Thanks again Peter. Refreshing the site more than ever.
As always I appreciate all comments.
It seems to all be coming together.
R
Thanks, Robert. Once we get this next turn, I’ll be able to be much more accurate. Still working with the truncation and all the uncertainly around it.
AZ flagged a problem posting. I have been working on the forum and have just deactivated it. Let me know if you have a problem posting (it may point to something inherently wrong in the database) and I’d like to go looking for it, if there is).
If you’re having an issue, please email me at peter@worldcyclesinstitute.com
Hi Peter ,
I am no EW expert , however when looking at the S&P chart from 2009 to date , I keep asking myself … what is the possibility that the decline from May 2015 until the low of last week was just an ABC of a big WAVE 4 correction , and then we can start from here the final big WAVE 5 up which will takes us to a new high .
I am sure you had thought of such possibility , but it looks it did not appeal to you .
Of course we have to look at the chart by itself without paying attention to Oil prices , China slower growth , war in Middle East ,..etc
Regards
AZ
AZ,
Hopefully, we have our issue addressed.
After looking at a number of indices, that option just isn’t on the table, particularly when GDOW has done a second wave and turned right at 62% … some time ago (similar to NYSE) and we’ve got the DJ20 absolutely tanking.
There are just too many issues with underlying technicals, as well. It’s an extremely low probability, imho.
Peter
Thanks Peter,
that was the question I also posed to me.
I’ve seen a number of Elliot sites taking this option as primary
AZ,
The other issue, of course, that I keep coming back to is that we have corrective waves up and to get to a new high, you would need motive waves, unless it’s a triangle and I can’t see a triangle on the horizon.
Hi Peter
Nice to know the system is now back working .
Thank you for your reply to my question
Regards
AZ
Hi Peter
Are you a big believer in extended 5th waves ?
I understand the commodity type 5th waves spikes based
On fear . I guess the same can be applied to stock markets
In downtrends yet over the years I’ve thrown out extended
5th waves and called them 3’s .
Looking at long term commodity charts labeling the spikes
As 3 wave moves makes the long sideways trends make
Much more sense .
One issue in regards day to crude oil though is we did
See a 5 wave move off the lows in 1999 . The drop so far
From the $150 high is a 3 wave drop . Wave A also a 3 wave
Move . Wave B a triangle and this C wave now should be basically
Complete . ( a move back to 10 bucks possible but I can’t see it
At this juncture )
My question is : do you believe in extended 5th waves ?
I have seen you post your diagram and assume it’s your
Observation.
If wave 3 is supposed to be the longest and strongest wave
Then how can wave 5 be so out of proportion ?
It’s been an issue I have dealt with for years looking at prechters
Charts .
Joe
Report coming up. Peter are ya still looking at 1950 area?
Good trading
Robert,
If you’re talking about SPX, 1915 is the bare minimum (38%), but I think it’s more likely we see 1950, which is the previous 4th.
Hi Peter,
I have a question is the turn date you mention Jan 28/29 from the market timing report or yours?
I think Februari 3/5 also has a good chance for a turn bradley and Mercury (Jan 6)
John,
It’s from Andy Pancholi’s report and he’s accurate in the 90%+ percentile.
Thanks,
If we are up tommorow in the AEX I will sell my calls…
SPX is right at the minimum 38% retrace level, so we could turn down from here. Not much happening …
Well, that was the biggest non-event in recent memory …
I don’t see anything that looks motive so far, so we may still creep up. I’m also focused on currencies and there’s nothing much to look at there at the moment, either. Will need to see what the next move is.
Nasdaq and DOW are both still short of the minimum retrace level.
Looking at the wave patterns so far, I think we need one more high to finish this corrective wave. I don’t think we’re going to see much happen today.
Gold continues up.
My Barrick Gold is already +60% since Sept., while gold is less than 10% higher.
It seems the guys were quietly collecting the gold miners while suppressing the gold
If we’re going to turn up, it has to happen right around here. I think the euro has to go down, while the indices do one more wave up.
Not a big fan of fourth waves, cause they tend to roam all over the place …
Where do you see this last wave up end Peter 1920 plus?
John,
You always need to tell me what index you’re talking about. But it’s interesting you ask. If I was to extend off the first wave up and consider that this was the real B wave, then a wave up of equal length takes me to 1980 SPX and that’s the 62% retracement level of that wave. When two measurements end up at the same spot, that spot tends to be important. I also look at the eur/usd, which has been moving contra the indices and it looks to have finished (or almost so) the E wave up of the triangle. I think it has to bottom at the previous low, so that’s a ways to go.
Putting those things together, tells me that that’s a scenario that might “have some legs.” We’ll just have to see what happens. The dollar seems to be driving the market.
Thank you Peter for your quick response I will mention the index next time..
🙂
If we travel up that far, I’ll be happy to wait. The result will be a large 3rd wave down. In the meantime, I will likely get short the eur/usd.
John,
The turn dates were actually Jan 25-27, and since we’re going to do a C leg that most likely will head up to the 62% retrace level, I would think our key turn date is next week. Could even be Monday, Feb 1.
End of the day: Looks like the futures are ready to head up (after a proper bottom) and eur/usd is poised to head down. Aud/usd has completed 5 waves up and has to correct down 62% from the low. Not sure where CAD is at right now—it’s wandering around in the fifth wave, I think, but the pattern is a bit of a mess.
US cash needs to at least retrace 38%. While we’re close, we’re not quite there yet.
I’ve placed a couple of new charts at the top of the post to give you an idea of where I think we are. The next couple of days should give us a clearer picture of timing.
Hi Peter
Are you a big believer in extended 5th waves ?
I have seen your diagram posted before and I understand
Comodity spikes in 5th waves based on fear . I’m guessing
You have either observed or have a similar thought to
Down drafts in stock prices that the fear creates an extended 5th wave ?
I am having trouble seeing this decline as a 5 wave move from
The dec 2015 hughs . Same issue using the nob 2915 highs .
Can you explain how you have come up with this wave pattern
I have never seen this style of wave counting ever on downside moves
In stocks . Also while I question The wave count . It looks like you wave
Iv near the 2020 level in the spx chart you have posted at the top of
The page . If the market is supposed to go back to the iv wave of 1 lesser
Degree then wouldn’t the 2020 level be the target ?
Joe
Joe,
I don’t understand this at all. Maybe you’re talking about the truncated wave? I don’t understand the reference to extended fifth waves.
For a fourth wave, the market retraces 38%, which is usually to the previous 4th wave. For a second wave, the market retraces 62%. We look to be in a second wave.
Sorry for typos
Darn smart phones , I was talking about wave count
From the nov and dec 2015 highs ( the year 2015 )
Looks like the currencies are turning, so futures should turn up here – at a double bottom, I think. For futures and cash this wave up should be in 5 waves.
My target for ES is about 1975 on this C wave.
Hi Peter,
should we count 5 waves from the B low on the 26 of Jan ?
Does it mean that the double bottom today corresponds to the 2nd in ES?
Yes, Dmitri,
Correct. This drop was the second in ES (a little different than cash). So we’re in the third of the C wave in ES.
Dmitri,
I was in ES for awhile but I don’t like staying overnight if it isn’t going anywhere. The structure so far is questionable and it might go lower before it goes higher. Euro is finally coming down but it might have to do a small second wave before it heads lower so that adds to my ES concern. The short term trend is up, but it’s going to be a challenge, imho.
Thanks Peter,
SPX has been in triangle all the day with small throw-off after.
I think ES will fluctuate around until tomorrow GDP and eventual BoJ intervention
Dimitri,
It might perk up tonight if the euro gets moving. It dived with earnings. AMZN dove $95 and it looks like a full first wave so after a bounce, it’ll be shortable.
FB should be next, but I don’t know when it reports … One by one, they’re all gonna tank.
FB has reported yesterday.
That’s why it has got 15% today
Oh yeah, I see the gap now. It will be interesting to see how FB changes, how many “look at me” people aren’t as active anymore. I don’t spend a lot of time there … I guess FB will be one of the last to get hit then.
If you ever wanted to check the validity of the link between eur/usd and futures, you can certainly see it tonight with the big first wave down the euro just did.
Dimitri,
I put us at the fourth wave of the third up. That means we should have one more leg up of the third before doing a larger fourth wave and then a fifth to the top.
That’s in ES
Thanks Peter ,
where do you see the end of the 3rd before correction?
I think around 1934. That would leave a smallish 4th retrace and a fifth the same length as the third up to 1970. Some speculation there, of course, but that’s my take on what I’m seeing so far.
Euro doing a fourth wave – it still needs to break down from the large triangle. Euro moves seems to be well ahead of the equities, which is nice … I’m long ES, short euro.
It’s difficult figuring out exactly where to measure from. We started with a triangle. So 1934 is a bit of a guess.
I’m out in front of the weekend, expecting a small correction about here. That looks like the end of the middle of the third to me. Overall, more upside to go.
Dimitri,
I put the ES retrace bottom at 1907. It will likely take a long time, as the second wave was lengthy.
Currencies. This is one of a long turnaround for the euro, after an ending diagonal. But the triangle should be complete and I’m looking for it to descend towards 1.0524.
AUD/USD and USD/CAD look to be in second waves before they start into a large retrace.
Another note on posting comments. I’m still having odd issues with posting. It’s putting regular posts for some people in spam and I have to retrieve them. So if you find your post is not showing up, let me know as soon as you can. peter@worldcyclesinstitute.com Just email me.
Once I find it and post it again, your regular status should be fine again. I had a plugin that messed up some code and I have to deal with it this way.
Hi Peter
My question was in regards to your last posted chart
At the top of this web page .
You have labels I. Ii. Iii iv. Then a very long drop to
A labeled. V1 . Wave v ( or 5 ) is longer then waves
I ii iii. Combined so I was asking are you a big believer
In extended 5 th waves ? Also on that chart at the top of this
Page ( same chart ) you show a wave label near the 2020
Price level a label of iv . If that means a wave 4 and the wave
V means wave 5 then isn’t this also implying that wave 5
Extended ? So in a nut shell wave 5 was the longest and strongest
Wave down ?
Joe
Joe,
That’s a typical first wave down. You can go look at AAPL and measure it, euro (big pictures–daily, I guess), and even tonight on the euro. I’ve explained it quite a few times, but here’s the page on it. https://worldcyclesinstitute.com/first-wave-down/
Hi Peter,
So what will be your focus time or price?
Today is the important turningpoint Jan 28/29 you mentioned will it be a top or bottom?
John,
I’d made a comment that it was actually 25-27. It’s over. I also suggested the turn is next week.
I’m more focused on trying to figure out what the market is doing at the moment. I think we’re in a triangle. Until it sorts itself out, I don’t know.
Thank you Peter,
Next focus for me the bradley Feb 3-5
John,
That sounds about right. 🙂
We will have to see a big move:
Spiral Sean has date Feb 5
Mercury 6
Bradley 3 or 5
Oh, it’ll be a big move …
This is the inflection point. As long as ES can get above 1910 and stay there, we’re set up for the longer run up to the 62% level. Eurdollar still has a long way down to do, so I suspect we’ll just keep going.
Looks like I’ll be doing in interview with Dale Pinkert on FXstreet on Feb 12. I’ll let you know details as we get closer. I’ll probably be pretty scary … haha. We should be into the third wave by then.
I will hopefully get the forum up by the weekend as well. It will allow videos and pics, along with private messaging, so you can connect with each other. As well as a trading area (with EW pattern info), it will have a general area on the economy, news, climate, etc.
Hope it will get lots of use. I’m also building out some other areas of the site with lots of info on the bigger picture.
It will be a “closed” forum. In other words, viewable by guests, but you have to be signed in as a member to post. That way, we avoid spam and anyone not associated with us getting any personal info.
Update on Market: Cash and futures right on track. So’s the euro. Expecting the euro to break down from the triangle. We’re close to the end of wave 3 in the euro. Still lots more down to go, as there is “up” in the equities. Gold continues up … long way to go. Oil heading up, but it will turn down around $40 or so. I’m expecting something like a $10 bottom eventually. It’s in an ending diagonal.
New video and charts on the weekend.
Note that there’s an earlier possible target for the SPX – 1950 is the previous 4th wave. The Nasdaq is trailing badly, so we’ll have to see what happens with it as the waves unfold. In the SPX, the a and c waves would be the same length at 1980.
The eur/usd should retrace to 1.086 (previous fourth wave) before turning around and heading down.
Hi peter
Thanks for the clarification on the wave count .
Any thoughts on the 10 year treasury bond ? TNX
This is becoming interesting now
Joe
Hmmm. It’s set up to head up. Looks like a second wave has formed after 3 waves down and then 3 up again … all 3’s. So a retrace towards the top is my take.
And yes, interesting it is indeed getting (as Yoda might say).
Hi Peter
i have used the puetz window for a little over a decade and thought to have fully understood it . i have always dove tailed it with chris carolans work ,
however tonight i have discovered a flaw in the puetz window which i have somehow
overlooked .
http://www.timeanddate.com/eclipse/list.html?starty=1920
the data stands straight out if your aware of the oct 29 1929 crash date
using chris carolans work nails both the 1929 and 1987 crashes
yet the puetz window failed badly in 1929 . as i noted before i have used
this set up for just over a decade and have found it helpful many many times
yet it is flawed . Chris carolans work also has its moments .
bottom line : more research to dig through as to why the failure in 1929 with
the puetz window .
Joe
I don’t put a lot of stock in the Puetz window. I’ve done an analysis for 2007, which I’ll post in the forum and he does a good job of analyzing 1929 in his book. You’re right, the 1929 top wasn’t very satisfying in terms of his theory.
I think the main takeaway is that major tops follow the 19 year crash cycle (2007 high) and a geomagnetic high. Then watch for the solar/lunar window as a possible trigger. As far as I’m concerned, it has little to do with our current situation.
I have a video interview with Steve that I just have to get edited and posted very soon.
Last week I said this week would be down. I was wrong. Thank god this site is for eductational purposes only. But this doesn’t change my outlook.
I said 1/25 was a major date to test. I now found 1/30-10 – 2/1 is equally important. The major cycle date that Peter gave last week fit’s nicely with my range (midpoint).
This weekend we have last quarter at apogee. This will give the weakest tidal pull possible. That should bring a high. And this provided the fuel the market needed to go up into this weekend.
So now gravity will go up (negative for markets) and 2 major dates have been tested. Next major date some weeks from now.
So my outlook remains : down into february with 2/7 low, 2/14 high, 2/22 low.
Cheers,
André
Another one that went to spam. I’ll keep watching. Sorry for the delay in posting. Hope to have forum live sometime this weekend (hope I’m not lying). Just finished a video, which will be live soon.
My thoughts for this week:
Maybe next monday still up that will be the start of a more volatile week ahead
For the Mahendra lovers this is an interesting link from his newsletter Jan 25-29 and the days ahead… He is not bullish on oil longterm I remember his newsletter may 2014 he called the last top that was spot on.
Also the analogie 2008 and 2015 (Jan and Feb) is still inline if it will stay on track after Monday we will dive agian not to new lows but close..
http://nl.investing.com/commodities/crude-oil-streaming-chart
http://www.mahendraprophecy.com/userfiles/files/25-29_january_2016_weekly_financial_letter.pdf
To all
Have a nice weekend.
Sometime this week we’re rolling over. End of story.
Haha … we’ll see who picks the lucky day.
New post https://worldcyclesinstitute.com/the-little-engine-that-couldnt/
This website is for educational purposes relating to Elliott Wave, natural cycles, and the Quantum Revolution (Great Awakening). I welcome questions or comments about any of these subjects. Due to a heavy schedule, I may not have the time to answer questions that relate to my area of expertise.
I reserve the right to remove any comment that is deemed negative, is unhelpful, or off-topic. Such comments may be removed.
Want to comment? You need to be logged in to comment. You can register here.