
Update Friday, April 8, approx. 3:00 PM EST
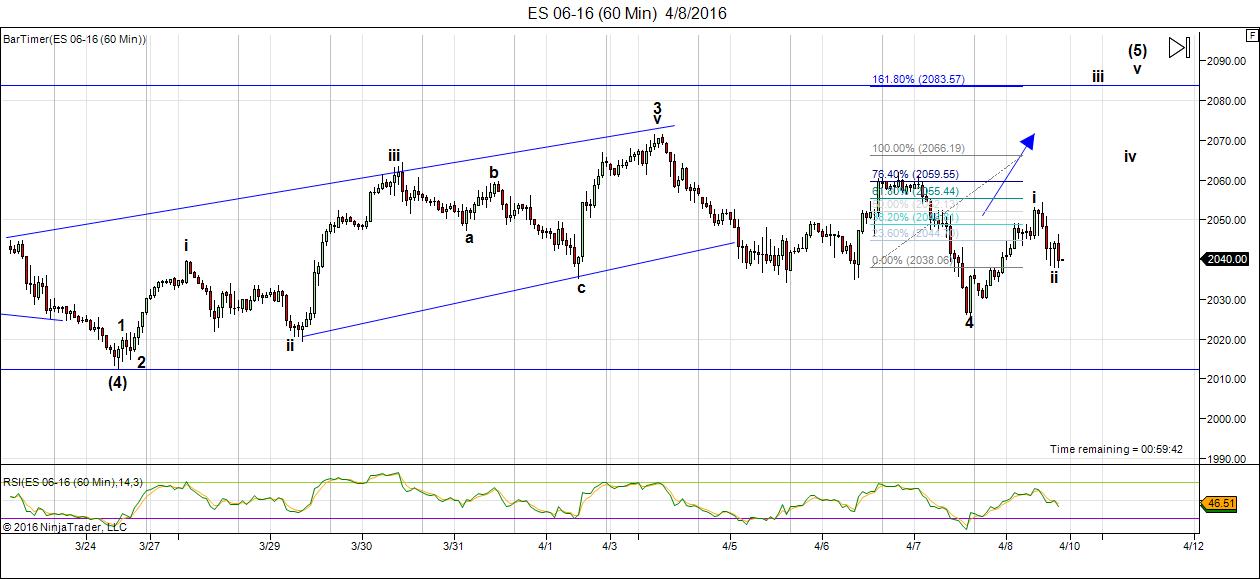
Above if the 60 minute chart for ES as at the above time. This final wave up looks to be in the expected five waves. I’ve revised the count structure for ES to align with the SPX. You can see we’ve done a what looks like a running triangle for first set of waves of the fifth wave, and we’re working on the final fifth wave up. We appear to have finished wave 1 up, 2 down, and are starting on wave 3 up. If it’s 1.618 X the length of wave 1, it should top at ~ 2082.
______________________
Update Thursday, April 7, Approx 3:30PM EST

Above is this afternoon’s ES chart (60 min). We dropped into a larger fourth wave this morning, which changed the structure of the ending diagonal yet again. We now have an expanding ending diagonal, which is much more bearish.
This is suggesting that we’re looking at a final wave up of an ending diagonal.
We’ve blown past another cycle turn date. The next one is the middle of next week. Judging by what’s happening in currencies, this may take a few days. We seem to be having problems making this last wave up (which is to be expected).

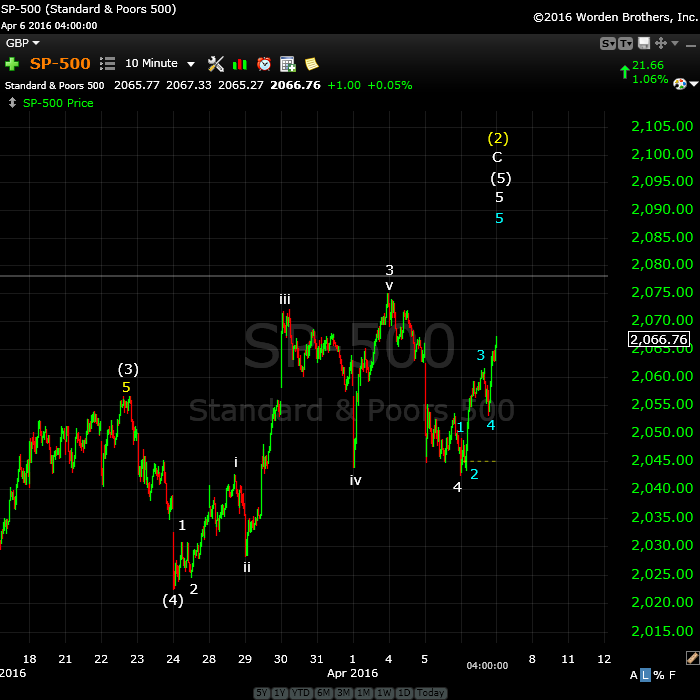
Above is this afternoon’s 30 minute chart of the SP500 (as at 3:15 PM EST), so that you can see the configuration of the final wave here. I have changed the count based upon this morning’s drop into a fourth wave. We’ve just extended the fourth wave and still have a fifth up to go.
This morning was a failed fifth wave and the resulting extension of the fourth wave. We didn’t go to a new low and the count still works. One more wave up to go. It shows the weakness in the market.
Currencies have turned to support the wave up in equities.
________________________
Update Wednesday, April 6, After the Close
Some updates:

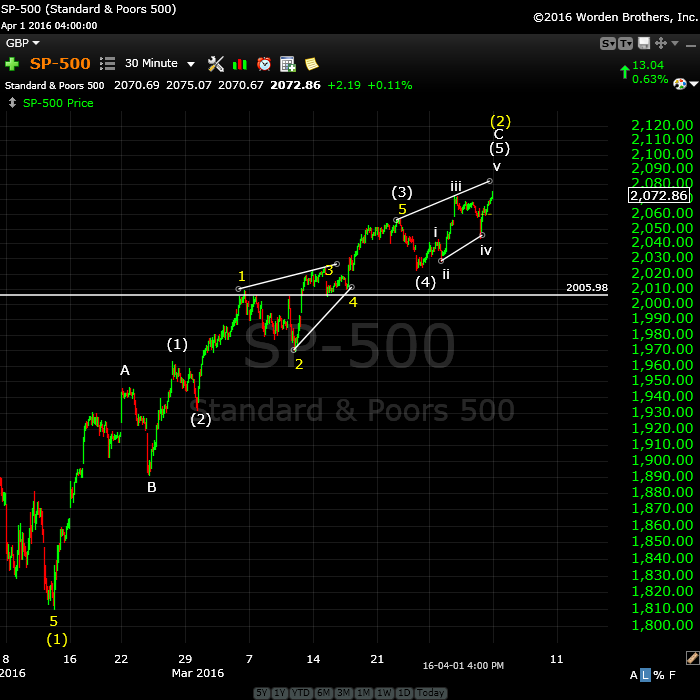
Above is the 30 minute chart of the SP500 showing the progress today (Wednesday) in tracing out the final fifth wave. The pattern for the final sequence is up for interpretation. It’s not quite a proper ending diagonal (at least, not at the moment)—the waves don’t touch both sides of the pattern (trendlines) as they should. Because the waves i and iv don’t overlap, I’ve labelled waves i-v a five wave sequence up to the end of wave 3 and allowed for wave 4 down, leading to this final wave up.
Other indices have overlap and are sporting very obvious ending diagonals, so the market is a bit of a mess at the moment, but everything points to this being the final wave. I will be looking for a turn on Thursday.
Above is the 10 minute chart of the SP500 so that you can see what’s happening “under the hood.” The final wave up is in progress and I’m showing the count so far. This count may change, as the wave up may be all of three, rather than the 3/4 combination I’m showing. In any event, I expect this wave to finish at a new high. We could see future drive up the cash indices tonight to a new high, resulting in an opening gap reversal tomorrow morning. This is when the cash indices open with a gap and then immediately reverse.
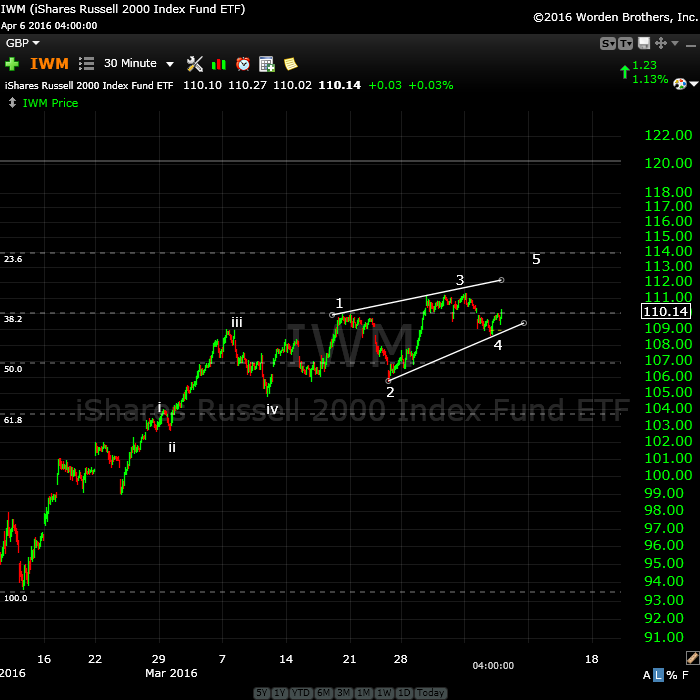
Above is the 30 minute chart of IWM (Russell 2000—mid cap stocks). It’s got the cleanest ending diagonal. You can see that we have one more wave up. The other indices are not as “clean” and the pattern is not as obvious. They all have to end together and turn down together, so it’s important to look at the overall market to see what all the players are doing.
___________________________
Original Post: Yogi Berra was a world renowned New York Yankees catcher and coach who was as well known for his non-sensical “truisms” as for his accomplishments on the baseball field. The title for this blog post is perhaps his most famous saying, but here are 49 more, if you’re interested.
In any event, this 2nd wave is almost over. The next cycle turn date is April 6.
On Friday, the NYSE advance/decline ratio was negative all day. There is divergence between the DOW Transports (DJ-20) and the DOW (DJ-30) for the week.
The euro has moved slightly outside the triangle I’d identified last week and so I’ve now marked the current spike up as wave 2. As I keep saying, as soon as we see the euro turn down, so will we see the US equities turn down. The dollar controls the market and it’s at a major turning point. Watch it closely for the signal of a turn down in equities.
We’re still in the the final fifth wave of the C wave and while we may see a spike in the indices in this fifth of fifth wave (the throw-over), it should be short-lived and I would expect a dramatic turn down, with waves that should revert to the beginning of the ending diagonal relatively quickly (in the case of the SP500, this is ~2022.00).
I’m calling this final wave an ending diagonal, even though SPX does not show overlapping waves. ES (SPX e-mini futures) does, and the pattern otherwise lends itself to that analysis.
As I mentioned last week, the VIX has flashed a sell signal for equities (the VIX should turn and head up in the next few days).
Celebrating: I’m mentally celebrating a major milestone (no cake or candles …). This past week, we reached 125,000 visitors to the site annually and over 1 million pageviews a year. So thank you to everyone who have kept the site positive and a learning experience, thereby attracting a bit of a crowd! And double thanks to all the contributors.
The Latest from Donald Trump (click here): I was somewhat “floored” to find out that Donald Trump is expecting the downturn in the economy. I’m not sure he’s ready for the fallout personally, as it’s going to dramatically affect his “empire.” He seems to have a rather naive view of the gravity of the situation, based upon this recent interview with the Washington Post.
____________________________
![]() Here’s a link to my interview today on trunews.com, for anyone interested. We focused mainly on Global Cooling, but also covered a fairly wide range of cycle-related areas in a short amount of time.
Here’s a link to my interview today on trunews.com, for anyone interested. We focused mainly on Global Cooling, but also covered a fairly wide range of cycle-related areas in a short amount of time.
______________________________
Here’s a video overview of the market for Monday, April 4, 2016:
Market Report for April 4  |
 |
Make sure you zoom the video to full size with frame expander (arrows) in the bottom right hand corner and also set the quality to as high as your web connection allows. This is an HD quality video so the best viewing is at that level. |
_______________________________
The Charts Going into Monday.
In the fifth and final wave …
Above is a 30 minute chart of SPX. The final fifth wave is in the final stages. I don’t have an ending target, as this appears to be an ending diagonal. We may have one small down wave and then an up wave. The top will be sudden and should retrace to the start of the pattern (about 2022.oo).
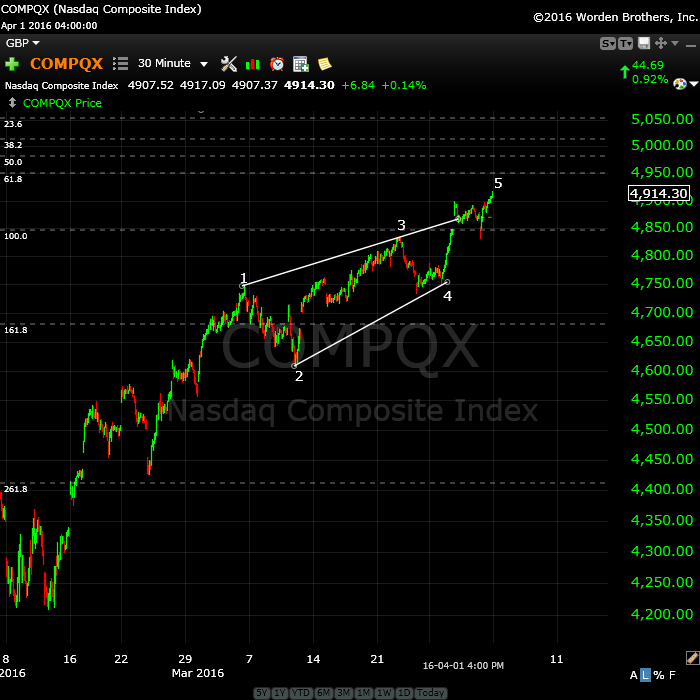
Above is the 30 minute chart of the Nasdaq COMP. As noted last week, we’re in the final stage of an ending diagonal. If you count the subwaves, you can see we’re in the fifth wave of the fifth. The end is nigh.
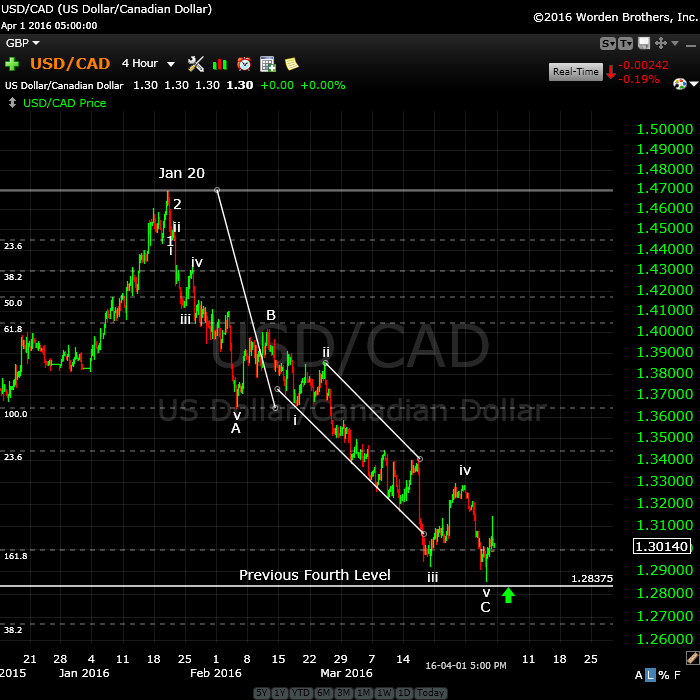
A Major Inflection Point: Above is a 4 hour chart of USDCAD. I have been watching this first wave down unfold and it’s met the target. The wave measures and numbers as a first wave or a complete ABC corrective wave. It has retraced right to the area of the previous fourth. This may be the extent of the correction before a large 5th wave up to a new high, which is now my preference.
As I mentioned last week, I was expecting a retrace down to a new low. We have now met that short term target. Expect one more wave down perhaps to a double bottom. Watch CAD and EUR for the turn, as this should signal the turn down in the US indices.
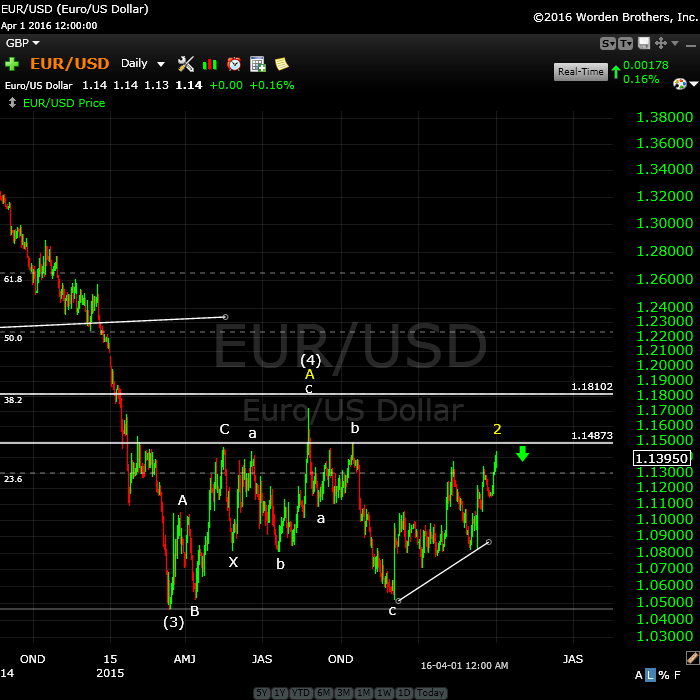
A Major Inflection Point: Here’s the daily chart of EURUSD showing the waves up over the past few days that exceeded the previously market E wave of the triangle. As a result, I’ve relabelled the final wave to a wave 2, which is now similar to the structure of the US indices.
Last week, I mentioned here that I expected to the wave down to be completely retraced to a new high, which is exactly what happened. The eur/usd should achieve a double top with the b wave marked before turning down in tandem with the US equities..
The US dollar should do the same thing but in the opposite direction (up).

Above is the daily chart of GDOW (Global DOW) showing the current count. It looks to me like we’re tracing out a second wave after an ABC lower part of the wave. This wave will likely stop very close to the 23.6% retrace level (or 76.4%) from the bottom of the wave. This should lead to a very large and strong third wave down.
I do not see a path to a new high for GDOW and, in my opinion, this strongly lowers the probability of a new high for the main US indices.
________________________
First Wave Down – What to Watch For
This weekend we’re dangerously close to a top of a second wave (in the fifth of the fifth, with an ending diagonal pattern).
What we’re looking for to confirm a turn is a motive wave down in 5 waves.
Because we have an ending diagonal, the first wave will likely drop to the previous fourth, which is also the beginning of the ending diagonal pattern (~2022). After that, we should get a second wave that will retrace in 3 waves about 62%. That’s the preferred EW entry point. So don’t feel you have to rush in. There’ll be a much better opportunity at the second wave level than at the top and the risk is substantially reduced.
__________________________
The Alternative Count
Here’s the alternate count which calls for a new high. I’m going to leave this up for one more week, but I give it even less chance of happening than I did when I created this stabnd-alone video (on March 25, 2016).
 |
|
Make sure you zoom the video to full size with frame expander (arrows) in the bottom right hand corner and also set the quality to as high as your web connection allows. This is an HD quality video so the best viewing is at that level. |
_______________________________


Thanks Peter,
Very clear to me
For the Mahendra followers from tommorow on a new cycle will start but het is still bullish he mentioned the bull will go on (this cycle) 91 days after March 3 so till the beginning of June not in a straight way but we will go up.
I also think we are close to a top and maybe April 13/15 wil be a low and we will sell off after the new moon (april 7)… not sure yet .
Ref Trump: I distinctly heard him say his financial empire was debt free. Since he built his empire on debt, that surprised me. If true, it indicates he is a lot smarter than reported. If I read the Zero Hedge stuff correctly, they are criticizing him for telling what they, you, and I believe about the economy. What do they want a liar like Bernanke – subprime contained, housing prices will not drop? As well as Geithner, Paulson, Reuben, Dimon, et al.
As to the mkt and economy. Which 18 year RE cycle is correct, yours or the book you are reading by Phil Anderson.
Kent,
Here’s another WSJ article I just found on his personal finance. http://www.wsj.com/articles/trump-and-his-debts-a-narrow-escape-1451868915
This shows him to be both smart and ruthless … and out of personal debt. I didn’t know that. So, I have to give him a lot of credit, if true. And it makes sense if he knows we’re going to have a crash. But thinking he can “fix it?” I think that’s the naive part.
I’ve finished Phil’s book. Spectacular detail on past crashes. I was more interested in the recurring pattern, which he documents extremely well, than on the timing. I’ll have to go back and take a look. I think we’re 9 years off.
I went with Dewey’s cycle extended. I note in the book that Mr. Anderson doesn’t delve at all into the cosmos and actually questions what causes the cycles. I’ve equated the 18.5 year cycle with Dewey, Wheeler, and the 18.5 year lunar nodal cycle, but I haven’t definitely synced them to a start and end date, which is still on my list to do.
All fascinating stuff, imo.
I realized that WSJ article was locked after I posted it. If I search for “trump debts,” I can read it, but if I go to the url I have to subscribe. So I backtracked and copied it into the forum, so you can read it here: https://worldcyclesinstitute.com/forum/politics/trump-and-his-debts/
Thanks, Peter, for this post. I am looking for a high on April 7 (if we stay positive until then) and then sell off afterwards. Should be below 2000 by sometime in following week, with 1975 almost certain, and 1925 likely. Have accumulated April 15 Vix calls with that in mind and will peel them off as they begin to be in profit. April 9 is Uranus conjunction which month before to month after tends to depress price, so if this is a top 2070, then cycle down to 5% lower within next month is likely.
Max weakness to follow April 7th, so any real sell off should be between open on 7th, and April 15th (US Tax Day often is bottom in April to allow IRA contributions to be acquired at discount to encourage savings.)
http://www.safehaven.com/print/40984/market-turning-points
excellent technical analysis…dovetails with the exceptional elliot wave analysis provided by Peter!
I just added a couple of other charts at the top, as the ending diagonal seemingly forms just about everywhere.
Based on the size of this second wave, I would expect the third wave (of the third) to bottom in the 1200 area of the SPX. Then we’ll have a 4th and 5th to go after that. So this looks to me to be “the big one” lining up.
Curious to how you calculate that. My most bearish case is getting me around 1340
Ted,
You can measure the length of the first wave down from May 20 and then 2.618 X that from the top of this second wave (wherever it ends). I got roughly 1250 or something, but it will tend to find a second or fourth wave and there is one just at about that level (1265 or so). That for now, would be my target.
Peter,
I think you are right about 4/6. In time, everything comes together.
André
I had originally wondered how we would last that long, but we’re moving incredibly slowly and with the very tiny waves (with a few more tiny ups and downs), it’s becoming more likely in my mind.
On the 122.1 degree crashangle, 4/6 is the first date after 1/31. Gives some sense of perspective.
Interesting. It’s amazing how certain levels and numbers pop up again and again from a variety of methods.
You can see a lot of the big players setting up for the next wave down.
AMZN: second wave (entry 612.90)
AAPL: second wave (entry 111.74)
FB: double top ~117.00
GS: fourth wave (entry 162.25)
Gold has done 5 waves up and is heading down to about 1140, as forecast.
GDOW may have topped at the current double top (or is has a little more to go. Good entry would be to short under the previous fourth at about 2230. Because of all the gaps, this is a hard one to call.
A little more patience.
Peter,
could you explain why you have decided today to make the count in ES of the last 5th of5th different than in SPX. Your new count has a big i wave and smaller iii.
It looks like ES has finished tonight its 5th of 5th. This wave down looks motive.
Am I wrong?
When I say motive I mean ES at 1 min chart
Briefly, one chart does not make a motive wave down. None of the cash indices look remotely motive. The counts in SPX and ES look pretty much the same to me. We’re missing a final 5th wave up.
I don’t find ES to be motive—no proper second wave and the length is wrong (so far).
Market looks poised to close Monday with slight gain. Tuesday sell off in morning and close with slight gain. Real selling Wednesday and Thursday.
Hi Valley,
Still holding on to your prediction today en tommorow we sell off?
I also have April 15 for a low.
John,
I would have expected more out of futures last night to call a top later today. I also have the next turn dates as 13/14/15. I cannot find any motive waves down, so the route is still to a new top. We’re struggling.
But then, we’re waking up. USDCAD has just broken a trendline it’s been working on all night, so if we suddenly find some momentum, end of the day might still be a possibility.
Today, has gone from questionable to quite good. Everything is performing as forecast, although on a time delay. But that’s OK … 🙂
I’ve updated the ES chart, as we now appear to have the fourth wave in place (of the 5th of 5th). This lets us define a maximum for the top, because the third wave cannot be the shortest wave.
I also added a complete labelled SP500 chart so you can see the wave structure and how its getting more and more compressed as we reach the top.
Since accurately projecting the price/time targets $1070 bottom in gold for July 2015 and the anticipated “W” bottom retest for Dec 2015… and after accurately calling the May 2015 top in the equities market, the subsequent low in August, the rally into November/December, and the subsequent plunge to commence after mid-December to accelerate the first week of January 2016… a cycle and pattern that rhymes with the 2000-2001 portion of the 2000-2002 bear market, and after explaining that the gold stocks would be the play with the most leverage… what’s next? Well, since these projections have been extremely accurate going on 17 years, projections corroborated by the fundamentals that many TA analysts don’t understand, we can now expect the market to roll over putting in a lower low into mid-June… we can expect the gold complex to put in a leg 3 high into mid-June as well. The US Dollar to the befuddlement of all the “Deflation Scare” “Cash is King” advocates (a currency that has lost 98% of its purchasing power since 1913), has been the exact opposite to the gold price and has been in decline since March 2015 and will continue its most recent leg down into mid-June as well (to the utter bewilderment of the “Cash Is King” bugs).
Hi Joel, do you offer a monthly service?
thanks,
Glenn
No… but I have a 19-year long track record at CSU Long Waves forum, the original Kitco (K-1) forum, and Capitalstool forum… was able to beat out the TA experts such as Prechter predicting $106 Gold in the late 90s… beat out Marty “A’s analysis that he claims was so good he was imprisoned for not giving up his code (after stealing billions from his investors). Haven’t had a need to collect fees offering a subscription service… my thousands of posts have all been free.
Your name should be “Smokin’ Joel”. Heavyweight analysis. =)
No, but the success from my multi-decades long pursuit of understanding market fundamentals, cycles and TA has served me well.
thanks for the summary…do you follow Eric Hadik?
http://www.insiidetrack.com/about/eric-hadik
No, but I have become familiar with his work in the past year… (and agree with what I read). The 40-year cycle was one of many popular discussions back in the late 70s.
I highly recommend the book on this topic by William Strauss, The Fourth Turning… it was one of the hundreds of books that I have read since that opened my eyes to cycle analysis. As well, I have my own mathematical equations that explain many of the cycles that govern market fundamentals today that I have discussed in exhaustive detail.
Error:
“late 70s” should read “late 90s” around 1997-1999…
You don’t happen to live in N. California?
No… at one time but no longer.
A few lucky traders bought a lot of April 16 260, 270 and 240 puts of Allergan today.
It looks like we’re morphing again, from the ending diagonal to a simple fourth wave, which likely means a lower top.
I updated the SP500 chart at the top of the post. I expect slow going until we find this elusive top. It’s a very weak market.
Fed minutes will be out at 2PM EST and that may have some impact on the market.
Short market with Vix calls expiring 4/8. Expect Thursday to be price bottom this cycle at 2020.
Nothing much has changed. We’ve got a small b or 4th wave formed and futures should continue up with this C or third wave. The indices (futures and cash) have different configurations and it’s difficult to know if we’re looking at a straight 5th wave up or the end of a triangle or ending diagonal (hence the b or 4th wave).
I can see a scenario where futures continue up tonight and we have an early reversal tomorrow morning.
So far, for the US market, the call is still up to at least the previous high. It continues to look motive.
I posted a chart of IWM, which has the cleanest ending diagonal pattern.
I updated some charts tonight for the morning (SP500 and IWM).
Did it happen last night ????? Peter!!!
Nick,
I’ll guess you might be talking about a top? No, don’t think so. I added a chart of ES just now. If it’s something else, let me know.
I’ve added a chart of ES this morning, with a comment.
I also just added the SP500 5 minute chart so you can see this morning’s count. It’s a normal wave up (so far), so it’s much easier to gauge what’s going on.
If we keep sliding, it offers up the question of whether we can get a top out of this, but so far, it’s not looking that good. It’s certainly messing up my recently labelled charts, though.
It also could come down to the previous 4th wave low and start all over again. The SP500 is possibly about to drop into the area of the previous first wave, which would change the count.
There is always a truncation possibility, of course.
I’ve replaced the SP500 chart with a re-labelled chart, based on the drop in the cash indices this morning. The drop was in a clear 3 waves and is a second wave (as the SPX dropped into the previous 1st wave area). In fact, the subwaves count better now.
So we’ve only had one complete set up waves up and have the third wave ahead of us, unless something else happens to upset the apple cart.
If it were just up to futures, I’d say we topped, as those waves look motive. ES particularly, measures correctly right now. Cash indices are the problem.
As we get closer to a top, corrective waves tend to look more and more motive.
Peter,
If SPX goes below 2042 , then would that means the TOP was in on the 4th ?
AZ
Wish it was that easy. No, it just means we start over. We’re down in 3 waves, the wave count says it all. Currencies are backing it up. We still have work to do.
My Vix calls have been cashed in. Legging into Vix puts with April 25 expiration. Believe we will touch 2100 before then, maybe 2150.
Valley,
The party is just starting
I could be wrong but I have a low on Monday after that up till Wednesday and down Thursday after that recovery.
Well, you could be right, but I can’t find a count or wave structure at the moment that supports it.
Truncated?
The patern looks so much the same like the November highs 2015 we all can see that but the next decline will be more brutal and will start quicker.
The Mercury retograde will be the starting point these are my thoughts at the moment
I can place futures in a first, second, and third wave scenario. So that’s 3 waves down. Now, if ES were to rally to 2041 (38% retrace) and then turn over, that could be a fourth wave turning down into a fifth.
The futures actually look OK for a motive wave but it’s only 3 waves. Again, it’s cash that doesn’t look motive at all (the gaps are the problem), but maybe we’ve truncated. I need the market to tell me more.
I’m on the fence as to what’s happening. I can’t find a motive count, but we’ve destroyed the present count, so we’ll just have to see how this wave unfolds.
Measuring the wave, I would put a bottom at about 2028/29 ES
I posted a new afternoon chart of SPX. This is a fourth wave down today. We had a failed 5th this morning and have simply extended the fourth. So the count has only changed in terms of the subwaves in the 5th wave. The rest is as it was.
I’ve also updated the ES chart this afternoon. We’re now looking at an expanding ending diagonal in the futures.
Thank you very much, Peter! I have become a WCI junkie.
🙂
Peter, appreciate your disciplined and reasoned analysis…it is enlightening!
Thanks, rotrot! 🙂 (this replied to the wrong person originally)
My call for 2020 on Thursday was off by 7 points. Looking for open at 2042 tomorrow, with sell off to 2020 by close. Next week will begin weak, possibly reaching 2005, and then unusually strong with price trending higher until 4/22. Bought 4/22 call spy 204 for 2.20 and 4/22 vix put 18.50 for 1.00. Will add more contracts to these if price falls further. Most of the up move may be the week after next, hence 4/22 call and not 4/15.
VIX confirmed change-in-trend…VIX is moving up…?
https://twitter.com/allerotrot/status/718197131207643140
Hi rotrot, I have enjoyed reading your work on different sites over the years and would like to follow you on twitter. Is that a possiblity?
Hi Rotrot,
I am short VIX, small position. Will add to this short position on Monday or Tuesday. Next week ES will form base at 2000 +/- 20 points on Monday or Tuesday, and then will rise to 2100 by 4/22. VIX should decrease during this rise in the ES.
Peter, are we now in 3 of 5 in Es?
Yes. May have just finished 3 or we’re half way through.
Robert,
In SPX, we’re 2.618 X wave 1 now, so this may be the end of 3 there, which would mean a retrace to the previous 4th and then a fifth up. Measuring, if we retrace in SPX to the previous 4th (about 2053), then it would be another wave of equal length to the previous high.
Looking at the markets now, we dropped so far down (to 62%) in what I labelled as wave 4, that it’s likely wave 2. So I’ll relabel my charts to show we’ve completed wave 1 and 2 and we going to head up in 3. Wave 5 wouldn’t be long enough to make the top in ES, so this makes more sense.
I don’t know that they’ll keep normal lengths, but I’ll take a look at that as well on the weekend.
This morning, no real surprise, except maybe the speed of the move. We’re about half-way there (to the top). Next week we should see the turn. I expect to see more ‘uppiness’ over the weekend. 🙂
It’s difficult to get exact targets as I put us in ending diagonals for some and others not.
I’ve just added a chart of ES at about now to the top of the post. I’ve revised the wave structure of the last wave to reflect the same structure as SPX. It makes way more sense. So the expanding triangle is gone. We have a simple five waves up to go.
Note that EURUSD is heading up as expected, and likewise USDCAD (correction-was AUDCAD) is tracing out the final wave of the ending diagonal heading down. They should reach their targets when the US equities reach theirs, as I’ve been saying.
I updated the chart just now for ES showing the first wave up and second down. We’re starting on the third up.
A rare opportunity present early to middle next week. IF ES sells off 1 to 4% by next Wednesday, a snap back rally should occur from there with upside of 5 to 6 %.
So, watch for weakness early next week. If it occurs, take a full position. Take half off at 3% gain. Let balance ride until 4/28 or so, when an excellent shorting opportunity will occur.
This projection is based upon PALS which has a kitchen sink of astro lunar seasonal factors the main ones being lunar phase, distance, and declination.
I’m familiar with these ideas, but not this particular approach. Where coukd i learn more about PALS?
You may ask any specific question and I will answer it. For example, day of apogee to 3 calendar days after, price usually falls or moves sideways.
Thank you, Valley. I’ll review the declinations and distances again. Now I know where to ask more. I have been following Lunatic Trader’s Green Red cycle real time for over a year now. It runs from Moon 45* Sun to Moon 225* Sun, with some counter trend points in between. It inverted after the 9/27 Lunar Eclipse and the 9/30 Sun Mercury conjunction, up into the 11/2 Venus Mars conjunction. Now after the 3/22 Lunar eclipse it seems to have flipped back to normal. Only time will tell. Again, thanks.
Danny was the first one to show to me that the Lunar red/green really works. If that works, which it does statistically, it makes sense that other lunar aspects (distance, declination north to south) may be cycles as well.
New post – an important one. https://worldcyclesinstitute.com/top-tick-time/
This website is for educational purposes relating to Elliott Wave, natural cycles, and the Quantum Revolution (Great Awakening). I welcome questions or comments about any of these subjects. Due to a heavy schedule, I may not have the time to answer questions that relate to my area of expertise.
I reserve the right to remove any comment that is deemed negative, is unhelpful, or off-topic. Such comments may be removed.
Want to comment? You need to be logged in to comment. You can register here.