
Update Friday, April 15, Before the Open
On a small term scale, I think we’re set up in a second wave this morning in SPX and other indices, which means more up. We only corrected a little bit. We appear to be in an ending pattern, but what is it is questionable in some of the indices. I can see possible triangles and ending diagonals ….
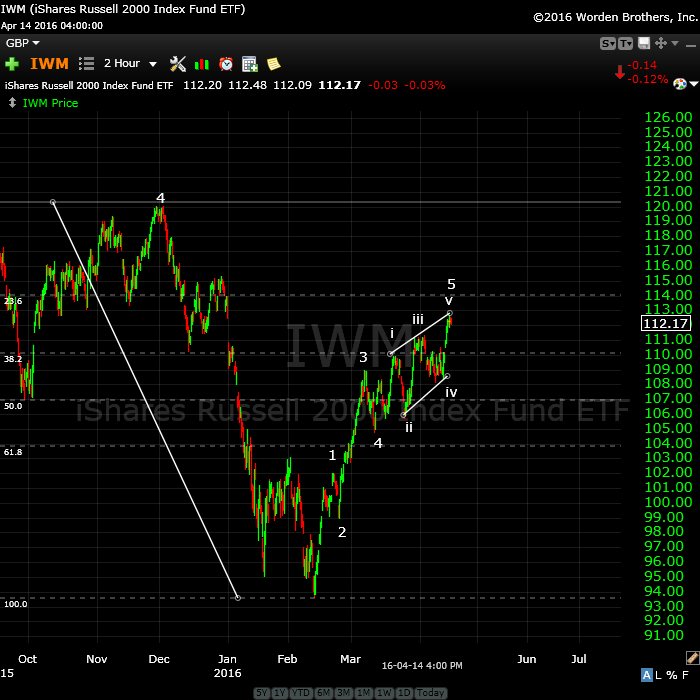
Above is a two hour chart of IWM (Russell 2000). It’s traced out a very obvious ending diagonal and just has the throw-over to complete. This is a small caps stock base and should give a pretty good indication of what’s happening overall.
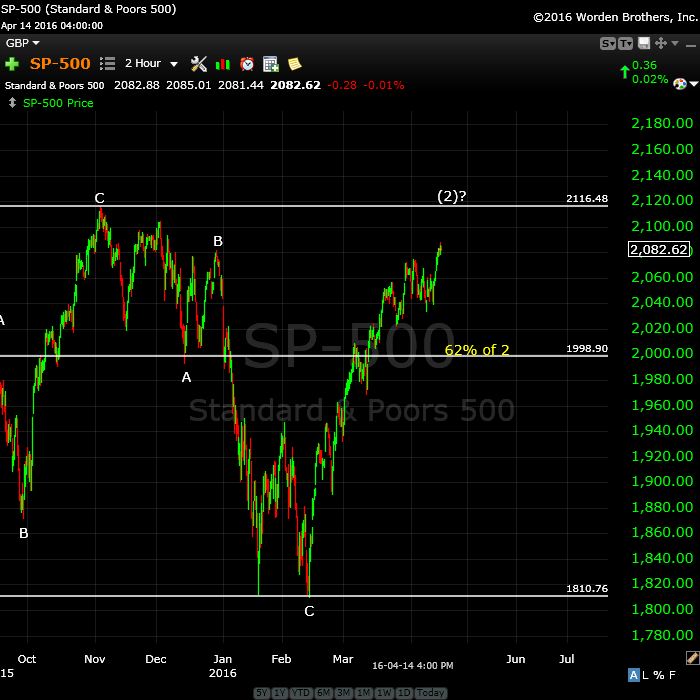
Here’s the two hour chart of the SP500 so show how close we are to the double second wave top, which I think is the ultimate target.
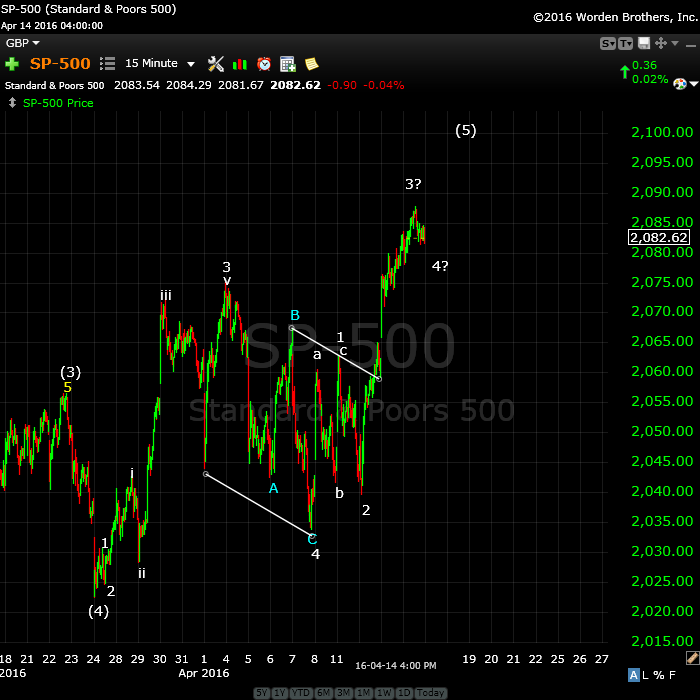
Above is the 15 minute chart of the SP500. I can see the triangle here, too, except that I’ve kept my original labels, which would suggest an ending diagonal was perhaps in a throw-over.
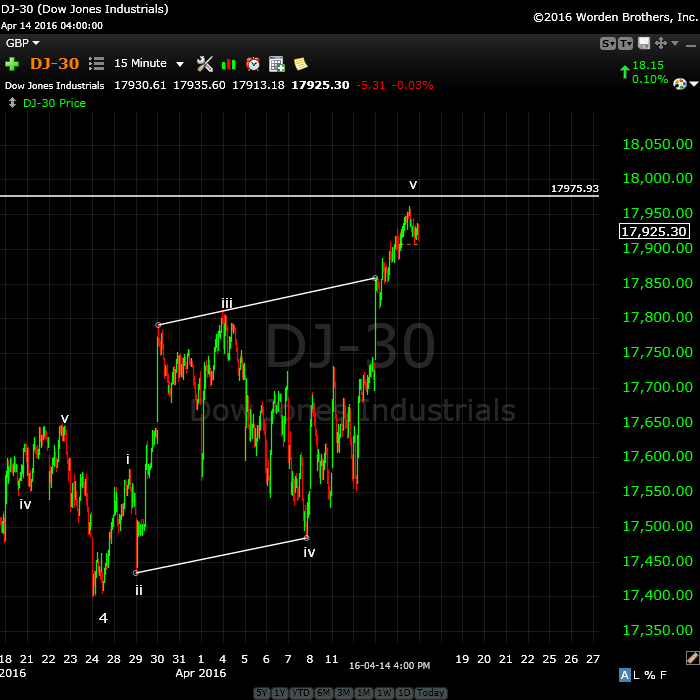
Above is the 15 minute chart of the DOW. I’ve drawn what could be an unsatisfying triangle with a final thrust. I can find this same pattern in the other indices, most notably the Nasdaq.
Note that just about everywhere I look at individual stocks, we’re in huge second and fourth waves spikes. This whole market is about to turn.
________________________
Update Thursday, April 14 11:50AM
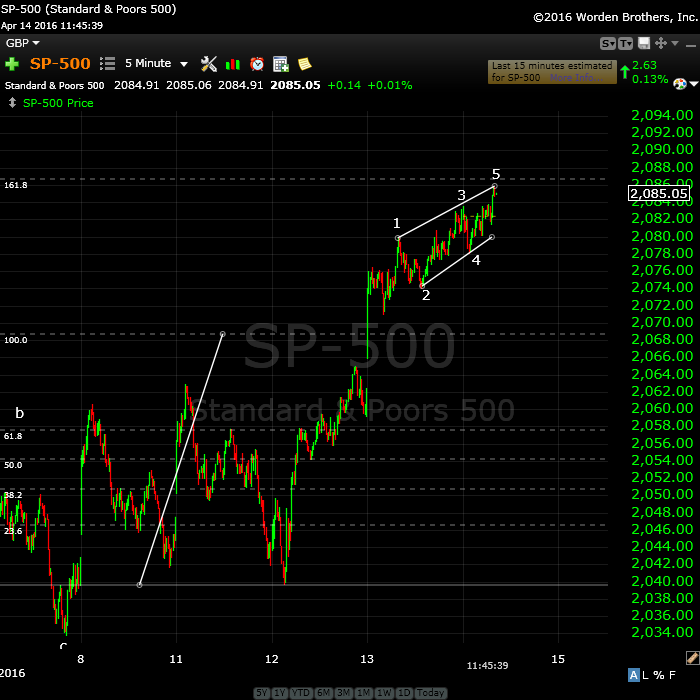
Above is 5 min chart of SPX showing the small ending diagonal being traced out.
___________________________
Update, Wednesday, April 13, ~12:20PM EST
Revised chart of ES showing the ending diagonal:
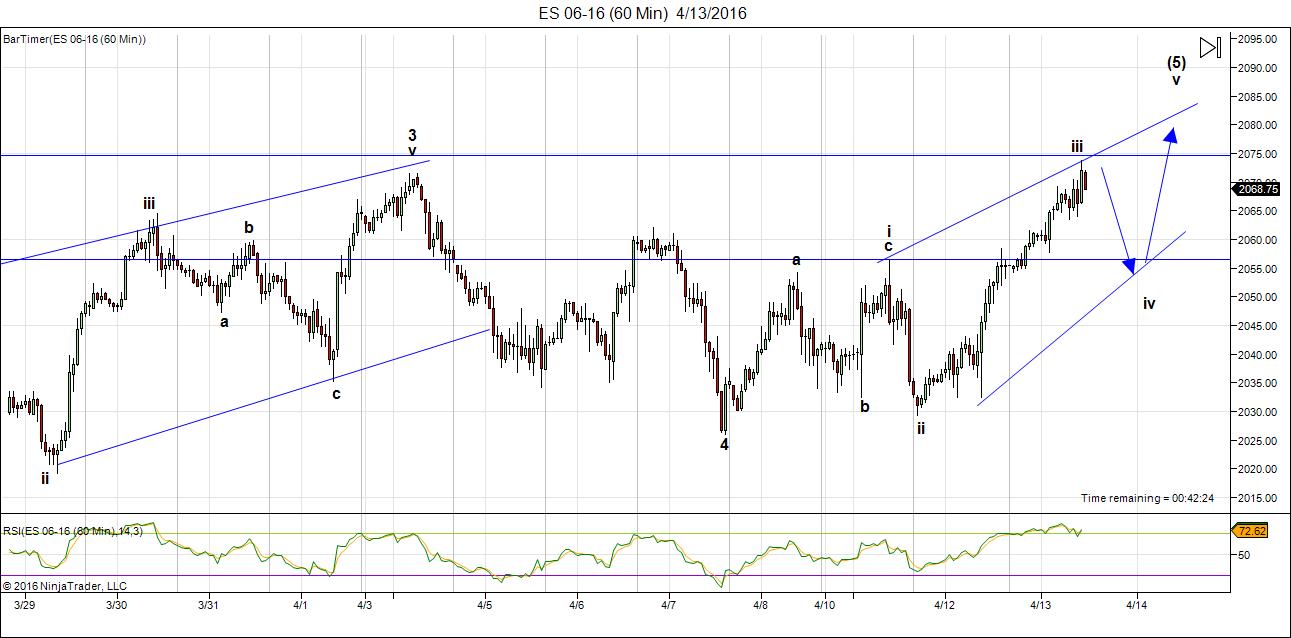
Above is the 60 min chart of ES (SPX futures). ES is in an ending diagonal, not a normal 5 wave ending wave and here’s why:
Previously, I had labelled the wave up from 4 on the chart ( from ~2025) as wave 1. That was fine, as it appeared to be in five waves. Then we turned down in a b wave and up to a new high in a c wave. This configuration now makes the first wave up a 3, not a 5. So, it’s obviously not a motive wave. It now becomes wave 1 of an ending diagonal. Wave iii on the chart is a 3, as well. You can see the double spikes down near the bottom of wave iii, but the fourth wave of that wave iii, although there, is really small. So this wave has the appearance of a 3 … and that makes it a 3 in EW lingo.
Now we’ll have a wave iv down, which should overlap wave i. So while I set a target for this wave iv of 2058, it will likely go a little lower so it will overlap wave i.
Hope this makes sense. It’s a good lesson on what to look for in determining patterns and how a 5 can turn into a 3.
__________________________
Update, April 12, 2016, Before the Open
Futures have now completed the first wave up, the second wave down, the first wave of the third wave, and the second wave of the third. The march to the top tick continues.
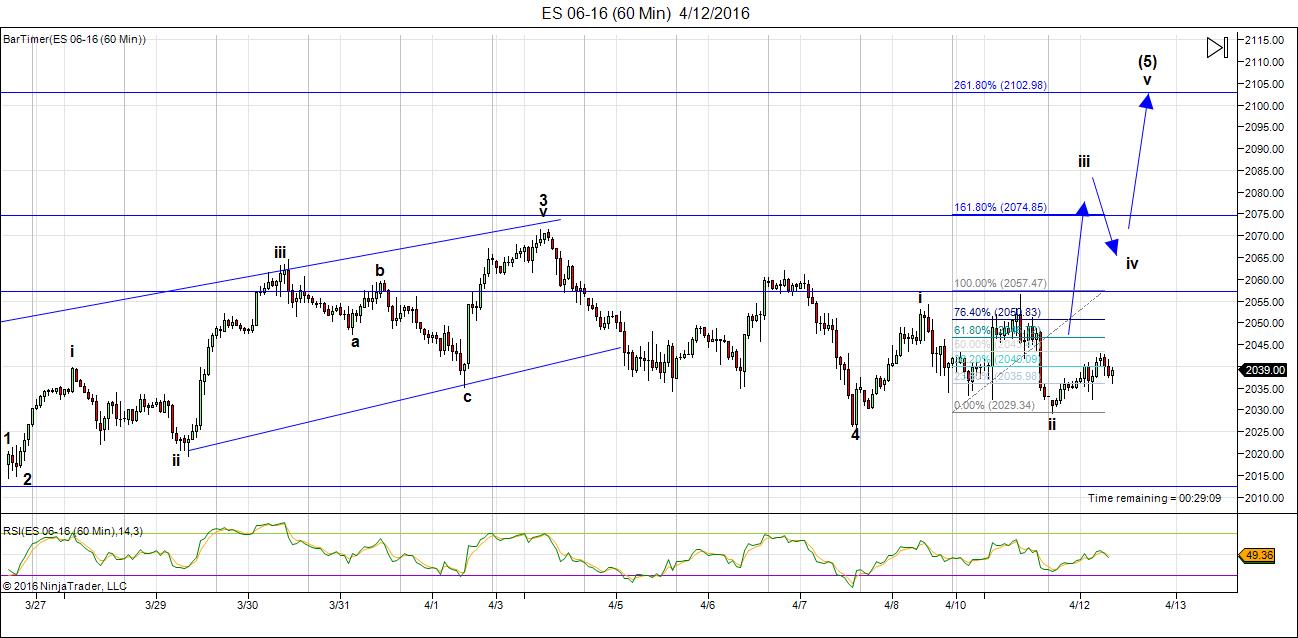
Above is the 60 minute chart of ES (SPX futures). You can see the progress on the count. We’ve losing some steam as the lower the retraces go, the lower the final target is. The waves up from here will determine where we eventually end up. Typically in a final wave, they tend to get progressively shorter as the pattern unfolds. We’ll have to wait to see what happens. If the market drops below 2012, (the previous fourth wave) the chance of a new high will diminish greatly.
___________________________
Original Post: We’re now looking for the top tick (or pip, if you’re focused on currencies). I think we’ll see it this week.
In any event, this 2nd wave is almost over. The next cycle turn date is April 13,14,15 for US equities.
We’re expecting some sort of geopolitical (or financial) event this week. There’s lots going on.
- Italian banks are on the verge of defaulting, Greece’s problems are beginning to surface again.
- Yellen has called for a special meeting with Obama.
- The US Congress is supposed to pass a new budget by April 15, but nobody is budging and there’s no plan.
The dollar controls the market and it’s at a major turning point. Watch it closely for the signal of a turn down in equities. (More on this in the video).
The direction is still up. But not for that much longer.
We’re still in the the final fifth wave of the C wave. The structure of the move up in the SP500 is questionable. I’m going with the start of an ending diagonal, as I explain in the chart below and in the video. While we may see a spike in the indices in this fifth of fifth wave (the throw-over), it should be short-lived and I would expect a dramatic turn down, with waves that should revert to the beginning of the ending diagonal relatively quickly. I don’t have an upside target for the SP500 (because of the possible ending diagonal) but I do have one for the SPX futures (ES).
The short story is that equities and currencies all seem to be heading for the same top tick (or pip) all together!
Now with SPX, if it’s a simple 5 wave ending wave (although I see subwaves in 3’s), it’s projecting a top at the previous 2nd wave (the truncation area). I explain the ramifications of this below (and in the video).
As I mentioned last week, the VIX has flashed a sell signal for equities, so a turn down is imminent.
There’s a lot of information in this post to digest. I hope I’ve made it clear what I’m expecting. I’ve been saying for some time that the markets are all moving in tandem as one (due to deleveraging debt worldwide) and I see everything lining up for the turn. I actually pointed this out last September.
It should be a very important week, one way or the other.
______________________________
Here’s a video overview of the market for Monday, April 11, 2016:
Market Report for April 11  |
 |
Make sure you zoom the video to full size with frame expander (arrows) in the bottom right hand corner and also set the quality to as high as your web connection allows. This is an HD quality video so the best viewing is at that level. |
_______________________________
The Charts Going into Monday.
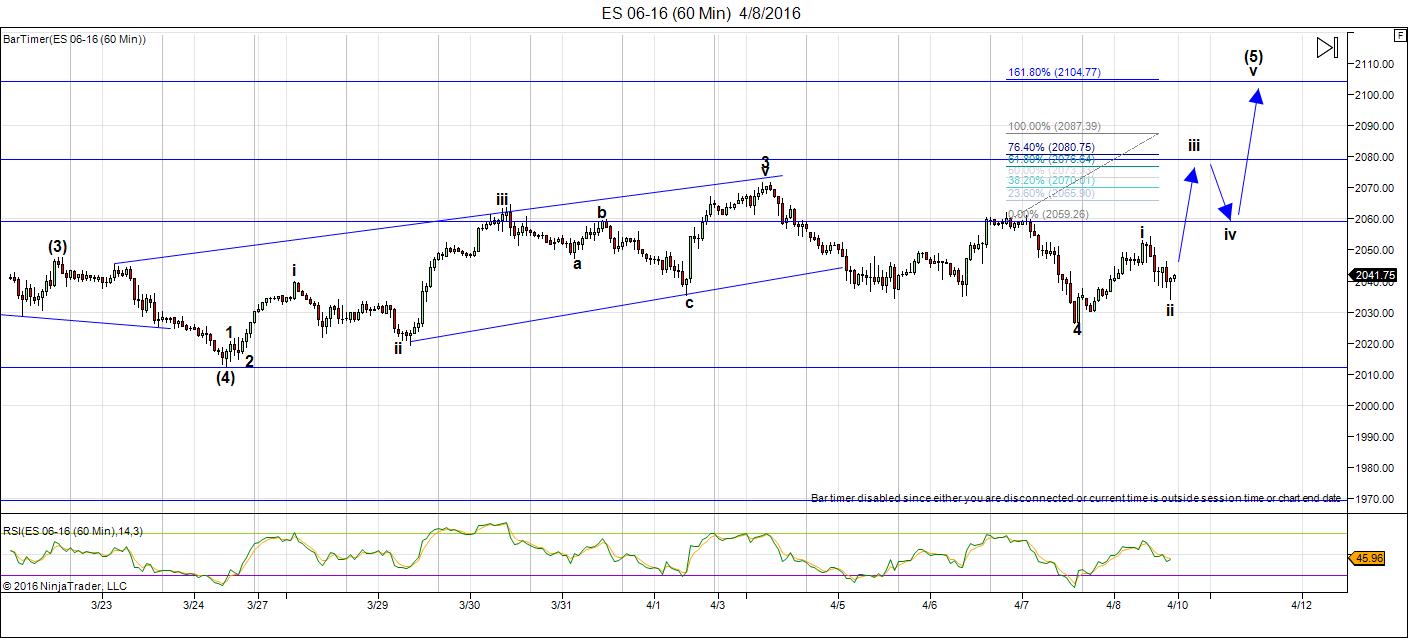
Above if the 60 minute chart for ES as at the above time. This final wave up looks to be in the expected five waves. I’ve revised the overall count structure for ES to align with the SPX. You can see we’ve done a what looks like a running triangle for first set of waves of the fifth wave, and we’re working on the final fifth wave up. We appear to have finished wave 1 up, 2 down, and are starting on wave 3 up. If it’s 1.618 X the length of wave 1, it should top at ~ 2080. The fifth wave is also usually 1.618 X the length of the first wave, and given a 4th wave of a 38% retrace, this would put the top at ~2105.
One of the keys to my projection is the fact that ES traced out a clear 5 waves up (wave i), which means that we should see a full five waves up to a new high. We’ve also had a second wave down to approx. the 62% retrace level. Wave 3 up should follow.
This is an important development, as I’ll explain in the next chart below.
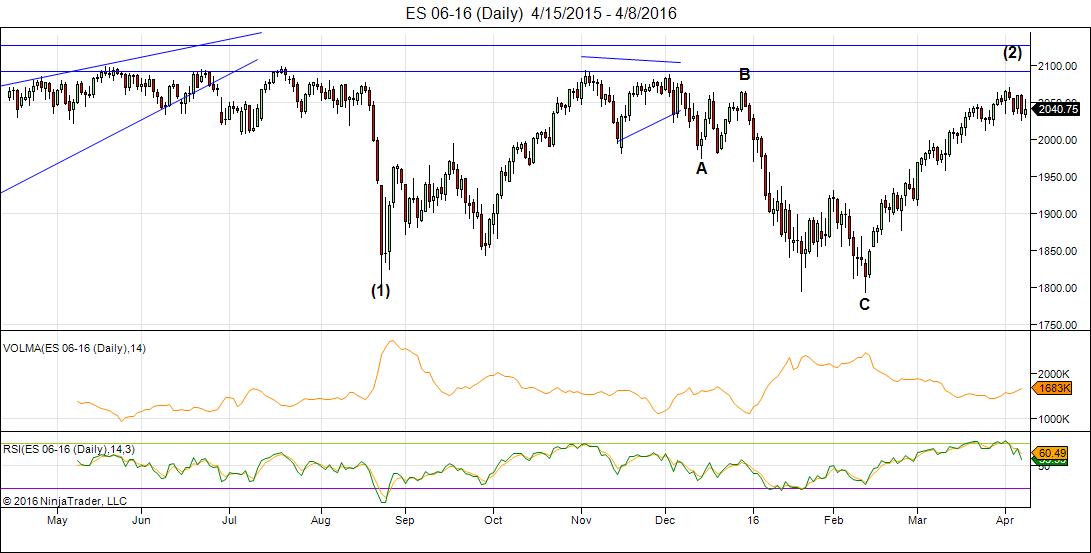
Here’s the important chart of the week. This is the daily chart of ES (SPX emini futures). You can see that the 2100 level (approx.) is the previous 2nd wave top. In bear markets, very often the second wave is a two-pronged affair and this seems to be the case here. It foreshadows an enormous third wave down. It also corrects out the truncation idea (which I was never all that comfortable with, because it left three waves down (in all the waves, not just the first wave)). It’s been very hard to reconcile the count, as anyone who’s been with me for a while knows.
My projection for a double second wave top makes the count and structure work perfectly, as it should.
What’s interesting is that the Nasdaq does not have the same issue. The Nasdaq traced out a double top (at the second wave level, where the SPX indices seemed to truncate) and so it does not have to correct to the previous high. In fact, it’s lagging. The Nasdaq always leads and it’s telling us that the path is down.
We will top very soon. I don’t know if it’s this week or not (we’ll know soon enough). There’s a cycle turn date this coming week (noted above) and another one at the end of April. One of these will be the turn point.
We’re coming up to a life-changing opportunity.
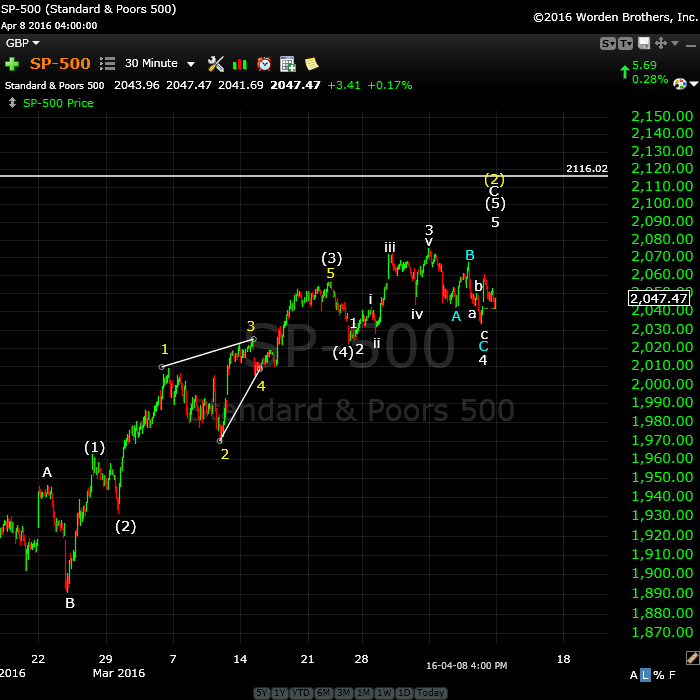
Above is a 30 minute chart of SPX. The final fifth wave is in the final stages. I don’t have an ending target, as this appears to be an ending diagonal. We may have one small down wave and then an up wave. The top will be sudden and should retrace to the start of the pattern (about 2022.oo).
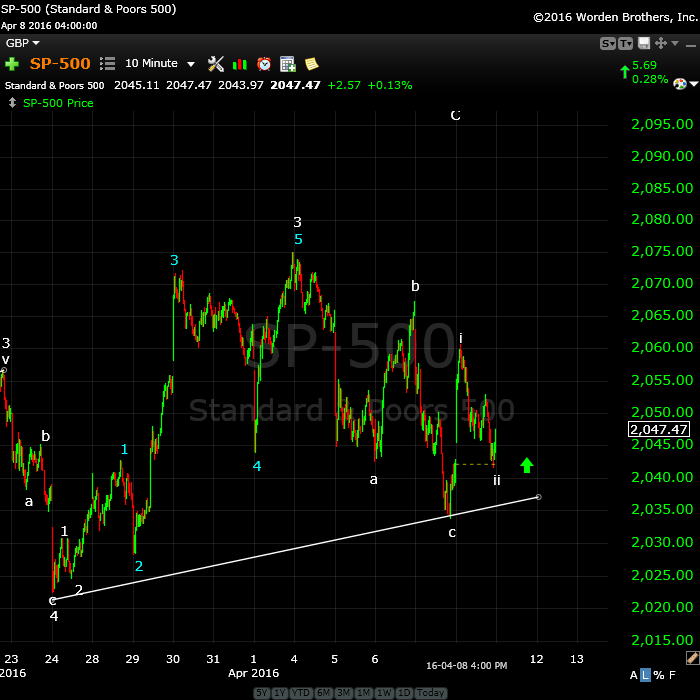
Above is the 10 minute chart of the SP500, so I can focus in on the wave structure of this final wave up. From the fourth wave bottom, we have a wave up in 5 waves. There is no overlap, so this suggests a simple 5 wave ending wave. However, none of the subwaves are in 5’s. They’re all in 3’s. Now, if you look at the most recent wave up (wave i on the right), you’ll find it’s also in 3.
These threes lead me to believe that we’re looking at wave 1 of an ending diagonal complete and that we’re working on the third wave up. OR … we’re going into a normal third wave, that interestingly enough (based on the length of the first wave) projects at top at 2120 (1.618 X the first wave), which is exactly the previous higher degree 2nd wave top (see my next chart below).
If this is an ending diagonal, this final wave will go up in three waves to a top and turn. If it’s a normal 5 wave ending wave, it will go up in 5 waves, of course.
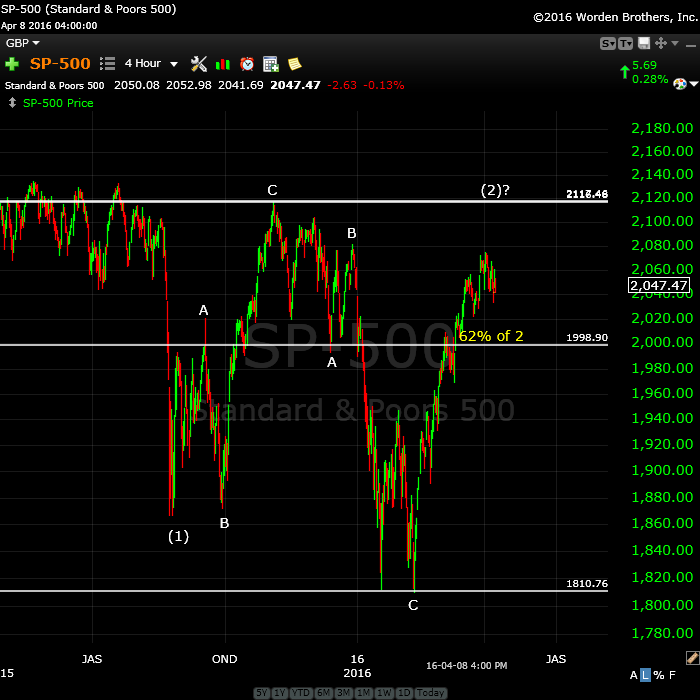
Above is the 4 hour chart of the SP500, showing the possible double 2nd wave top waiting to trace out. This would negate the “truncation” and create a spectacular EW textbook set up for a huge third wave down.
Second waves have few restrictions. The key rule is that they can not retrace to the previous top. They should retrace between 62 and 100% (but cannot hit the 100% retrace level).
It’s typical in a bear market for second waves to trace out a double prong (and ABC wave down in this case and a 5 wave structure up). The five wave structure, however, is not motive (subwaves won’t necessarily all be in “legal” 5 wave motive configurations).
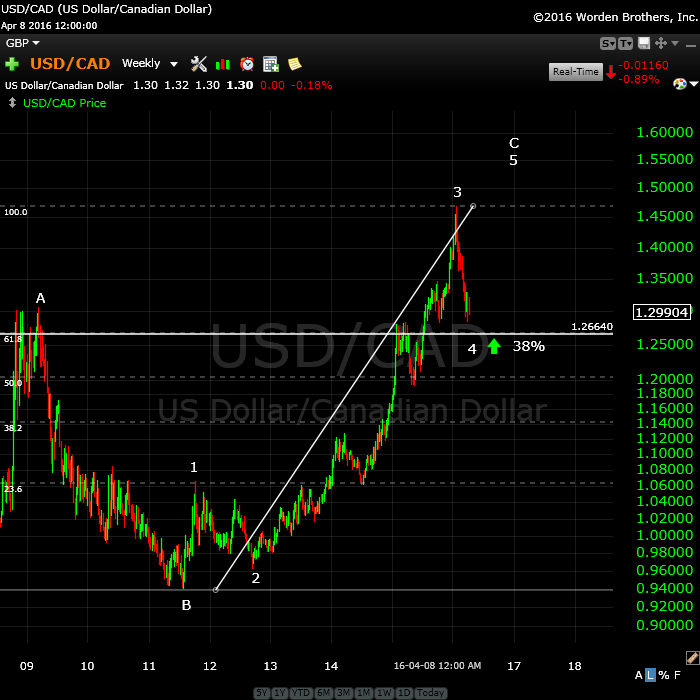
A Major Inflection Point: Above is the weekly chart of USDCAD. I have been following this for some time, and called the bottom of the third wave, expecting a retrace (although unsure as to how deep it would be).
The larger pattern is an ABC corrective wave, but the C wave is in 5 waves. We are completing the 4th wave of this pattern, which should reach the 38% retrace level (shown by the white line) before turning down into a fifth wave (similar to the euro charts below).
Once it turns and heads up, it will head up in a fifth wave to a new high, a very lucrative trade. The euro, Australian dollar, dollar, and Canadian dollar are at similar major inflection points.
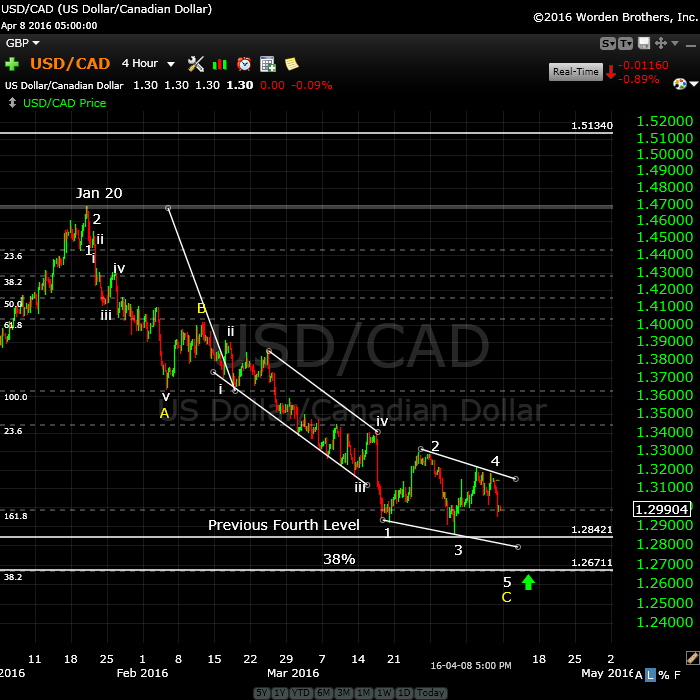
Above is a 4 hour chart of USDCAD. I have been watching this first wave down unfold and thought it had met its downside target, but it’s obvious we’re not quite done. Fourth waves retrace to the previous 4th (or 38%). They typically must reach at least 38% before reversing.
While we’ve reached the previous 4th wave level, the 38% level is slightly lower (lower white line). The pattern we’re in is an ending diagonal, which should do a “throw-over” (a spike down past the lower trendline), which would allow it to reach the 38% retrace level.
This currency should turn with EURUSD, the US dollar, and the US equities, as I’ve been mentioning for some time. In this case (currencies), we’re watching for the top pip—in the case of USDCAD, the bottom pip. It’s not far away.
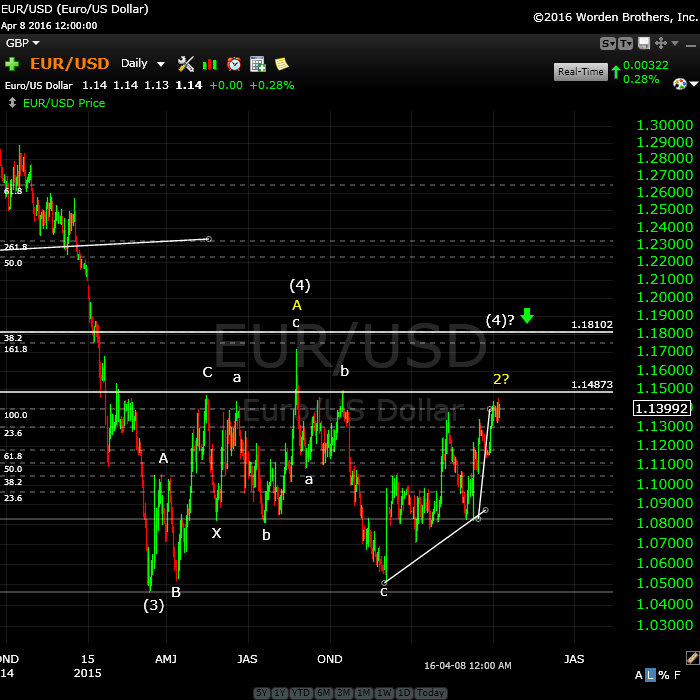
A Major Inflection Point: Here’s the daily chart of EURUSD showing the major corrective pattern from the low of March, 2104. I have been advocating for some time for a retrace to at least the 38% level, and I’m fairly sure we’re finally going to get it. Although I’ve been able to anticipate and call all the major turns, it was two weeks ago that the white C wave we’re in now turned decidedly corrective, as well. However, this current C wave should continue up to either the previous high (yellow A) or touch the 38% line and then turn down. Note that at that point, the white C wave would be exactly 1.618 X the white A wave.
On the chart, I’ve labelled my preferred top as (4)?. But I’ve also labelled yellow 2 (in case we don’t make the 38% level), although I now consider this a much lower probability.
The eventual turn (at either level) should send up down into a very large 5th wave. It should turn in tandem with the US equities.
The US dollar should do the same thing but in the opposite direction (up).
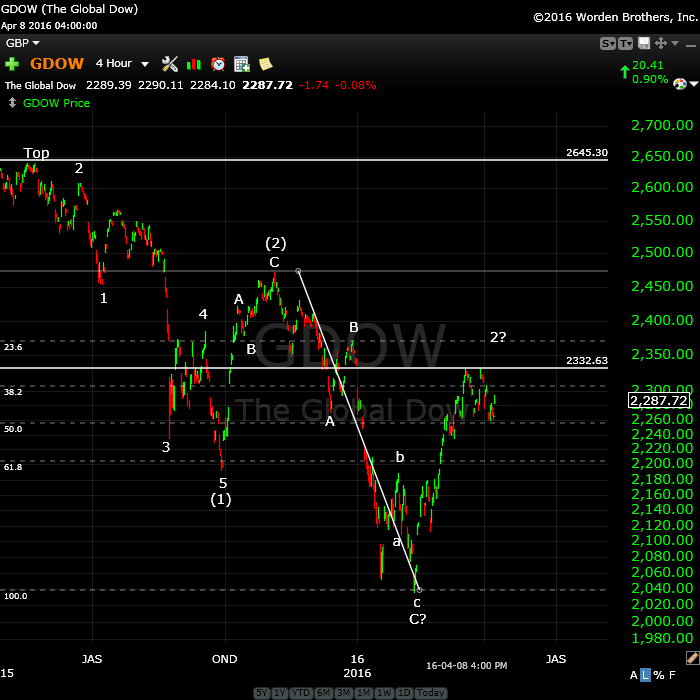
Above is the daily chart of GDOW (Global DOW) showing the current count. It looks to me like we’re tracing out a second wave after an ABC lower part of the wave. I think we have one more small leg up. This wave will likely stop very close to the 23.6% retrace level (or 76.4%) from the bottom of the wave. This should lead to a very large and strong third wave down.
I do not see a path to a new high for GDOW and, in my opinion, this strongly lowers the probability of a new high for the main US indices.
________________________
First Wave Down – What to Watch For
This weekend we’re dangerously close to a top of a second wave (in the fifth of the fifth, with an ending diagonal pattern).
What we’re looking for to confirm a turn is a motive wave down in 5 waves.
Because we have an ending diagonal, the first wave will likely drop to the previous fourth, which is also the beginning of the ending diagonal pattern (~2022). After that, we should get a second wave that will retrace in 3 waves about 62%. That’s the preferred EW entry point. So don’t feel you have to rush in. There’ll be a much better opportunity at the second wave level than at the top and the risk is substantially reduced.
__________________________


if the dow goes down to 17885 ill consider it as a wave 3 of 3
I agree peter
it looks like a 1 2 I set up with wave II either forming now
or will be complete in the morning sticking a few people
with stocks once the options settle .
I knew i would regret this yet so far im sticking to my rules
I don’t like the look of it any more. I’m still short ES but it’s lost a lot of steam and the waves are looking questionable.
SPX still looks good.
Odd day today
From today’s top using a 3 minute chart we have had a high every 13 bars
20 minutes before the cash closing is the next timeline based on that
i don’t like that set up however even though im bearish .
the best time counts are not high to high to high .
the best counts are low to low to high .
low to low to low counts are also not a good thing to trade with
. a high to high to low or a low to low to high are the best set ups
can be weekly daily or intra day .
im flat and will watch the 17944 level as well as the 17977 level .
if the market stabilizes over the next few minutes id look for a bounce
the count can be considered 3 waves down from todays high
both declines 1 2 3 4 5 ( 1 or A ) wave b or 2 an expanded flat
and wave 1 of 3 or C was equal in points to wave 1 or a .
its to soon to call the top in place ( even though i think it is )
im done for today most likely yet a trade 20 minutes before the close
is an option
Joe
The only ‘thought’ I have regarding this down wave is that it doesn’t feel like it’s a reversal of an Ending Diagonal. I’ve been looking at both the DJIA and the S&P.
Here is today’s DJIA with the arrow showing the start of the current ‘up’ wave. If this is the ED that we think it is then there is one more ‘up’.
http://postimg.org/image/veghb9xpf/
I think you’re right purvez. One more up. We just broke out to the top of the triangle. Maybe we’ll set up for a morning top.
I’ll post an ES chart at the close where it fairly obvious.
Yes, please. Thx. It’s always good to see things from someone else’s perspective.
Purvez,
After looking at a lot of charts, I’m going to wait until the morning. I need to see what futures do tonight. There are too many options at the moment, none of which make a whole lot of sense. I think we have further to go up, but we need a larger correction. Let’s see if we get it tonight.
the set up option is 20 minutes before the cash close not the futures close
ES and SPX look to be in 4th wave triangles.
1 minute chart.
Looking to get short near the open tomorrow
the short term time line flipped which implies
the next turn near the open tomorrow .
Joe, you mentioned ….’the short term time line flipped’. What does that refer to please? I’m always curious about indicators that I don’t know / understand.
Thx in advance.
anyone like lucky 777s?
4./15/16 is 7 mos 7 wks 7 days since 7.20.15 top
4/22/16 is 7yrs 7mo 7 days since lehman collapse
you know who likes 777s? lagarde and the IMF
https://www.youtube.com/watch?v=QYmViPTndxw
Haha Scott, ty for mentioning it! 🙂
Cheers,
W
i like this after hours low print on $spy
http://www.nasdaq.com/symbol/spy/after-hours?page=2
100 shares traded at 5:11:47 pm at 185.63
Hi Peter
Using a very broad brush looking at the $UTIL index Monthly chart .
the low in the year 2002 was near the 1987 year lows .
the wave count im wondering since 2002 is an ending diagonal ?
wave 3 was less in points than wave 1 and wave 5 ( where we are now )
has more upside yet wave 4 overlapped wave 1 .
oct 1987 to oct 2002 was 15 years , adding 15 year is the oct nov 2017
time frame so plenty of time to think this index through yet as of right now
im thinking it can run up to around 791 and change ( its at 657 now )
that’s about 20 % more upside and a reasonable target .
from that high the 2002 lows become the downside target at a minimum .
time wise though i keep seeing late 2017-mid 2018 and a major top
in all the indexs . the decline from either now or june 2016 into jan 2017
will most likely hold above the lows already printed this year in jan-feb
Joe
Joe,
I am in agreement with you on the final bottom timeline as in end 2017 to mid 2018.
Reason: solar cycle 24 is shaping up to be very short 9 years compared to 11years.
SC 24 started in Dec 2008 + 9years = Dec 2017 .
Note current sunspot is about 30 , way below the mean line of 50-60 for it to be normal to be an average 11 year SC cycle. Need to monitor next few months.
If next few moths follow the new mean of 30-40, we are heading in solar min Dec17.
My 2cents:
somewhere this year we get to bottom of w3 and and end 17 is bottom of w5.
Vince
Btw, SC 25 is shaping up very weak which strongly backs Peter’s deflationary view of winter cycle is to come if not already started.
Thanks, Vincent
Some of this great longer term info would be great posted in the forum where it will be accessible for much longer. Just a thought 🙂
Purvus
the 13 bar swings i was looking at today is what i was talking about
that flipped . i mentioned i saw a turn 20 minutes before the close
and the market fell into that period then bounced and dropped
then we bounced into the close .
i wanted to see a very short term high 20 minutes before the close
yet it wasn’t a high . it kind of worked but it didn’t nail the turn
and at that 20 minute period the market produced a very short term low .
if a time line fails its best to call it a failure .
the next timelines are in the first 1/2 hour tomorrow .
the indicators have not changed and still are signalling a top very very close
by if not already in place .
very short term timelines are best used for entry or exits but not for
long term trading . 1 to 3 minute charts are extremely short term charts
daily and weekly and monthly charts is my preference for position trades
same holds true for indicators . 10 and 20 day indicators are the longer term
i use , the 5 day is used only as a signal for the 10 and 20 day indicators .
my trading methods are simple for me because i have developed them over
a long period of time . it seems complex on the surface but it isnt .
the adv decline line and the trin are very simple indicators to work with and
have a higher percentage success than anything else i have researched .
nothing is perfect .
hope that answers your question
Joe
Hi Joe
Thanks for the explanation. I ‘think’ I get the idea about high to high to low etc. but it has raised some further questions:
1. What’s the significance of 13 bars?
2. Why are 20 mins before closing and half hour after opening the only timelines to consider?
I understand your point about the use of short period charts vs longer period charts but my main reason for asking is, because I trade off 5 min bars on the DJIA with the intention of making 50 points a day, anything that can help with that is of great interest to me.
Thanks for taking the time to explain.
Over the weekend every thing changes; too much to sum it all up. Best guess is a high on Monday.
This week we had moon declination north and a quarter. That was positive. But now It’s gone. 18/19 very strong gann dates. Crashes come after a quarter and after a square.
Have a nice weekend; next week will be fun.
Thanks, Andre’! As a student of declination I agree, next 12 days will have a different complexion than the previous 7.
I just posted a smattering of charts. I think we have more up. We corrected enough to create a small fourth wave, which suggests another wave higher.
And as I posted this NQ took off!
I also note that USDCAD has backed off as I was expecting and is set up for another run at the bottom. I’m expecting one more leg to finish the corrective wave it’s in (another ending diagonal) as per the chart further down on the post. EURUSD has done the same thing and been sitting waiting for a few days. It looks ready to move this morning.
The wave down this morning in SPX, COMP, DOW, etc. was almost a perfect motive wave (DOW not so much). Retraces get closer and closer to the right look as we get closer to the top.
The problem is with futures, which don’t sport the same look.
GDOW has also hit my target. Everything seems to be slowly lining up for a turn.
working very hard at self discipline to stop myself from shorting too early…..i’m waiting and waiting….
i am amazed how the inverse head and shoulder (or if you prefer W pattern) suggested this topping area, depending upon where you define your choice of neckline. es daily chart.
http://invst.ly/1j3mc
perhaps we now have a descending wedge, morphing into a triangle. es 15 min chart, which I am sure you all are following on your own screens.
http://invst.ly/1j3nu
time will tell….. good luck!
Let’s see if ES can retest pre-mkt low 2068.50 today before close.
Anthony Hopkins: Here’s an odd note. I just got a call from a guy locally here in Calgary who’s in the construction business and needs some cash short term. He has a jacket that Anthony Hopkins wore in Legends of the Fall (the movie). It was shot here originally. I just thought I’d post in case anyone is interested.
If anyone is, let me know and I’ll get the two of you hooked up via email.
The plot thickens: JPMorgan and the Fed
http://www.zerohedge.com/news/2016-04-15/fed-sends-frightening-letter-jpmorgan-corporate-media-yawns
Valley,
How does it looks for next week, we didn’t have a sell off and full moon on 22nd will probably make the price go up,so how are you positioning.
Hi Bill,
I got crushed this week on falling tides/post new moon/seasonal short. Next week I will be in cash waiting until the end/middle of the week. Then will look to short into early May. Saturn in Sag may portend 18 months of financial mania in all asset classes. So note to self short with small size.
Interesting post on the market: http://www.zerohedge.com/news/2016-04-15/worlds-most-bearish-hedge-fund-has-terrible-march-goes-even-shorter
Equities should be at the bottom of the fourth now. They completed their C waves, so they’re 1.6 the A waves, which is typical.
I don’t know that we’ll get much above the previous high, but we’ll see. I’ve been short USDCAD again since early morning and it should keep dropping to fulfill the final leg of the ending diagonal, while equities head up in the final subwave.
I wrote that line improperly about the A wave length. Typically you can measure the A wave and then the entire ABC wave is 1.618 X the length of the A wave. This relationship is the common one (almost all the time) in a corrective wave, particularly when it’s a fourth wave.
Does that count for Time as well as Price?
I’m just talking price. In this case (emini futures), it obviously doesn’t work for time. I don’t know if it does in any other instances. It’s a very common price relationship between a and c wave, though.
So in the second wave, for example, I measure the length of the first wave with my fib tool and place a horizontal line of the 62% retrace level. Then once the first corrective wave down is in and we’ve had a second wave that’s retraced about 62%, then I look at the extension of the fib tool from the measurement of the first corrective. In a large majority of the cases, the two horizontal lines will mark the same spot. The extension fib tool will meet the 62% retrace level at either the 1.6 or 2.6 fibonacci extension level. I can be pretty sure that the second wave will extend to that point and then turn back up.
I do the same exercise for the fourth wave.
Chart example for the recent fourth wave in ES https://worldcyclesinstitute.com/fourth-wave-retrace/
Thank you.
At the end of the session, US indices are in the third wave (except for the Nasdaq, which has a different configuration—likely a final wave in 3). So far, it looks like we could be an ending wave up in 5 waves in the other indices and futures. The first wave up appears to be in 5 waves. We might be looking at a double top.
Third wave target (SP): 2087, (DOW): 17,950
Currencies are working their way to the targets mentioned earlier this week. We could see a resolution as early as Monday.
The monkey made me flying last week I also expected a sell off but instead we rallied
Oil has saved the Opex?
Next week will be interesting to watch what oil and the markets will do
I m planning to stay short at least in to the full moon this Friday.
Nice weekend.
PALS suggested last week was down and market rose (as Peter Temple predicted).
PALS suggests better outlook until middle of week, with bearish outlook Thursday into following week. Given the rise last week, I will continue a bearish stance of small size in US equities, and will add to size if market rises 1 percent higher. Looking for bottom on May 3.
Just a ‘heads up’:
I trade through IG Index and they make a market on Sunday for 3 indices. One of which is the DJIA. Currently they are quoting 84 points down from Friday. I’ve not looked at the news to see whether that has any influence by to hat is quit a big move. Usually it’s a point or 3 either side of Friday’s close.
If I find some news then I’ll report back.
*but that is quite a big move. (Is what should have appeared instead of some ‘autocorrect’ rubbush)
New post: https://worldcyclesinstitute.com/the-second-coming/
Hi,
Could you please help me understand the candlestick wicks in relation to elliot wave counting. I am struggling to count the fractals properly. I believe understanding candlestick wicks will help me count the waves properly. Please guide. It would be of great help. Requesting you to send me a mail if possible. Thanks
I’ve never heard of candlesticks having any relationship to EW. Elliott never mentioned and, in fact, they were a well kept Japanese secret until they were introduced to the West in the latter part of the 1980s. Elliott developed the principle in the 1930s.
What time does Peter usually post his comments on Sunday’s? I am really new to the site! Regards-EP
It will be later tonight, later than usual.
This website is for educational purposes relating to Elliott Wave, natural cycles, and the Quantum Revolution (Great Awakening). I welcome questions or comments about any of these subjects. Due to a heavy schedule, I may not have the time to answer questions that relate to my area of expertise.
I reserve the right to remove any comment that is deemed negative, is unhelpful, or off-topic. Such comments may be removed.
Want to comment? You need to be logged in to comment. You can register here.