
Update Friday, April 15, Before the Open
On a small term scale, I think we’re set up in a second wave this morning in SPX and other indices, which means more up. We only corrected a little bit. We appear to be in an ending pattern, but what is it is questionable in some of the indices. I can see possible triangles and ending diagonals ….
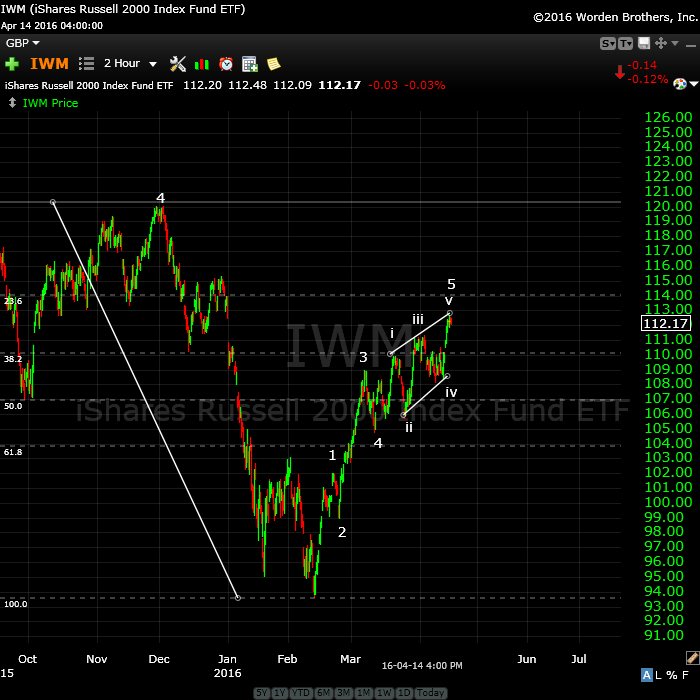
Above is a two hour chart of IWM (Russell 2000). It’s traced out a very obvious ending diagonal and just has the throw-over to complete. This is a small caps stock base and should give a pretty good indication of what’s happening overall.
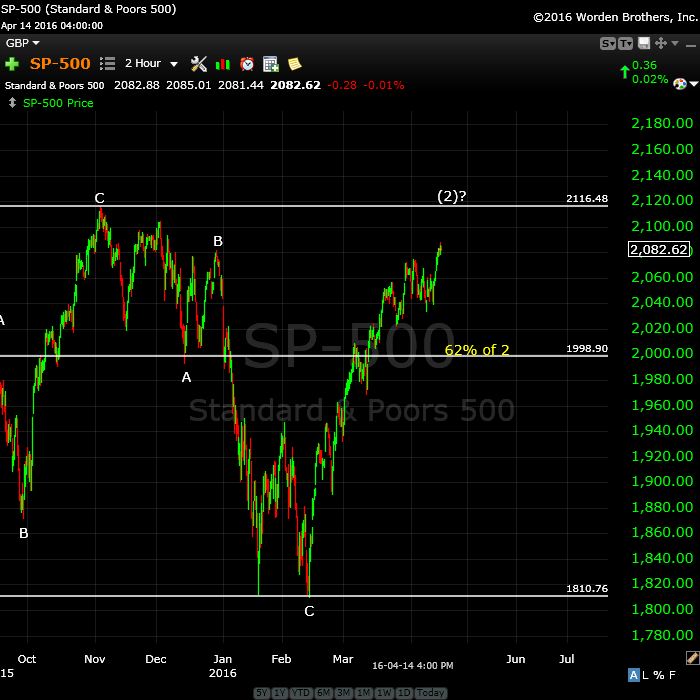
Here’s the two hour chart of the SP500 so show how close we are to the double second wave top, which I think is the ultimate target.
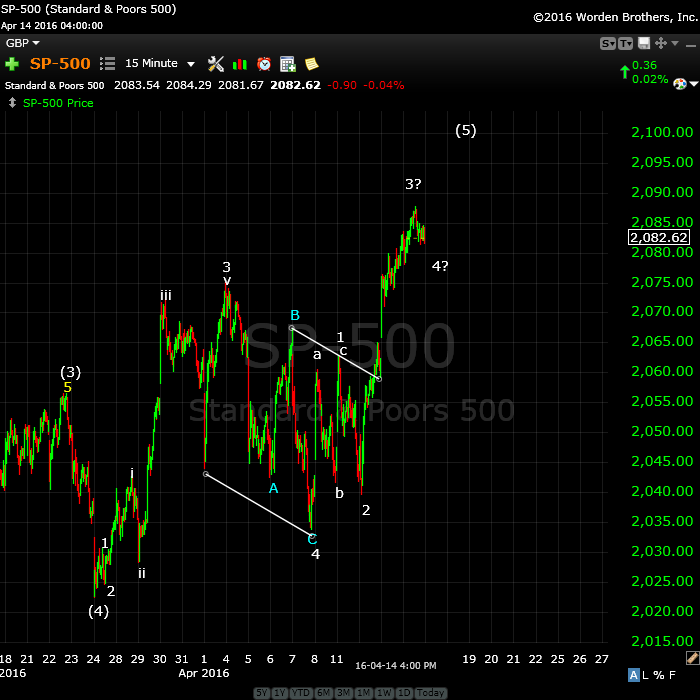
Above is the 15 minute chart of the SP500. I can see the triangle here, too, except that I’ve kept my original labels, which would suggest an ending diagonal was perhaps in a throw-over.
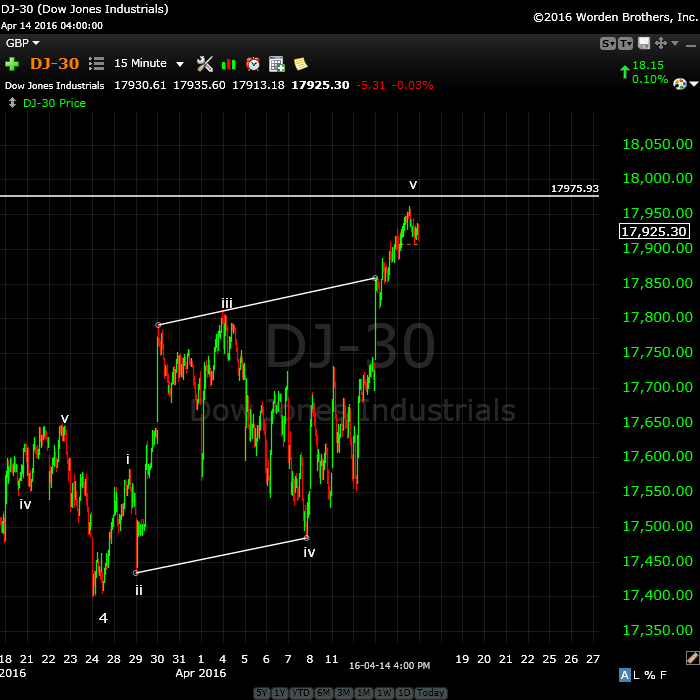
Above is the 15 minute chart of the DOW. I’ve drawn what could be an unsatisfying triangle with a final thrust. I can find this same pattern in the other indices, most notably the Nasdaq.
Note that just about everywhere I look at individual stocks, we’re in huge second and fourth waves spikes. This whole market is about to turn.
________________________
Update Thursday, April 14 11:50AM
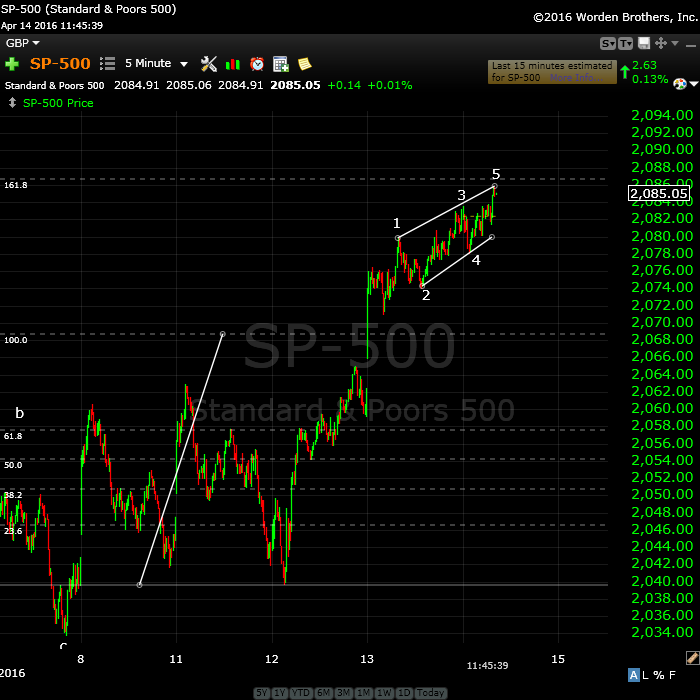
Above is 5 min chart of SPX showing the small ending diagonal being traced out.
___________________________
Update, Wednesday, April 13, ~12:20PM EST
Revised chart of ES showing the ending diagonal:
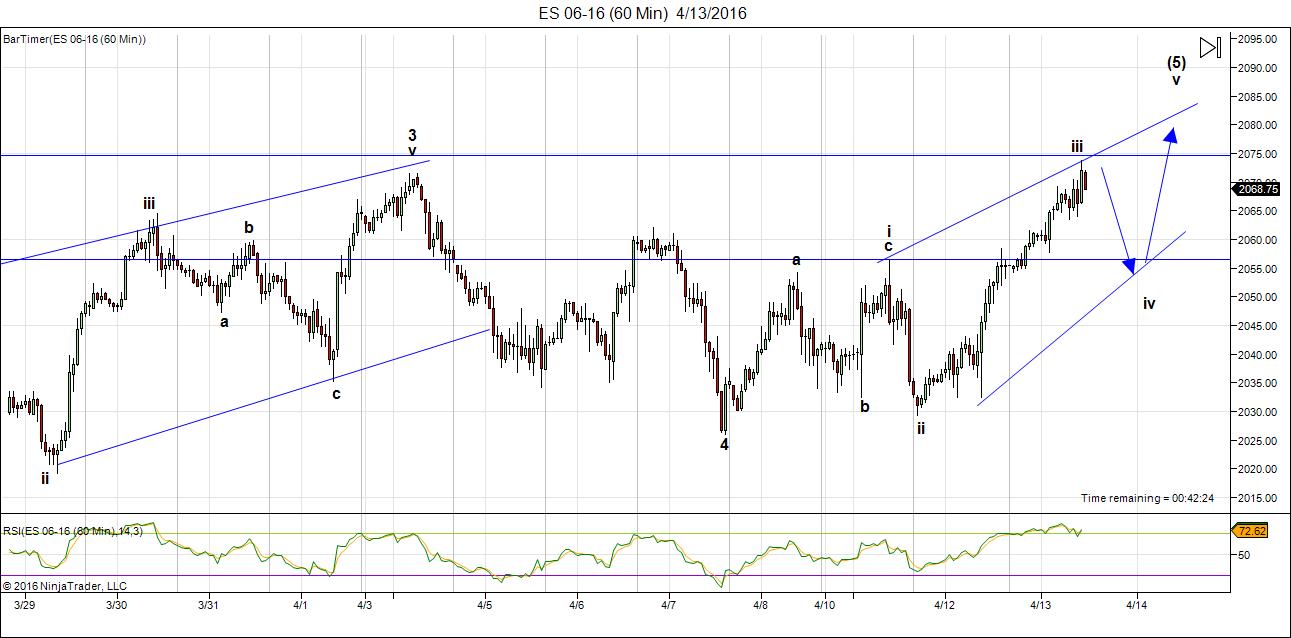
Above is the 60 min chart of ES (SPX futures). ES is in an ending diagonal, not a normal 5 wave ending wave and here’s why:
Previously, I had labelled the wave up from 4 on the chart ( from ~2025) as wave 1. That was fine, as it appeared to be in five waves. Then we turned down in a b wave and up to a new high in a c wave. This configuration now makes the first wave up a 3, not a 5. So, it’s obviously not a motive wave. It now becomes wave 1 of an ending diagonal. Wave iii on the chart is a 3, as well. You can see the double spikes down near the bottom of wave iii, but the fourth wave of that wave iii, although there, is really small. So this wave has the appearance of a 3 … and that makes it a 3 in EW lingo.
Now we’ll have a wave iv down, which should overlap wave i. So while I set a target for this wave iv of 2058, it will likely go a little lower so it will overlap wave i.
Hope this makes sense. It’s a good lesson on what to look for in determining patterns and how a 5 can turn into a 3.
__________________________
Update, April 12, 2016, Before the Open
Futures have now completed the first wave up, the second wave down, the first wave of the third wave, and the second wave of the third. The march to the top tick continues.
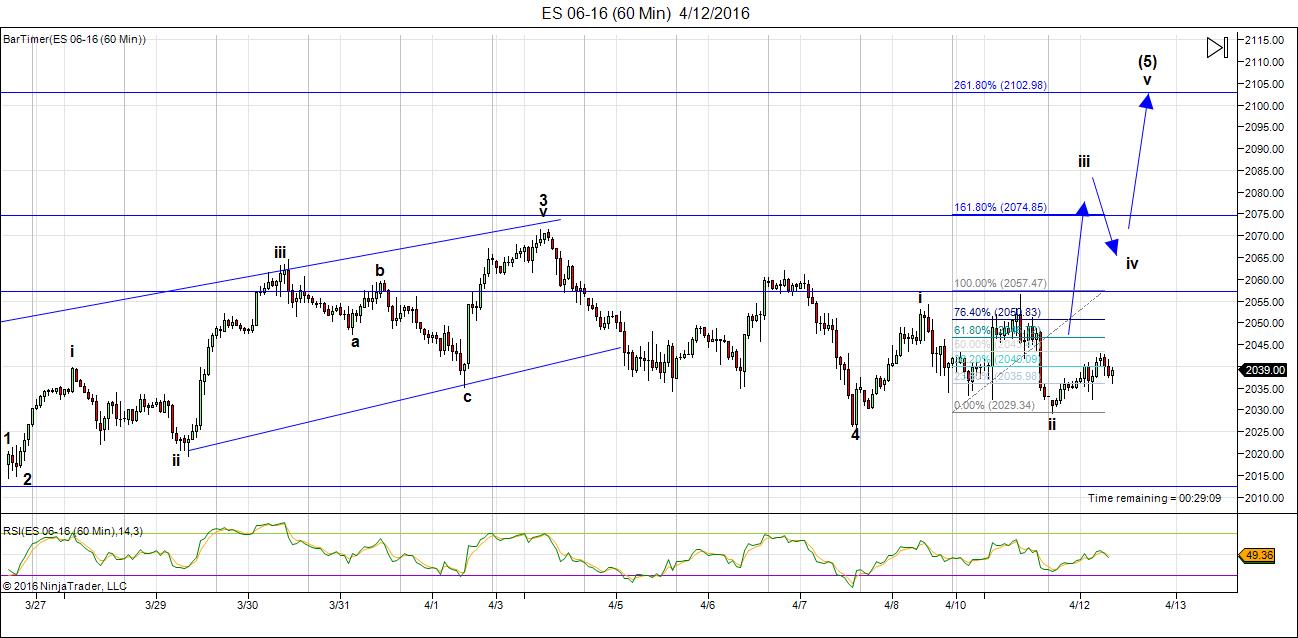
Above is the 60 minute chart of ES (SPX futures). You can see the progress on the count. We’ve losing some steam as the lower the retraces go, the lower the final target is. The waves up from here will determine where we eventually end up. Typically in a final wave, they tend to get progressively shorter as the pattern unfolds. We’ll have to wait to see what happens. If the market drops below 2012, (the previous fourth wave) the chance of a new high will diminish greatly.
___________________________
Original Post: We’re now looking for the top tick (or pip, if you’re focused on currencies). I think we’ll see it this week.
In any event, this 2nd wave is almost over. The next cycle turn date is April 13,14,15 for US equities.
We’re expecting some sort of geopolitical (or financial) event this week. There’s lots going on.
- Italian banks are on the verge of defaulting, Greece’s problems are beginning to surface again.
- Yellen has called for a special meeting with Obama.
- The US Congress is supposed to pass a new budget by April 15, but nobody is budging and there’s no plan.
The dollar controls the market and it’s at a major turning point. Watch it closely for the signal of a turn down in equities. (More on this in the video).
The direction is still up. But not for that much longer.
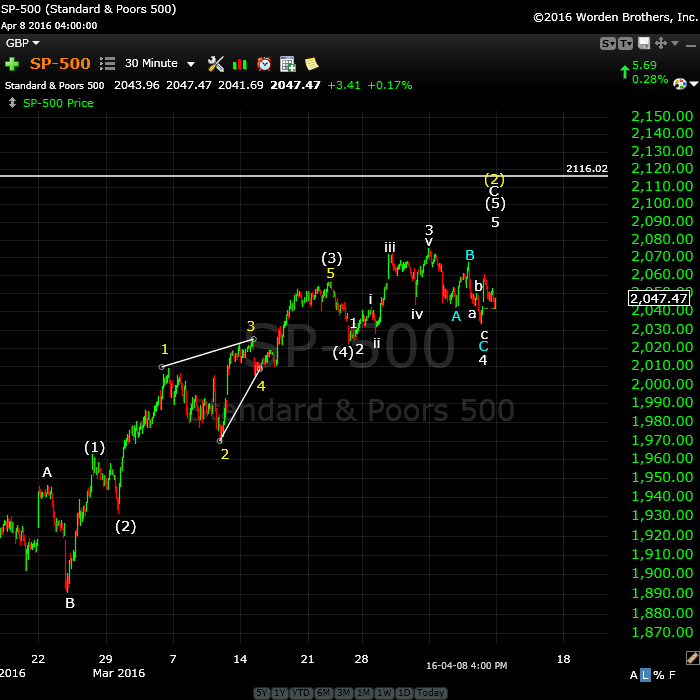
We’re still in the the final fifth wave of the C wave. The structure of the move up in the SP500 is questionable. I’m going with the start of an ending diagonal, as I explain in the chart below and in the video. While we may see a spike in the indices in this fifth of fifth wave (the throw-over), it should be short-lived and I would expect a dramatic turn down, with waves that should revert to the beginning of the ending diagonal relatively quickly. I don’t have an upside target for the SP500 (because of the possible ending diagonal) but I do have one for the SPX futures (ES).
The short story is that equities and currencies all seem to be heading for the same top tick (or pip) all together!
Now with SPX, if it’s a simple 5 wave ending wave (although I see subwaves in 3’s), it’s projecting a top at the previous 2nd wave (the truncation area). I explain the ramifications of this below (and in the video).
As I mentioned last week, the VIX has flashed a sell signal for equities, so a turn down is imminent.
There’s a lot of information in this post to digest. I hope I’ve made it clear what I’m expecting. I’ve been saying for some time that the markets are all moving in tandem as one (due to deleveraging debt worldwide) and I see everything lining up for the turn. I actually pointed this out last September.
It should be a very important week, one way or the other.
______________________________
Here’s a video overview of the market for Monday, April 11, 2016:
Market Report for April 11  |
 |
Make sure you zoom the video to full size with frame expander (arrows) in the bottom right hand corner and also set the quality to as high as your web connection allows. This is an HD quality video so the best viewing is at that level. |
_______________________________
The Charts Going into Monday.
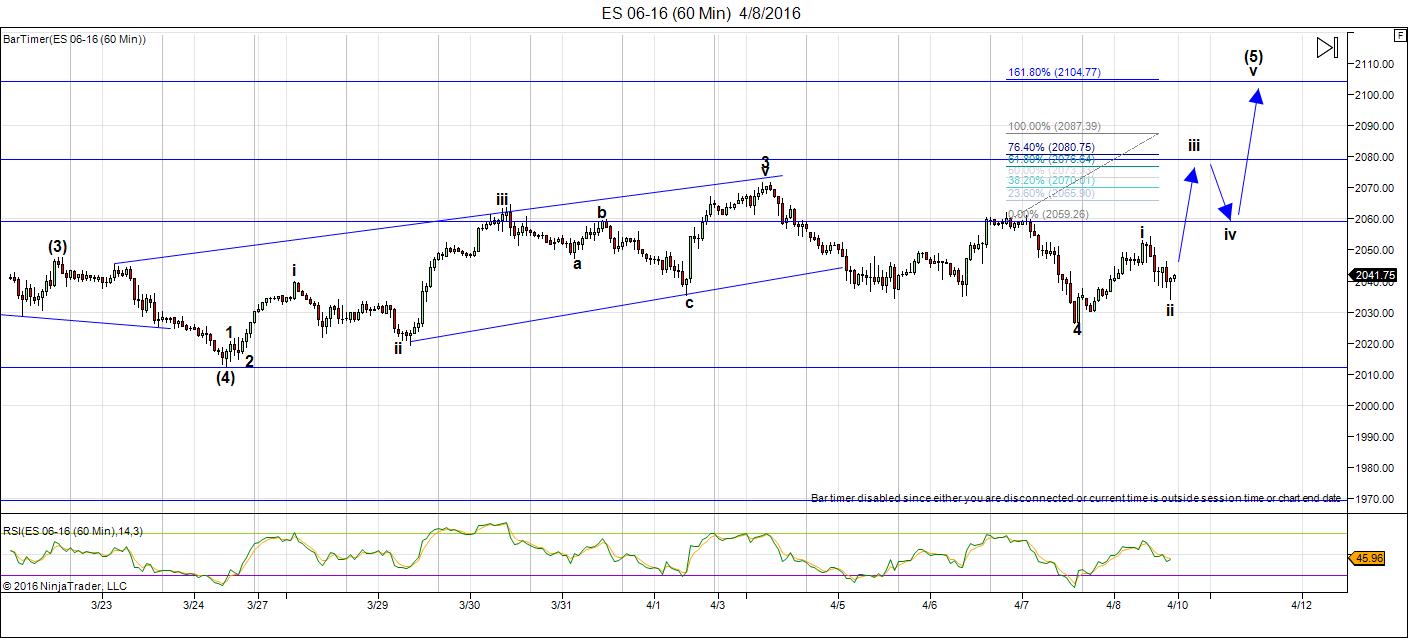
Above if the 60 minute chart for ES as at the above time. This final wave up looks to be in the expected five waves. I’ve revised the overall count structure for ES to align with the SPX. You can see we’ve done a what looks like a running triangle for first set of waves of the fifth wave, and we’re working on the final fifth wave up. We appear to have finished wave 1 up, 2 down, and are starting on wave 3 up. If it’s 1.618 X the length of wave 1, it should top at ~ 2080. The fifth wave is also usually 1.618 X the length of the first wave, and given a 4th wave of a 38% retrace, this would put the top at ~2105.
One of the keys to my projection is the fact that ES traced out a clear 5 waves up (wave i), which means that we should see a full five waves up to a new high. We’ve also had a second wave down to approx. the 62% retrace level. Wave 3 up should follow.
This is an important development, as I’ll explain in the next chart below.
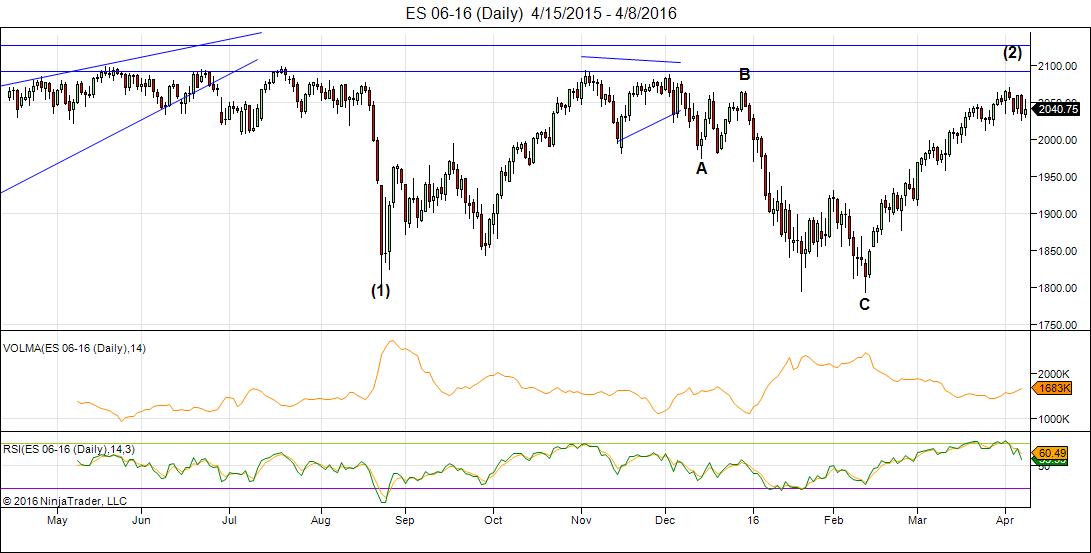
Here’s the important chart of the week. This is the daily chart of ES (SPX emini futures). You can see that the 2100 level (approx.) is the previous 2nd wave top. In bear markets, very often the second wave is a two-pronged affair and this seems to be the case here. It foreshadows an enormous third wave down. It also corrects out the truncation idea (which I was never all that comfortable with, because it left three waves down (in all the waves, not just the first wave)). It’s been very hard to reconcile the count, as anyone who’s been with me for a while knows.
My projection for a double second wave top makes the count and structure work perfectly, as it should.
What’s interesting is that the Nasdaq does not have the same issue. The Nasdaq traced out a double top (at the second wave level, where the SPX indices seemed to truncate) and so it does not have to correct to the previous high. In fact, it’s lagging. The Nasdaq always leads and it’s telling us that the path is down.
We will top very soon. I don’t know if it’s this week or not (we’ll know soon enough). There’s a cycle turn date this coming week (noted above) and another one at the end of April. One of these will be the turn point.
We’re coming up to a life-changing opportunity.
Above is a 30 minute chart of SPX. The final fifth wave is in the final stages. I don’t have an ending target, as this appears to be an ending diagonal. We may have one small down wave and then an up wave. The top will be sudden and should retrace to the start of the pattern (about 2022.oo).
Above is the 10 minute chart of the SP500, so I can focus in on the wave structure of this final wave up. From the fourth wave bottom, we have a wave up in 5 waves. There is no overlap, so this suggests a simple 5 wave ending wave. However, none of the subwaves are in 5’s. They’re all in 3’s. Now, if you look at the most recent wave up (wave i on the right), you’ll find it’s also in 3.
These threes lead me to believe that we’re looking at wave 1 of an ending diagonal complete and that we’re working on the third wave up. OR … we’re going into a normal third wave, that interestingly enough (based on the length of the first wave) projects at top at 2120 (1.618 X the first wave), which is exactly the previous higher degree 2nd wave top (see my next chart below).
If this is an ending diagonal, this final wave will go up in three waves to a top and turn. If it’s a normal 5 wave ending wave, it will go up in 5 waves, of course.
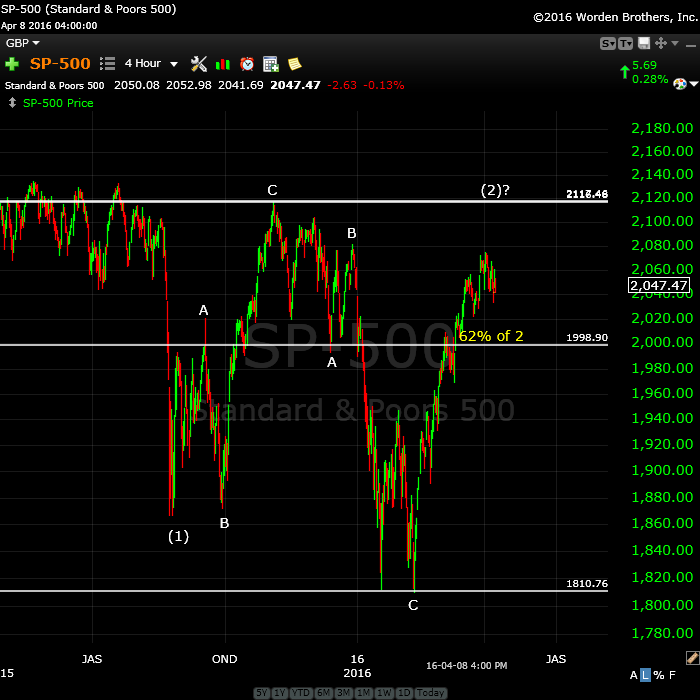
Above is the 4 hour chart of the SP500, showing the possible double 2nd wave top waiting to trace out. This would negate the “truncation” and create a spectacular EW textbook set up for a huge third wave down.
Second waves have few restrictions. The key rule is that they can not retrace to the previous top. They should retrace between 62 and 100% (but cannot hit the 100% retrace level).
It’s typical in a bear market for second waves to trace out a double prong (and ABC wave down in this case and a 5 wave structure up). The five wave structure, however, is not motive (subwaves won’t necessarily all be in “legal” 5 wave motive configurations).
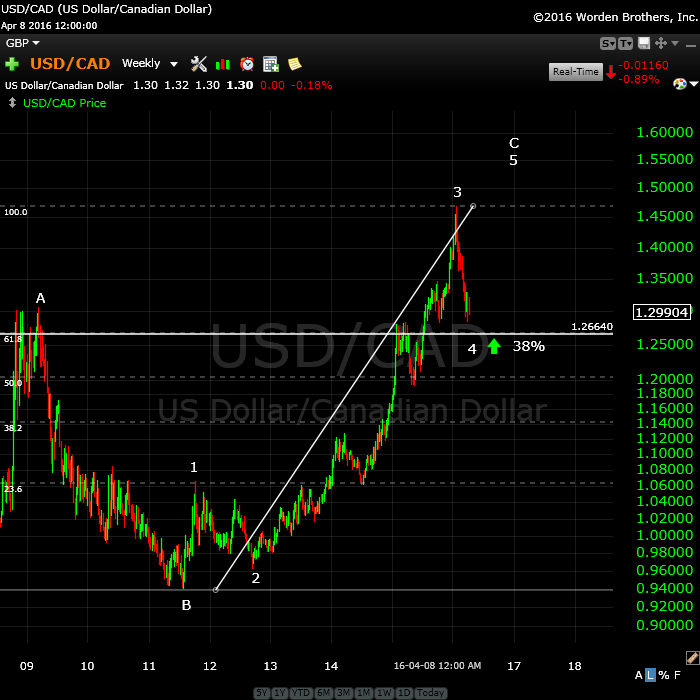
A Major Inflection Point: Above is the weekly chart of USDCAD. I have been following this for some time, and called the bottom of the third wave, expecting a retrace (although unsure as to how deep it would be).
The larger pattern is an ABC corrective wave, but the C wave is in 5 waves. We are completing the 4th wave of this pattern, which should reach the 38% retrace level (shown by the white line) before turning down into a fifth wave (similar to the euro charts below).
Once it turns and heads up, it will head up in a fifth wave to a new high, a very lucrative trade. The euro, Australian dollar, dollar, and Canadian dollar are at similar major inflection points.
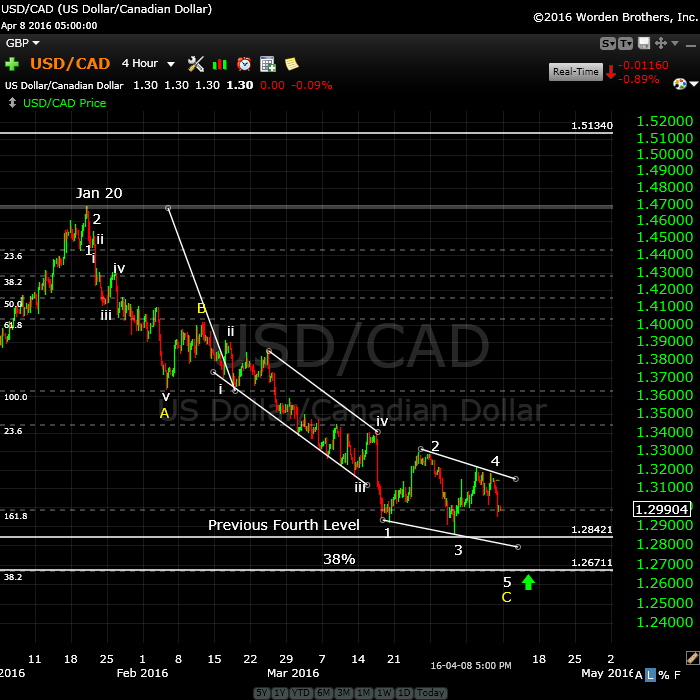
Above is a 4 hour chart of USDCAD. I have been watching this first wave down unfold and thought it had met its downside target, but it’s obvious we’re not quite done. Fourth waves retrace to the previous 4th (or 38%). They typically must reach at least 38% before reversing.
While we’ve reached the previous 4th wave level, the 38% level is slightly lower (lower white line). The pattern we’re in is an ending diagonal, which should do a “throw-over” (a spike down past the lower trendline), which would allow it to reach the 38% retrace level.
This currency should turn with EURUSD, the US dollar, and the US equities, as I’ve been mentioning for some time. In this case (currencies), we’re watching for the top pip—in the case of USDCAD, the bottom pip. It’s not far away.
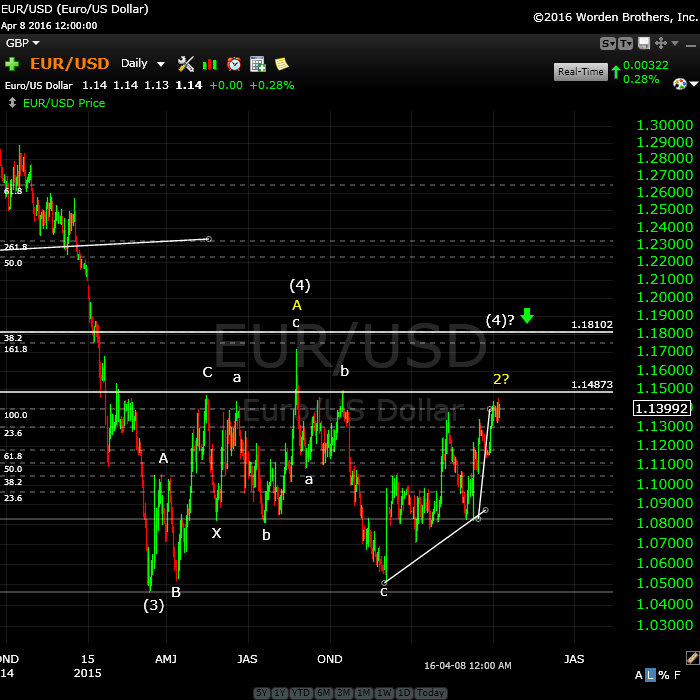
A Major Inflection Point: Here’s the daily chart of EURUSD showing the major corrective pattern from the low of March, 2104. I have been advocating for some time for a retrace to at least the 38% level, and I’m fairly sure we’re finally going to get it. Although I’ve been able to anticipate and call all the major turns, it was two weeks ago that the white C wave we’re in now turned decidedly corrective, as well. However, this current C wave should continue up to either the previous high (yellow A) or touch the 38% line and then turn down. Note that at that point, the white C wave would be exactly 1.618 X the white A wave.
On the chart, I’ve labelled my preferred top as (4)?. But I’ve also labelled yellow 2 (in case we don’t make the 38% level), although I now consider this a much lower probability.
The eventual turn (at either level) should send up down into a very large 5th wave. It should turn in tandem with the US equities.
The US dollar should do the same thing but in the opposite direction (up).
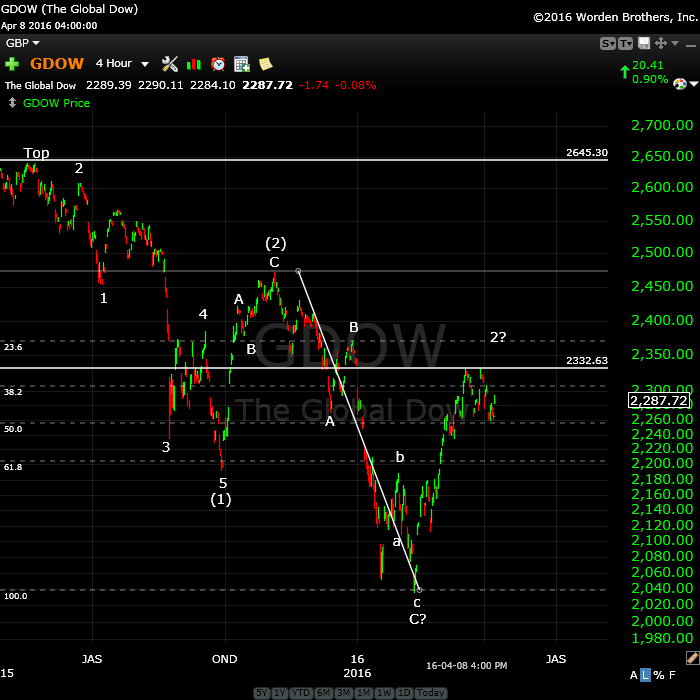
Above is the daily chart of GDOW (Global DOW) showing the current count. It looks to me like we’re tracing out a second wave after an ABC lower part of the wave. I think we have one more small leg up. This wave will likely stop very close to the 23.6% retrace level (or 76.4%) from the bottom of the wave. This should lead to a very large and strong third wave down.
I do not see a path to a new high for GDOW and, in my opinion, this strongly lowers the probability of a new high for the main US indices.
________________________
First Wave Down – What to Watch For
This weekend we’re dangerously close to a top of a second wave (in the fifth of the fifth, with an ending diagonal pattern).
What we’re looking for to confirm a turn is a motive wave down in 5 waves.
Because we have an ending diagonal, the first wave will likely drop to the previous fourth, which is also the beginning of the ending diagonal pattern (~2022). After that, we should get a second wave that will retrace in 3 waves about 62%. That’s the preferred EW entry point. So don’t feel you have to rush in. There’ll be a much better opportunity at the second wave level than at the top and the risk is substantially reduced.
__________________________


My timing says the top should come Monday at the latest. Basically 4/6 was the real high (in my system) but a strong timing in the weekend prevented the decline. My expectation is a high 4/11, a low 4/13 a retrace up into the strong 4/16-17 and then down into 4/23-24.
We’ll see.
Cheers,
André
Hi Peter
Just a couple comments non market related
First , when going to your main page using my iPhone
For some reason I couldn’t see or find the tab to take me
To this page ( it works just fine from my lap top )
I used google search to get me here instead .
Just thought I’d give you a heads up .
Could be my phone but then again maybe you have done a few things
Secondly .
I clicked on your sunspot activity link .
The 10 cm solar flux ? Clear 5 waves down . I know it’s sunspots but also
If you look at the past few years on that same chart it’s made highs near year end .
How the sunspot activity plays into the market I have no opinion I just find it fascinating
To watch .
The puetz cycle called for a high surrounding the new moon yet the end of the cycle
Is from 6 days before to 3 days after the up coming full moon . Mercury retrograde
Will follow . Mercury retrograde periods are worth studying and they can be traded
If one understands them . I’ve called them mini crash cycles in the past and I think
It’s worth those interested doing some research on them covering the past 15 years
It’s not really that much data and finding the dates is easy to look up .
Lastly you can also use the planets brightness ( Andre may have a comment on this but I don’t really know )
Brilliance / brightness tends to coincide so something to consider as we head into the next
Full moon !
The late December 2015 rally ? That’s a good starting point ( research puetz cycle ending in late October 2015
All the way into Mercury retro in early Jan as a starting point ) then go back 15 years and see how many times
These set ups have come together in the manner they are today .
Good luck
Joe
Thanks Joe,
Will look them up interesting
What I can see is a lot of signs pointing at May 9-10
In your cycle work you say it is a cycle high but can it also be a low?
Stan Harley also predicts May 9-10 to be a very important low.
John.
As well, the Dow Jones Transportation Ave which topped out on Mar 21 continues to lead the Dow Industrials Ave which hit its high on April 1st… aside from a possible restest of that high with a lower high, the DJIA is right on schedule to turn down this week in accordance with the “risk trade” turning back into the “safety trade”. Gold stocks have by far been the place to be…. Hope all are making money in this (so far) most predictable market.
@Peet,
I have the same problem with the tabs on my phone as well. It does not tell me the header text so I just have to click somewhere to see where I am going to on the website…
Cheers,
W
I think you might be talking about the responsive aspects of the site. I haven’t made the site responsive as it involves a lot of code work and I developed it ahead of having to plan for that aspect. I’ll make a note to go look at it later in the week, but no time at the moment. I don’t have a lot of people accessing it on smaller screens.
Otherwise, I don’t know what you mean by “header text.” I use a top banner, or visual header, not header text.
I think they are referring to this: Sometimes on my android phone and tablet the tabs for “Home” “cycles forecast” “market theory” etc are not visible until I change to a “landscape” view.
Oh … thanks. That helps.
Dale Pinkert (FXStreet) today sent me a link with a video on Astro cycles that he did with Norm Winski. It cover currencies and futures and he’s also focused on mid April as a really scary time. Bit geopolitical event coming. The video is here: https://youtu.be/SFKneODVfjw
The interview as done last week, so it’s hot of the press.
Yellen and Obama get together: http://www.zerohedge.com/news/2016-04-10/obama-announces-unexpected-meeting-yellen-following-tomorrows-expedited-procedures-f
Hi Peter,
Great video and explanation of EW market view. My tides work suggests this week will sell off moderately. Then next week (ending 4/22) should be up to 210.
thanks,….I understand !!!.. astro link , scary stuff ..mid month…You are a good teacher, the best….Nick…
Erik Hadik and Arch Crawford see Apr 15th as a big deal. Hadik is particularly good on this type of stuff. China, Europe, Middle East, Israel, world financial system (how about all together) – take your pick or a good ol’ black swan.
The Iraq invasion of Kuwait was was pressaged by oil companies buying oil heavily for 6 month – they almost always sell oil as that is there job. The only advance warning I can think of now is the tremendous sell off major banks have had. I am sure Obama and Yellen can paper that over though.
Thanks, Kent,
I personally would lean towards 15 because it’s a Friday. You only have to spend 5 mins on zerohedge.com to start feeling a bit queasy about where the world is going shorter term. 🙂
ES is attempting to enter the third of the third wave (of the 5th of the 5th). So up is still the call.
Currencies are doing just as forecast.
Just a thought here in regards to the mid April Astro
If it is a bad or negative Astro signal then what happens
When then cycles ends ? Does it imply things become less bad or more bad ?
On the other side of this would a positive Astro imply a top or a bottom ?
Peters wave count shows more upside so I’m going to go with the late April
Full moon before taking any bearish positions .
Mid to late may very well could be a cycle low as per Mercury then going direct
As well as Chris Carolann’s work ( spring low ) yet come June 3-7 th we have another
Cycle high and the bear cycles begin kicking in . The 2 year cycle low is due Jan 20 2017.
Many correlations to consider . Republican convention is going to expose the corruption in
government . The election itself may be contested . The later in the year puetz cycle
Just look up the next solar and lunar eclipses . And the Mars Uranus crash cycle and
Lastly Mercury and Venus conjunction of the sun . Many many many bearish cycles
Are going to kick in . Mercury retrograde is roughly every 115 calendar days so we will
See another one of those hit also ( passed the one coming up late April )
The news will blame politics yet that’s not really the truth .
Interesting correlation to this present puetz cycle and trump . He peaked around March 8
With the solar eclipse and his numbers so they say are collapsing . I’m thinking he is screwed
Yet I’m also expecting him to bounce back as the market falls . Each cycle follows rhythm that
Can Be upwards or downwards . Don’t get fixed on direction initially because if you do so
It can hurt if the outcome is the opposite of your expectations .
Peter has done a great job being open minded and while it seems like forever waiting for the top tick ?
It’s coming .
My focus is a January 20 2017 bottom .
Joe
Hmmm. We’re having a heck of a time getting started on this third wave. Futures should get there, but it won’t be pretty. 3 waves down so far, so the direction in US equities is still up.
I would expect it to continue to be very choppy.
Based upon the earnings week this week being negative as well as other news items, I now believe we could see 1975 on SPX before Friday. Still expecting 2100 by 4/22. So, as we fall I will add one 4/22 Spy call for each one percent that market falls.
Reason next week should be bullish is: Full moon price magnet, rising tides, post Mercury square and it is moving towards conjunction, seasonals favor bull after tax day 4/15, several bullish lunar planetary alignments next week.
My compliments to Joel for his predictions on the gold stocks.
Vallley, I appreciate in seeing how you are so explicit in your trading. I hope all newbies are taking notice in your trading . More explicitly , in how you deploy your cash into the market in increments. I fully agree with you Valley for this week trading. We will see a scare in the markets from mainly we’d possibly thru Friday. Down side, 1955 at the most. I will also be buying calls in three batches for a couple weeks. All newbies, watch out for your emotions, part of you will feel like you will miss out on a huge down move. Mr Market is going to fake every one out this week in thinking this is the huge move for new lows coming.. Remember , do the opposite of what the majority are doing. For longer term, I see May as the month to be concerned with for lower lows than what will be manifested for this week. Again, I will be buying calls this week and fading all the gloom and do omers. All the best everyone.
Thanks, Dave. I also appreciate your seasoned insightful trading method. My mantra is trade “small” with high probability. And trade “big” when price is way way beyond short term norm and high probability.
Keep a couple of things in mind:
I can’t see SPX hitting 1975 or 1955 this week not with DPZ and ULTA just hitting 52 wk highs. I’m still waiting for Peter’s final fifth wave top.
Based on the 12/29/15 and 8/18/15 symmetry I’m looking at, today is day 69 which would be 11/23/15 so can’t be too bearish yet. But if I’m wrong and we hit 1975, I’ll load up based on Valley and Dave’s recommendations. Andre also said there will be a strong pull after 4/13 into 4/16-17.
Every once in a while, the odd comment goes to spam and I have to retrieve it. Sorry for the delay.
Thank you.
You bet.
Russia announced they are now delivering the S-300 anti-aircraft system to Iran which is said to be so good that it would make it impossible or too costly for Israel to attack Iran’s nuclear facilities. That puts Israel between a rock and a hard place and a rock and a hard place. Of course, the Sunni Saudis would like for them to do it. It is hard to imagine it happening, so something else to worry about though.
HUI has resistance at 226.02
a drop near that level should be expected .
it can become a steep decline yet getting to that point
signals the bear market has ended .
Joe
Chart and brief commentary at the top of the post. The march continues.
Hi Peter
Valley (from Solar Cycles) brought your site to my attention and I’ve been reading through with interest.
You’ve said that the drop to last August lows was a clear 5 waver. Please would you have a ‘blown up view’ of that count? I personally count that as a 3 waver on the DJIA which is what I follow and trade and also all the subsequent ones you show as 3 wavers too. Hence I’ve come to the conclusion that we are in some sort of a ginormous triangle and that we’ve started the ‘E’ wave down on 4th April.
Thanks in advance.
Hi Purvez,
Welcome.
I will have that on a past post somewhere … way back in June of last year (something like that). I’m on my way out to do a talk, but will see if I can find tomorrow. I had a video posted explaining the alternate count you mentioned. If you go back one post you’ll find it at the bottom, I think. From an EW perspective, I could never make it work for all indices, so I abandoned it. I was never big on it from the start.
Welcome, Purvez!
Thx Valley for guiding me here. Do hope John H. recovers from whatever is ailing him.
I’m now out of the market as I’ll be out of the office for the rest of the day. The USDCAD trade I mentioned in the video gave me a better than 40% return on my account, so I’m happy. It speaks to the integrity of the EW system. I don’t tend to trade the smaller setups, just when the setup is high probability and a swing trade.
Anyone else that took it, it likely has a target (as I mentioned in the video) of ~1.267 (38% level), so a ways still to go. But it’s an ending diagonal, so it will reverse on a dime. It will likely reverse when equities do (and the euro). I think we have a very good shot at the next few days.
The third wave down, when it happens, is one you will not want to miss. I should be on hand the rest of this week.
Hi Peter,
When you say 40% on your account does that imply that you bet most or all of your account on that one trade? Or 40% on the trade itself? I am currently staying in a trade most all of the time and like your idea of waiting for the perfect set up and then trading larger.
Valley,
I have been very guilty of overtrading in the past. When I overtrade, I lose money (or don’t make as much as I should for a lot more effort). I think most people overtrade. When I find the perfect setup, I get aggressive (not off the top, I tend to add on quickly after I confirm the trend).
I didn’t “bet” all of my account, but close to 50% on that trade, as I knew where it was going. So I ended up making about 45% of the principle. In that account, I went from $10K to 14.5K in what? – 2-3 days, I think. I added on a bit more early this morning and then got out at about mid morning.
Last year, I caught a wave in AUDUSD and took 25K to 120K in the space of two weeks being very aggressive. Again, it was the setup. And it was one trade. But I was maxed out on that trade.
When we turn down into the third wave, I will be very aggressive. Doing the math, I can double my principle every 100 points in ES. That’s my plan, at any rate.
I’ve been staying away from futures lately as it’s so choppy—not worth the effort. I’m also trying to create courses and a book, so I’m very stingy with my time.
Thanks, Peter. My friend who is an experience trader/ former market maker mentioned looking for “where price isn’t” which I find an interesting concept. I interpreted that to say, pick a direction and wait for price to be so far off where it should be when the direction is taken the rewards will be huge. As if the distance between price and value is empty space containing oxygen which fuels the move of price.
Valley,
If I understand you correctly, that’s the same as price always goes to extremes. Wait for it to get there and try to catch the turn. However, that can be costly and is why in EW we always look for the second wave. It’s sometimes difficult to figure out where that extreme is. Often I would like to miss a small 38% of a move to get in at a safer place (2nd) than to be biting down on a towel … haha.
Valley,
The other thing to watch for, of course, is for the asset to hit the news. The Canadian dollar hit our news here tonight, so that means it’s about to turn. It happens every time. And, in fact, the count says it will. One more nail in the coffin of this market. 🙂
Thanks very much Peter for the ‘welcome’ and response. It would really help to see that 5 wave count to the August lows. Having seen the video that you mention I understand your thoughts about the major markets having similar counts.
On the DJIA I currently have a ‘B’ wave triangle happening since the 5th April lows as follows:
http://postimg.org/image/5p2wn0sn3/
The above is a day or two old and that final ‘e’ wave I’ve shown has had quite a giration but today’s ramp higher (at 17703 as I write) should make it touch the top line after Yellen’s said her piece. We would then be heading down to around 16700 for wi of C and then coming back to touch the underside of the bottom trend line before eventually ending up near the Feb lows to complete the bigger triangle.
Anyway we should soon find out what the market really intends to do.
Hi Purvez,
Nice to read your thoughtsdo you also have a time frame for the next low
(Dow 16.700) and the next low (feb Lows)?
Thanks
John.
Hi John, timing on the longer term is not my strong point. In fact I day trade every day on the DJIA with the express intention of making 50 points in a day. Most days I achieve that and sometimes more or less.
Although I mainly post my thoughts on longer time frames I am continuously counting 5 minute candlesticks. It’s tedious boring work but the cash rewards, once you get into the habit, are quite good.
On a different blog I tried to post my thoughts as I was trading and realised that I was confusing everyone, because on a 5 minute time frame it appears like you are constantly changing your mind. However that is not really the case it’s just that I’m following the ‘micro waves’ and they can appear to be a bit hap hazard.
Like Peter I took up trading around the start of the 2007 crash and had my baptism of ‘napalm’. It took me quite a while to recover and make some extra on the side.
Now I take things a day at a time.
The reason I look at the longer term view is because it gives me an overall sense of direction and therefore I know whether to allow a ‘small loss’ to run or cut it off.
I don’t know anyone else who does what I’m doing, although I’m sure there are people out there doing it.
So to answer your question I have NO IDEA ‘WHEN’ the waves will come to pass but unless I see something to the contrary then I’ll stick with that count.
Hope this ‘ramble’ helps.
Back for a bit but have to head out in a couple of hours again. Market is doing a expected so far. I think we’re at the halfway point in the third wave in SP500 and ES. I say that because in SPX, if we did a fourth wave now, we’d overlap the first, so I expect we’ve just done the third wave of the third (have the fifth wave of the third to go before a fourth wave correction).
So we should have a small correction in ES tonight and perhaps head up overnight another leg. Then a fourth wave correction Wednesday (guessing a bit on timing re: these subwaves).
Great site Peter! followed the bread crumbs from the hibernating solar cycles site. some interesting symetry. 9/15/2008 to 4/22/2016 will mark 7 years 7 months 7 days since the lehman collapse. austria bank collapsing this month, italian banks, deutsche bank, special fed meetings sandwiched with first yellen meeting with obama since november 2014. not to mention biden sat in as well. don’t think a sitting president has ever set immediate nonscheduled meeting w/ fed chair and VP before. G20 banking conference in DC this week….lots of banking activity to celebrate a unique anniversary
And Obama just announced helicopter money for students with loans. Hmmm … coincidence?
a debt jubilee! money for nothing and chicks for free http://www.safehaven.com/article/41093/what-in-the-world-is-going-on-with-banks-this-week
Thanks for this. Yeah, I’m expecting some sort of big event before the week is out. Italy maybe …
So far tonight in futures, we look like we’re starting on the second half of that third wave. We continue to look like we’re on track for perhaps a Friday turn. We’ll see …
Peter, how do I find your examples of Elliott waves, particularly the 1-2, 1-2. Thanks
Tough question re: 1-, 1-2. You can try googling. I don’t have an example on hand. That particular pattern isn’t all that common. You’ll likely find it in currencies rather than equities. Other than that, look around the market, I’m afraid.
I have a examples of others, but I’m putting together a course (and they’re not organized at the moment.
Our third of the fifth wave is all but complete. We might need one more small up/down to complete it. Then we should turn down in a larger fourth wave (or b wave, if in an ending diagonal) before a final small 5th.
It all seems to be coming together. Even GDOW is getting close to the intended target I mentioned in the post.
I just posted a chart at the top of the post showing the progress in ES.
I added a second ES chart showing what an ending diagonal might look like. There are still options to this final pattern.
Good call Peter on the 3rd of the 5th. My expanding triangle scenario got blown today when DJIA crossed over 17845.
I’m following your count….but on the DJIA to see how close they are.
The drop is ES should go to about 2058 (4th wave).
I’m looking for those past posts for you.
Purvez,
As per your request re: the first wave down. I had a week from hell that week (I landed in Toronto and my hard drive on my laptop immediately crashed), so piecing together what was going on was difficult. Nonetheless, I have 3 posts for you that I think are the best to show the progress of wave 1 down as I called it.
https://worldcyclesinstitute.com/steady-as-she-goes/
https://worldcyclesinstitute.com/fourth-and-holding/
https://worldcyclesinstitute.com/some-clarity-is-a-good-thing/
As as result of my computer, I completely missed trading this wave, although I knew it was coming … sigh. Hope this helps.
Peter, many many thanks for digging out the stuff and as someone who was (is) within the IT arena I can understand the frustration when things ‘go wrong’.
Your charts seem to show the ‘top as being in August. Am I reading that right? All my charts show the ‘top’ to be back in May and therefore there is another down up (going backwards) from where you are counting. THAT is what has had me confused and counting the drop to Aug lows as a 3.
You are correct, the top was in May (the 20th, I think). I may have given you the second half of the wave. I will look a bit later and see if I can find the first part for you …
Thanks again Peter. I think it’s the drop from May through to late July which I struggle with counting as a 5.
And I know why. I remember a discussion about that. I had the end of the first wave as an ending diagonal, if I remember correctly. It was a contentious issue at the time. But there was otherwise no overlap in the wave and the remaining waves appeared motive.
Peter, I was hoping you would say that. I’ve been staring at that May to July drop and the ‘only’ way I could count it as a possible 5 was as a ‘leading diagonal’.
OoohKaaay!! I now need to take a deep breadth and re-think my counts back to then.
Appreciate your will to respond….although not the ‘extra homework’ you’ve just given me. LOL!!
Well, now I don’t believe in leading diagonals. Prechter put that in a later addition of his book and it was never originally attributed to Elliott. Every time I’ve entertained one, I’ve been wrong. Never seen one.
Here’s a link to a post with the NYSE first wave count. I always go to the NYSE when everything else is driving me crazy (the largest cap index in the world).
https://worldcyclesinstitute.com/second-wave-fake-out/
Aaah OK, then I think we have to agree to disagree at this point. I always look at each instrument’s chart individually. Although I then compare, the individual chart has to stand or fall on its own merits.
I very much appreciate your wider perspective on the market and as part of my ‘homework’ I have to see how each instrument’s waves can still ‘point in roughly the same direction’ even though they are different counts. I’ll keep posting my thoughts here.
Not sure what I was thinking … ES can’t be in a normal ending wave … it’s clearly an ending diagonal. So I’ll update the chart shortly and explain why.
I posted the new chart of ES with an explanation.
Just discovered your work after listening to you on Trunews. Great job detailing out this top formation in EW terms.
Thks, Aaron! 🙂
Peter, thanks very much for that last update. I do have a ‘technical’ EW question regarding Ending Diagonals.
In the classic ED w-3 is smaller than w-1 and then w-5 is smaller than w-3. That way the rule about w-3 being the smallest is not violated. So my question is:
‘Is it still an ED when w-3 is longer than w-1 provided that w-4 overlaps w-1?’
I can’t seem to find any definitive doctrine regarding that.
Thx in advance.
P.S. I am still interested in your count of ‘5’ to the Aug lows but no desperate hurry.
Purvez, that’s a really interesting question. I’ve never actually thought about it before. I don’t see any reason it can’t be longer. The key for me is the overlapping waves, the converging trendlines, and of course, the waves in 3’s. So I don’t think the length of the waves themselves is an issue. although in most cases, as you state, you’ll find the waves get shorter. Something to think about.
Nice to have someone around who really understands EW. 🙂
Peter, I do think that your definition of an ED is more relevant than just the length of the waves. As you say the waves need to be in 3s, the trend lines need to converge and usually the ‘throw over’ is the clincher.
As you say ‘live and learn’, which is really all I want to do.
Peter, please may I ask (approx 19:35 BST – 12:35 Calgary time) do you believe that w-3 of 5 is extending, or did we have a tiny w-4 and are now in w-5 of 5?
Thx in advance.
Sorry should have said that I was looking at the S&P there.
imho, we’re trying really hard NOT to correct, but we will … haha. We’re at the top of 3, just about to drop into a fourth. It should be relatively large.
I’m short ES and NQ … will lean on my monitor a bit more in hopes I can get them to budge 🙂
btw, they should head south until tomorrow morning so that SPX can register a fourth at the open.
Crazy market.
Dollar goes down, SnP goes up because oil goes up.
Dollar goes up, SnP goes up because Yen goes down (oil doesn’t matter).
I’ve sold the close
Purvez, do you have a good source for learning methods of counting 5 min candlesticks as you mentioned? thanks in advance
hi Purvez, can you recommend any sources to study about counting 5 min bars? thanks….
Hi Whitemare. EW counting is the SAME regardless of whether you are counting 5 minutes or 5 hours. The main thing is to learn :
1. The basics i.e. Motive 5 waves & the Corrective 3 waves.
2. Ensure you learn the rules for the Corrective wave patterns of zig-zag, flat, expanded flat and triangle. (Corrective waves trip me up the most.)
3. To be brutally honest about what you SEE as the count not what you want to see.
Most people use EW as a directional tool and of course it is good for that. However there is another use for EW which I find invaluable. That is as a ‘defensive tool’. As far as I know EW is the only methodology which provides HARD rules for when a count FAILS.
Excuse the caps but those are important to learn. Once a count FAILS you have to have a strategy to either hedge or get out.
I use EW mostly as a defensive tool because at the 5 min level you are as often wrong as right but the losses are miniscule. However once a wave starts to go your way you then keep your cool and usually the profitable ones are at least 5-7 times in size as the loss makers. i.e. you can be wrong 4 times and still end up with a profit.
I must however warn you that it is extremely tedious work and you have to build the mental capacity to take more small losses than wins. That is an extremely hard thing to do.
There is one final caveat. I live in the UK and therefore can Spread Bet. The cost to me is therefore just the spread on the instrument. On the DJIA that amounts to 3 points during market hours and 5 outside. No other dealing costs. If your dealing costs are high then this strategy probably doesn’t work. You could however try scaling it to x-points a week target to allow you to have less no. of trades.
Wishing you GL with your trades.
K-Index, measure of geomagnetics has exceeded 4 for last 24 hours and there is a solar storm. Perhaps, this will “unsettle” the equities market on Thursday.
I mentioned two days ago that it was day 69 in the probable ‘Aug 17-18/Dec 29’ symmetry currently playing out. Presuming it’s still in play, I think the market pressed the fast forward button to Dec. 1st. I was waiting patiently for it to happen tomorrow or Friday but I was elated when it happened today. I didn’t stick around to wait for Peter’s ending diagonal top and took all my swing longs off the table. Some of them in the morning, some late in the day depending on the strength of the respective stock. Peter shared Pinkert’s video citing Mars and Pluto turning retrograde April 15th which, according to him, is a very dangerous high risk window for more than just the markets. So, I’m glad this push up happened today so I have zero swing longs for the next few days. Good luck to both long and short.
🙂 We’re coming to a top and I’m not exactly sure how and when it’s going to happen, but it’s soon.
While we corrected last night, that was obviously a 4th of the 3rd. I’m expecting a much bigger correction.
This b wave in ES should retrace 62% to 2076.5 before turning down.
Peter, are you now considering the 3rd to be over? Are you still targeting the 2055ish area for the larger 4th?
I’m beginning to think that this 3rd is too elongated to be part of an Ending Diagonal.
I can feel your uncertainty. But this third wave doesn’t look impulsive to me. The the first and fifth waves were in 3. So there aren’t a lot of alternatives. At this point, it’s an impulsive wave or a triangle (ED). Let’s see where this correction takes us. The larger first is in 3. Wedge-shaped so far.
I’m still on the side of the ending diagonal, but we’ll need a fairly good sized correction.
Not sure what the game is right now. Wave 3 (the one we’re in) would be 1.618 the length of the first abc wave at 2087 SPX. It looks like we are tracing out a small ending diagonal at the top of this wave.
This would suggest a correction very soon.
Hi Peter,
Once we hit 2087, where do you think we correct to may be 2075,do you think we go deeper.
This is either the top or the end of the third wave, so I don’t know the answer to that yet. And ending diagonal retraces to the beginning of the pattern, which in SPX would be about 2071. But a fourth wave will go farther south. And if this is the top, then … a lot farther south.
I just posted a 5 min chart of SPX showing the ending diagonal tracing out.
Yes, nice one Peter, I was watching the equivalent on the DJIA. I think the ‘down draft’ has started as well in the last few minutes. We’ll see.
Yeah, we’ll see. I still think we have one more down up sequence, but this is a very strange pattern.
Nope, ‘that’ down draft didn’t work on the DJIA. Will wait for the next one.
Something is going on that im beginning to question with this market
as we enter options expiry on Friday ( Tomorrow )
If the dow closes above 17918 we will have a closing above the nov 3 close
yet if we fail to go above 17977 ?
Today the number of declining stocks is larger than the number of negative
stocks . a negative advance decline line on an up day is a bearish signal .
we are now entering the end of the puetz window .
the 10 day moving average on the daily trin is below 1.00
if this indicator closes below 1.00 today it will give an overbought reading
a close back above 1.00 will give a SELL Signal .
The 5 day advance decline line turned down today ( bearish divergence)
the 5 day advance decline line also failed to take out its previous high
which was on march 3rd
the 10 day advance decline line has done the same thing
The daily vix is showing a similar divergence .
I cannot look at this market as bullish anymore from a short to medium
term basis . ( even if it does poke above 17977 which im now doubting )
Bottom Line : My mindset is bearish .
a move to 18000 is possible but as i noted im doubting we get above
17977 . ( 19777 is now key resistance and keeps a very tight stop loss in place )
all based on the cash dow
Joe
Typo
The number of declining stocks is larger the the number of ADVANCING stocks
which is a negative number
Hi Joe, I didn’t mean my post below to be a contradiction of what you wrote. I only saw your post when the screen had refreshed after I had hit the ‘submit’ button.
I DO hope you are right and I am wrong.
I am beginning to think that on the DJIA at least we are too close to 18000 to not hit it, either today or tomorrow.
When the market is in this sort of incessant ramp mode then round numbers are usually huge magnets and a 3 digit round number will be irresistible. However going long at this ‘height’ is way too rich for me.
Solarham.com K-index still at 4 or above, geomagnetic storm.
Time will tell yet im short as of 10:14 west coast usa time .
17873 on the june dow futures which is roughly
cash dow 17956-17957 .
a 20 point risk against the 17977 level noted prior .
look forward to your update peter yet this trade is
mostly based on indicators not the wave count .
all those calls people have bought about to expire worthless ?
we will see soon enough .
not sure when quarterly options expire
Joe
If this it “it,” here’s what I’m looking for: https://worldcyclesinstitute.com/first-wave-down/
On the 1 minute chart, we need to retrace to the previous 4th, then down to 2072 ES.
Peter, please may I pick your brains on your wave counting technique. On any candlestick do you include the wicks as well when counting waves or only the body of the candle?
I used to, at first, include the wicks but then I read somewhere that because RNE had to draw his graphs by hand he only used the ‘Open & Close’ values rather than highs and lows for a period. Hence all his rules are derived based on ignoring the ‘wicks’ on the candles. I have since been doing that and have found that the market does adhere closer to the EW rules on that basis.
I do however admit to an anomaly. I always include the wicks when drawing Fibs.
Just wondered what you did and what your experience of your method was.
Thx in advance.
I include the wicks. So far so good on this wave down. We should be in wave 2 of 5 now.
Thx for the reply. I agree it looks like we’ve topped but not sure what you mean by 2 of 5 down.
https://worldcyclesinstitute.com/first-wave-down/
Yes, sorry Peter. I saw your comment’s time stamp later and compared it to where the market was at the time. I should have said, please ‘ignore’.
Sorry for being curt, but watching this wave unfold. In my 25K hours of watching the market, it’s become obvious that first waves are structured a little differently. The fifth wave is the same length as the first three combined. What you really have it two waves of 5 within one wave. And they’re usually the same length. You can measure the first five and extend the fib tool so that 2.618 shows the bottom of the entire wave.
They can easily be mistaken for a an abc fourth wave, so you have to count the waves. In fact, it looks like now in ES and SPX we’re tracing the second of the fifth down, so we might even extend.
The waves down in ES and SPX are not exactly as illustrated (lol). However, retraces are in 3 so far and it’s motive on the wave down, so the direction is down.
Will have to see what happens here.
3 minute dow chart has a 5 waves down from what i see
its kind of weird though because it also is starting to look like
an expanded triangle is with in it .
if so wave E of the expanded triangle will form the peak of wave 2
near the .618 retrace at 17947
Joe
Covered my short position and ill probably regret it but something changed
in the pattern and im going to let the market show itself
Joe
Market is getting jumpy !
2 of 5 complete Es 1 min?
Doesn’t quite look right (could be a double 2 in ES). There were overlapping motive waves and that wave corrected them. We’re still heading down, still looks good, just not sure of the wave count. NQ looks better.
basically a vertical move up since feb 11. 270 spy points. I am positioned short thru june w/ covered shorts expiring april 29 which helps offset the pain. i just took a few chips from cash and bought both the 208.50 calls and the 207.50 puts for spy expiring tomorrow. just need a 20 point move in either direction now by tomorrow:) i will take the fake print of 210 being hit or a move to 206. could i be so luck to get it to violently move in both directions?
Hahaha Scott!! You are a ‘chancer’!! Wish you well with your ‘trade(s)’
This website is for educational purposes relating to Elliott Wave, natural cycles, and the Quantum Revolution (Great Awakening). I welcome questions or comments about any of these subjects. Due to a heavy schedule, I may not have the time to answer questions that relate to my area of expertise.
I reserve the right to remove any comment that is deemed negative, is unhelpful, or off-topic. Such comments may be removed.
Want to comment? You need to be logged in to comment. You can register here.