 The End Game – Waiting, Watching
Friday was a day in which time seemed to stop. While I was expecting a turn to the downside in the morning, virtually everything on my board “hung” and barely moved all day long.
The predictability of timing is the challenge of this market and reinforces the need to wait for a setup. It’s particularly important in a market that is chocked full of ending patterns, which are all moving at the whim of the US Dollar.
The other factor that appears to have more influence than I’ve ever seen are current events. When I cite “current events,” I’m referring to two levels of events;
- the one we can see, which is a contested election in the US, and
- the one we can’t see, which is aligned with central bankers and elites unknown with BIG money attached. It doesn’t take a rocket scientist the figure out that vast sums of money continue to work to undermine the world economy, likely under the influence of the global elite, fronted by the World Economic Forum.
Our enemy attempting overthrow our current democratic, capitalist system has been very vocal in their nefarious end game.
A Global Conspiracy Against God
 Let’s stop for a moment and review the bigger picture with a letter from Archibishop Carlo Maria Vigano, formerly the Vatican’s ambassador to the US. It sums up what we’re up against. I suggest you read it in full.
Here’s a key paragraph from the letter:
“A global plan called the Great Reset is underway. Its architect is a global élite that wants to subdue all of humanity, imposing coercive measures with which to drastically limit individual freedoms and those of entire populations. In several nations this plan has already been approved and financed; in others it is still in an early stage. Behind the world leaders who are the accomplices and executors of this infernal project, there are unscrupulous characters who finance the World Economic Forum and Event 201, promoting their agenda.”
How the “Great Reset” Seems to Be Affecting the Market
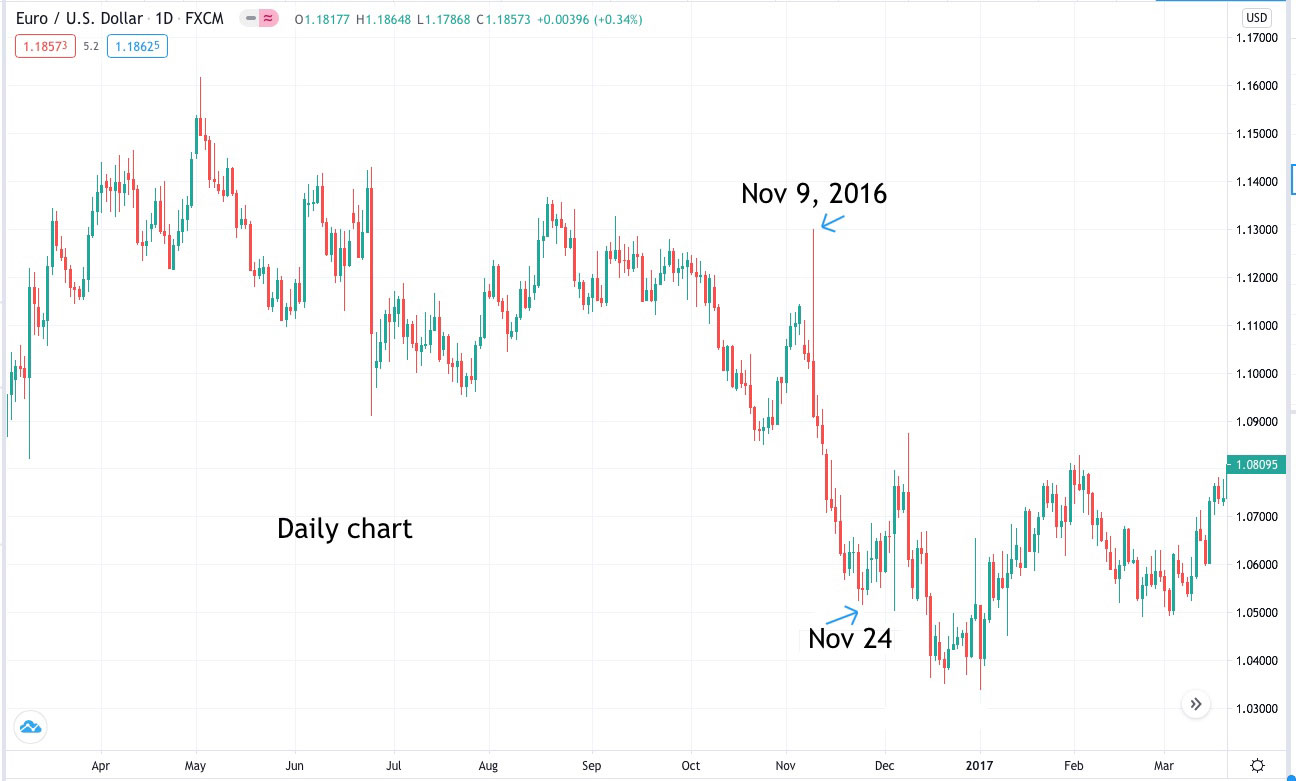
The vast sums of money linked to the election outcome was readily apparent in 2016. The instant the win was announced, the EURUSD tanked and the US Dollar rallied. I’ve shown the chart of EURUSD before. Here it is again:

Above is the daily chart of EURUSD showing the reaction of EURUSD on the announcement that Donald Trump had won the election on November 9, 2016. The US Dollar rose a relative amount at the same time.
For the past two years, a great majority of asset classes and many international exchanges have been moving closer and closer in tandem with the US Dollar. The point is that we’re very likely to see the same effect with the coming resolution of this currently contested election.
The thing I can’t predict is the rate at which the final ending patterns will play out as the court cases that are being mounted come to a climax and are decided in the favour of either candidate.
This uncertainty has resulted in stops and starts in the market and, in many cases, waves that are structurally a bit more difficult than normal to count. This structural challenge is caused to a certain extent by the current diagonal and triangular ending patterns, which all contain corrective waves in both directions.
We’re currently witnessing a major turn (perhaps on Monday), in which virtually every asset I pay attention to on a regular basis is set up to participate. On Friday, for almost the entire day, they oscillated in place, aligned at the predicted turn points. In actual fact, this minimal amount of movement has been going on for a couple of days.
So … the bottom line is that timing is difficult across the market and it’s best to wait until everything lines up and we see an actual turn before we take any action. All the assets I watch (with the exceptions of oil, gold, and silver) are making major turns at the same time … often, it seems, within the same hour.
As the end game around the election plays out, here’s an article from “the American Mind” that lays out some of the legal avenues available to the Trump organization to combat what is obviously election fraud. This could drag on for awhile, but December 8, 2020 is an important legal date.
It will be important to all of us to see whether justice and the constitution have any bearing on what is going to happen regarding the US election.
In short, this is the most difficult market to trade successfully that I’ve ever seen. It requires lots of patience, keeping exposure low, and stops tight.
Last week, I displayed charts of US indices and an international exchange, showing the active ending diagonals they’re tracing out.
The good news is that these diagonals have targets that can’t be exceeded so that there’s is, in effect, a precitable price top to the market. That will make the entry at the eventual high a little bit easier because, if we achieve the maximum projected price targets, you have a lower risk of entry.
I don’t expect any of this to be easy, but the carrot is that the eventual drop will be about 1800 points in the SP500 and should drop at the rate of the set of waves down from February, which ended up being about a month for the entire move.
The wave movement here is relatively obvious for the balance of this rally. It’s the timing that will be the challenge.
“May you always live in interesting times.” — Anonymous
_____________________________
Free Webinar Playback: Elliott Wave Basics
 If you’re new to the Elliott Wave Principle, or even fairly comfortable with it, this webinar will give you a solid introduction and comprehensive understanding of the difference between trending and counter-trend waves, the various patterns for both types of wave patterns, and a good overview of how fibonacci ratios determine trade targets.
This is link to the YouTube playback video, allowing you to review, stop and start, etc.
____________________________
Want some truth?
My new site now has several extensive newsletters in place. Videos now explain the banking system and deflation, and I’ve provided lists of what to do and what the start collecting in preparation for the eventual downturn, which will last for decades. The focus of my new site is now to retain your wealth, plan for deflationary times, and stay healthy in the process. I’m also debunk a lot of the propaganda out there. It’s important to know what’s REALLY happening in the world today. This has all been predicted and we know how it’s going to play out. Getting to the real truth, based on history, is what I do, inside the market and out.

To sign up, visit my new site here.
All the Same Market.
I’ve been mentioning for months now that the entire market is moving as one entity, the “all the same market” scenario, a phrase that Robert Prechter coined many years ago, when he projected the upcoming crash.
We’re in the midst of deleveraging the enormous debt around the world. Central banks are losing the control they had and we’re slowly sinking into deflation world-wide, with Europe in the lead.
The US dollar is fully in charge of both the equities and currencies markets. They’re all moving in tandem, as I’ve been saying since September of 2017. Over the past three years, their movements have been moving closer and closer together and one, and now they’re in lock-step, with the major turns happening at about the same time.
it’s challenging because often times currency pairs are waiting for equities to turn, and other times, it’s the opposite. The other frustrating thing is that in between the major turns, there are no major trades; they’re all, for the most part day-trades. That’s certainly the case in corrections, where you very often have several possible targets for the end of the correction.
We’re now close to a turn in the US indices, currency pairs, oil, and even gold. Elliott wave does not have a reliable timing aspect, but it looks like we should see a top very soon.
_________________________________
US Market Snapshot (based on end-of-week wave structure)
This chart is posted to provide a prediction of future market direction. DO NOT trade based upon the information presented here (certainly NOT from a daily chart).

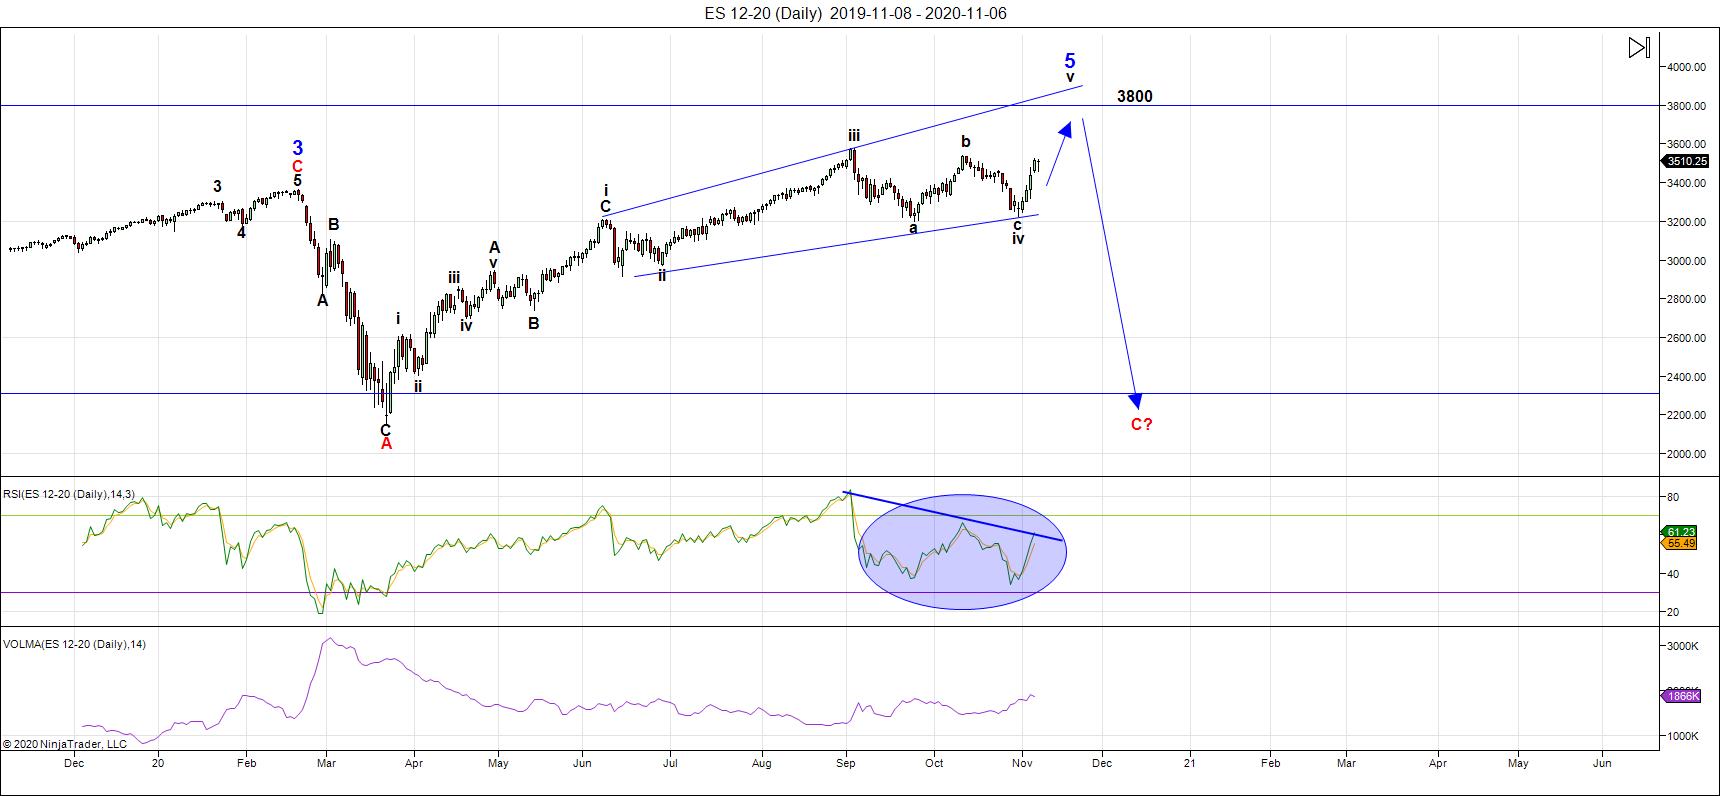
Above is the daily chart of ES (click to enlarge, as with any of my charts).
ES, the SP500, and the DOW are all tracing out ending expanding diagonals. You can see regular ending diagonal patterns in NYSE, and Russell 2000. NQ is in a final contracting triangle.
This weekend, we've the A wave of the 5th wave of the ending expanding diagonal. I'm projecting a max target around the 38-3900 level. It will result in a dramatic turn and a trend change which will take us below the March low.
The A wave up from this week has taken 6 days so far to trace out and now looks complete, so I would expect a retrace in a B wave to take perhaps half that time. But as we saw this past Friday, the market can suddenly stop dead for a day, and that makes time predictions problematic.
Diagonals are extremely difficult to trade on their own. Best to wait for the top and trade the trend change, unless you like lots of risk.
Almost all the currency pairs I cover are in possible broadening tops (except USDJPY), as is oil, and DXY. So, we have ending patterns almost right across the board. Now, it's only a matter of time. The US market needs one more high.
___________________________
Summary: It's an exhausted market getting close to a top, which I now think will happen sometime within the next month. The market may top with the announcement of the winner, but if this contested election drags on and on, it's difficult to say when that will be.
The SP500 appears to be in an ending expanding diagonal. Other US market indices have similar patterns. Diagonals are ending patterns and warn of an impending, dramatic trend change after they're complete. This puts us in the final stages of this rally up from March of this year.
The resulting trend change will target an area under 2100 in SPX, and will likely be a combination pattern and, as such, may contain zigzags, flats, and possibly a triangle or ending diagonal at the bottom. However, I'm leaning towards a series of zigzags, which are corrective waves, and will likely come down fast.
Once we've completed the fourth wave down, we'll have a long climb to a final slight new high in a fifth wave of this 500 year cycle top.
______________________________________


