Up Into the Fed Meeting
The US market rally from Dec. 26, 2018 is at the end of the road, as per my blog post of last weekend, and late this week, the US indices confirmed the top is imminent by dropping down into a final fourth wave. It appears to “the herd” as if this rally won’t end, but the wave structure tells otherwise.
The direction is still up. The US indices typically rally into a Federal Reserve announcement and this one, one way or the other, should be a market-mover!
We are at a top (with one more smallish rally) and it will depend on where we’re at the time of the Fed announcement (2pm Wednesday) as to the timing for a turn.
The other thing to remember is that Brexit officially becomes law on Friday, the 31st. This is added incentive for a major trend change.
In any case, this week I’m expecting an across-the-board rally (various asset classes) bid for a new high on or about Wednesday and a major trend change (USDCAD will head down, I’m unsure about GBPUSD).
__________________________________
Facebook (FB)

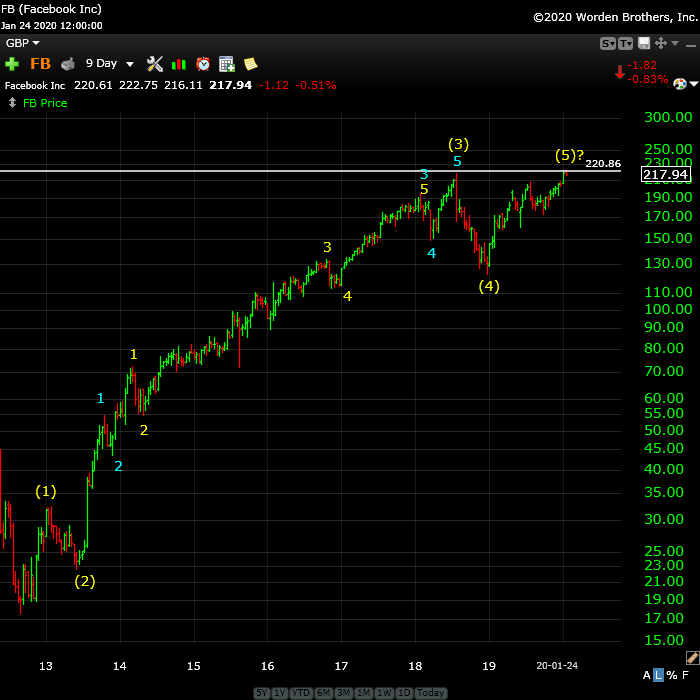
Above is the 9 day chart of the FB (Facebook). We appear to be at a top.
After the turn, which I’m expecting before this week is complete, we should see a wave down to 123.00 at least. It appears to be the final top for FB, but I note that the chart low (at the bottom of wave yellow circle 1) could be a 1-2, 1-2 start up.
In any event, we’ll know whether we have a final top in place by the structure of the waves to the downside. If they’re impulsive, the top is final. If they’re corrective, we’ll see an eventual test of the high.
In the meantime, it’s a $100 drop, worth taking a look at.
____________________________
Elliott Wave Basics
Here is a page dedicated to a relatively basic description of the Elliott Wave Principle. You’ll also find a link to the book by Bob Prechter and A. J. Frost.
______________________________
US Market Snapshot (based on end-of-week wave structure)
This chart is posted to provide a prediction of future market direction. DO NOT trade based upon the information presented here (certainly NOT from a daily chart).

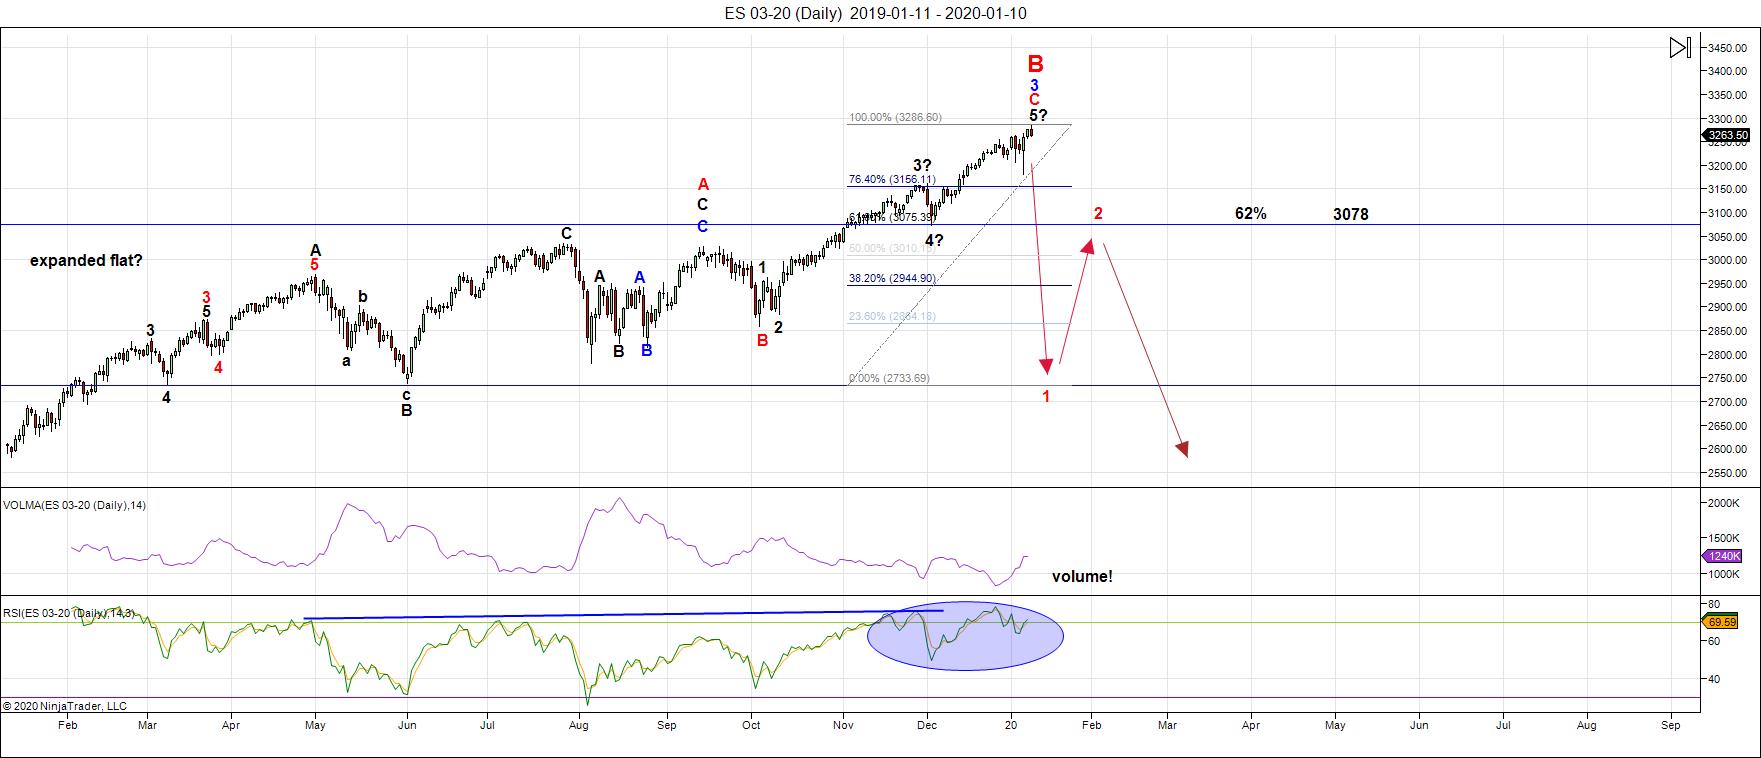
Above is the daily chart of ES (click to enlarge, as with any of my charts).
As I said last week, we've now come to the end of the road for this corrective rally. The top has very likely been established. Over the past week, we've seen a small, corrective fourth wave, which confirms the final count. We're looking for one more high.
That final wave up should have a five wave structure. I'm expecting the top to play out into the Federal Reserve meeting announcement on Wednesday, January 29. Keep in mind, too that Brexit is officially Friday, January 31.
After this final wave up, the rally from December 16, 2018 is complete after a fibonacci thirteen months.
The DAX also appears to be at a high. All USD currency pairs have one more small wave to go before they're slated for a major trend change. Likewise, oil, gold, and silver.
The larger, overall pattern across all US indices appears to be an expanded flat. That strongly suggests we're going to see a 5 wave pattern to the downside under the 2100 level in ES, as I've been predicting.
_______________________
There is an option of a set of zigzags down to the same level, but it's much less probable because there are so many flats set up across multiple stocks and indices. If a zigzag is the pattern that traces out, the retraces up will not be as strong as they would be with the C wave of a flat. We'll get a lot of information about the probable path from the first wave down.
___________________________
Summary: The current B wave up is most probably the B wave of an expanded flat. The A wave ended on Jan. 26, 2018. The B wave rally has all but ended, as other asset classes I cover have turned, or are about to turn after one more small wave.
We're going to drop from here into a large fourth wave. Look for the ultimate bottom to be somewhere under 2100 in ES.
Once we've completed the fourth wave down, we'll have a long climb to a final slight new high in a fifth wave of this 500 year cycle top.
___________________________
Trader's Gold Subscribers get a comprehensive view of the market, including hourly (and even smaller timeframes, when appropriate) on a daily basis. They also receive updates through the comments area. I provide only the daily timeframe for the free blog, as a "snapshot" of where the market currently trades and the next move on a weekly basis.
I do a nightly video on the US indices, USD Index (and related currency pairs), gold, silver, and oil).
______________________________________
Sign up for: The Chart Show
Next Date: Wednesday, January 29 at 5:00 pm EST (US market time)

The Chart Show is a one hour webinar in which Peter Temple provides the Elliott Wave analysis in real time for the US market, gold, silver, oil, major USD currency pairs, and more. You won't find a more accurate or comprehensive market prediction anywhere for this price.
Get caught up on the market from an Elliott Wave perspective. There’ll be a Q&A session during and at the end of the webinar and the possibility (depending on time) of taking requests.
For more information and to sign up, click here.
| "I think you are the only Elliot Wave technician on the planet who knows what he's doing.” |
| m.d. (professional trader) |
All registrants will receive the video playback of the webinar, so even if you miss it, you’ll be sent the full video replay within about an hour of its conclusion.


