
Last week, in “Usury Comes to America,” I told the story of how the concept of a usury-based banking system, became entrenched in western society with the establishment of the Bank of England in 1694. More importantly, this movement has gained momentum thanks to the supporting influence of the Rothschild family; it has shaped our deteriorating financial situation worldwide ever since.
Here is a compressed history of how the Federal Reserve came about.
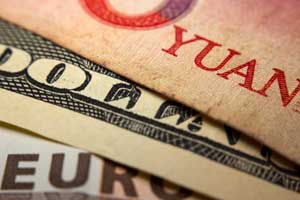 After 1863, the American financial system was built on fiat currency. The cornerstone of the banking system became debt. In other words, expanding the monetary base required banks to issue loans (debt), supported by an inadequate fractional reserve system. In 1874, legislation was passed that allowed banks to no longer require any reserves of gold or silver when creating new bank notes.
In other words, they were able to print dollar bills at will, out of thin air, backed by absolutely nothing. This debt-based system was responsible for regular cycles of boom and bust, a series of depressions and recessions in 1873, 1884, 1893, and 1907, culminating in The Great Depression brought on by the crash of 1929. Each of these major downturns were characterized by deflation and bank runs (in which citizens lost everything).
There was one American organization that, throughout all the ups and downs of booms and busts in the 1800s, reigned supreme, and that was J.P. Morgan. That’s because, during the Panic of 1857, they were quite unexpectedly bailed out by the Bank of England. Over the years, they developed closer and closer ties to the Bank of England and through it, to the House of Rothschild.
“Morgan’s activities in 1895-1896, installing US gold bonds in Europe were based on his alliance with the House of Rothschild.”—Triumph, Gabriel Kolko, Canadian historian
The Panic of 1907
The Panic of 1907 was a major turning point in swaying the public over to a need for a U.S. central banking system.
“Robert Owen, a co-author of the Federal Reserve act, later testified before Congress that the banking industry had conspired to create such financial panics in order to rouse the people to demand “reforms” that served the interests of the financiers.”—Ellen Hodgson Brown, Web of Debt
This panic began with the failure of the Knickerbocker Trust Company and the Trust Company of America. It was a story of big money, cartels, and copper, which had become a hot commodity, due to the discovery of electricity. The early 1900s saw the rise of monopolies—under the ownership of what many referred to as “The Robber Barons.”
The major players were J.P. Morgan (dominated finance), Andrew Carnegie (U.S. Steel), and J.D. Rockefeller (monopolized oil). These monopolies were eventually broken up by anti-trust legislation.
“Carnegie built his business himself, and he loved competition; but Morgan was a different type of capitalist. He didn’t build, he bought. He took over other people’s businesses, and he hated competition. In 1901, Morgan formed the first billion dollar corporation, U.S. steel, out of mills he purchased from Carnegie. Early in the 20th Century, Morgan controlled the Wall Street syndicate that financial writer John Moody called ‘the greatest financial power in the history of the world.'”
The Robber Barons were pulling money out of an empty empty hat. Their privately-owned banks held the ultimate credit card, a bottomless source of accounting-entry money that could be ‘lent” to their affiliated corporate mistresses. The funds could then be used to buy out competitors, corner markets in scarce raw materials, make political donations, lobby Congress, and control public opinion.”—Ellen Hodgson Brown, Web of Debt
To make a long story short, in 1907, JP Morgan began circulating rumours that its competitor, Knickerbocker Bank and Trust Co was insolvent. The next morning, their shares dropped 50% in the stock market. This helped trigger an 11% drop in production, a 26% rise in imports, and an increase in unemployment from 3-8%. But the beginning of the end were the bank runs on the Knickerbocker bank. Lines of depositors formed outside other New York banks and an outright panic ensued.
People slept overnight in these lines, trying to get their money out of the banks as soon as they opened. Credit froze to a point that there was fear that the stock market itself would collapse.
Suddenly, JP Morgan stemmed the flow of money by extending liquidity (for a fee) to the banks that had sustained the biggest runs. They also released optimistic reports to the press, and got religious leaders to mount upbeat sermons.
In other words, JP Morgan (and their backers) completely controlled the financial situation, ruining many businesses and lives, while making money at the same time.
The 1907 Panic highlighted the weaknesses of the national banking system and indirectly led to acceptance amongst the public of a need for a central banking system.
Creation of The Federal Reserve
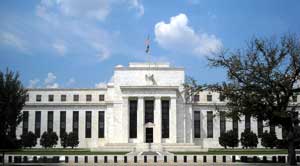 The creation of the Federal Reserve is well-documented in “The Creature from Jekyll Island,” by G. Edward Griffin. I highly recommend it. You can find a link on my Recommended Books page.
The Jekyll Island Hunt Club was a property off the coast of Georgia, owned by J.P.Morgan. In the fall of 1910, six mean boarded a rail car on their way to a duck hunting holiday. It was an 800 mile journey through Atlanta, Georgia, then Savannah, to the small town of Brunswick. The shades on the rail car were pulled shut all the way and the participants were on a first-name-only basis, so that attending servants would no know who they were.
For nine days, this small group met in secret to plan out the creation of a central banking “cartel” for the United States that is still in existence today, of course. This was the beginning of the Federal Reserve System, which allegedly has connections to the Rothschild family through its members. Although Senator Aldrich hosted the meeting, the credit for putting it all together has been attributed to Paul Warberg, who was a partner in Kuhn, Loeb & Co., the Rothschild’s main American banking operation after the civil war.
The meeting at the luxurious Jekyll Island Hunt Club retreat in November 1910, was attended by six men:
- Benjamin Strong, head of J.P. Morgan’s Banker’s Trust;
- Nelson W. Aldrich, chair of the National Monetary Commission;
- A. Piatt Andrew, Assistant Secretary of the Treasury and Special Assistant to the National Monetary Commission (the only other commission member besides Aldrich);
- Paul Warburg, a recent immigrant from a prominent German banking family who was a partner in the New York banking house of Kuhn, Loeb & Co.;
- Frank A. Vanderlip, president of the National City Bank of New York;
- Henry P. Davison, senior partner of J.P. Morgan & Co.;
In order to get the bill passed, the group needed a president who would sign it, so they orchestrated the founding of a new party, the Bull Moose Party, and brought a previous President, Teddy Roosevelt out of retirement to help to syphon votes so that the odds were in favour of getting Woodrow Wilson elected. Wilson knew very little about finance but was under the influence of “Colonel” Edward Mandell House, who lived in the White House and had strong connections to Morgan and the Rothschilds.
They changed the name of the bill from the Aldrich Bill to the Federal Reserve Act and brought it to the floor of Congress for a vote three days before the Christmas break, on December 22, 1913, when everyone was distracted. President Wilson signed it into law the next day. He’s reported to have regretted that he had done after the fact, saying before he died, “I have unwittingly ruined my country.”
“In plain English, the Federal Reserve Act authorized a private central bank to create money out of nothing, lend it to the government at interest, and control the national money supply, expanding or contracting at will.”—Ellen Hodgson Brown, Web of Debt
Opposition was extremely vocal upon learning how Congress had been duped, with Charles Lindberg calling the Act “the worst legislative crime of the ages”:
“This is the strangest, most dangerous advantage ever replaced in the hands of a special privilege class by any government that ever existed… the financial system has been turned over to… a purely profiteering group. The system is private, conducted for the sole purpose of obtaining the greatest possible profits from the use of other people’s money.”—Representative Charles August Lindberg, 1913
England on the Skids
 After WWI, England was close to broke. She had abandoned the gold standard early in the war so that she could print as much fiat currency as necessary to pay for the war. Introducing that much currency into the marketplace caused inflation to soar. The affect on the pound is that the value dropped substantially.
Before the war, Britain has been the major power in the world. After the war, it was only natural that she wanted to regain that status. To do that required going back on the gold standard at the same level she was at previously. However, setting a price for an ounce of gold arbitrarily without considering the value the market gives your currency isn’t realistic. If you try to value your money above its actual worth, it causes deflation, which leads to depression.
Before the war, an ounce of gold was priced at $4.86 US. The government decided to peg gold at that same price after the war. Getting back to a stable currency based on gold was deemed important, as it allowed countries to trade and exchange money between themselves at a level that was fair to all.
But when England pegged the pound that high, nobody believed it was worth it. As a result, trade took a nosedive. No country is going to buy your products if they’re over-priced and they can get them from another country for half the price.
Rather than experiencing the inflation of wartime, England began to experience deflation, and a depression followed. Products created in Britain were too highly priced; businesses couldn’t sell them abroad. So England was forced to let the dollar float; it ended up losing a third of its value.
Meanwhile, the United States was doing well. America had also inflated during WWI, but not anywhere near the amount England had. The strategy is common and has been used over and over again over the past few hundred years:
“… to have one nation deliberately inflate its currency at a rate greater than the other nation so that real purchasing power, in terms of international trade, moves from the more inflating to the less inflating nation. This is a method truly worthy of the monetary scientists. It is so subtle and so sophisticated that not one in one thousand would even think of it, much less object to it. It was, therefore, the ideal method chosen in 1925 to benefit England at the expense of America.”—G. Edward Griffin, The Creature from Jekyll Island
The Secret Meeting of 1927
 Montagu Norman became Governor of the Bank of England in 1920. Benjamin Strong had become the first Governor of the Federal Reserve Bank of New York in 1914, just after its formation. Mr. Strong had been one of the original six in the rail car at Jekyll Island.
Norman was considered by many to be eccentric, if not mentally unbalanced. Nonetheless (or perhaps, because of it), the two of them became close, spending many holidays together, and otherwise communicating weekly by cable in almost total secrecy. They were determined to use their financial power to force all major countries of the world to go on the gold standard and to use central banks to control the world economy, without interference from governments.
Norman spent a good deal of his time on steamships travelling the world, keeping in touch with central bankers in various countries. On July 1, 1927, he arrived in New York Harbor (under another name) on the Mauritania and went into conference with Benjamin Strong. They agreed, with Andrew Mellon, the US Secretary of the Treasury, to inflate the US monetary system.
This resulted in an increase in US bank reserves of $445 million and lowered the rediscount rate to member banks from 4 to 3.5 percent, allowing the banks to borrow more reserves, which in turn allowed them to increase loans to business and the public, thereby inflating the currency. It flooded the market with over $10 billion in under six years (based on a fractional reserve multiple).
Real estate and the stock market were the beneficiaries. Inflation in the US also caused prices of goods and services to rise, making them uncompetitive on the international market. It did just the opposite to British products, which greatly increased Britain’s overall income from trade.
It created massive bubbles in both in the US, while gold flowed from the US to Britain, thereby shoring up Britain’s economy, lifting her out of depression.
It also eventually led to the 1929 stock market crash, because when money in “cheap,” people borrow it to speculate, similar to what’s going on in our economy today.
Throughout history, whenever governments inflate to a high degree (or a lower degree over a longer period of time), it leads to inflation. Lower interest rates allow investors to borrow more money and speculate in the stock market.
This same formula was at work all through the 1800s, causing booms and busts each time. You can recognize the housing bubbles in Canada and Australia (the US housing bubble has burst once already, but has crept up close to its previous highs and is about to crash again). Stock markets all over the world are on the verge of topping out, and crashing.
The Cycles of Herbert Hoover and Donald Trump

Herbert Hoover
Cue Herbert Hoover: A man in the wrong place at the wrong time, who got blamed for the Great Depression, although he had nothing to do with it.
Herbert Hoover was a populist president, as is Donald Trump. It’s amazing to me the similarities between these two men as well as for the periods in which they became president.
There are contrasts, as well—the biggest seems to be that Trump easily communicates with the general public, but Hoover on the other hand, was able to sway intellectuals with his arguments but was quite “distant” from the “average Joe.”
President Hoover was well aware of the impending financial collapse years before he actually ran for office. Several times, he attempted to get the banking community to raise interest rates to attempt to dampen the stock market frenzy. He was against the practice of inflating the US economy to help England, having real concerns for the damage it would eventually do to the US economy:
“Hoover raised his fears again two years later, after the Fed governors voted in July 1927 to lower interest rates despite robust economic performance. The policy was designed to prop up the principle economies of Europe, which were struggling to reinstate the prewar gold standard, and needed help to stem a drain of bullion to America but monetary ease in the US economy risked channeling funds into an already overheated domestic stock market.”—Herbert Hoover and the White House, Charles Rappleye
There are many other similarities with the present time (relating to Donald Trump). President Hoover had a rather dour relationship with the press, and was very sensitive to criticism:
“Observers of Mr. Hoover during and since his campaign are wondering how he will react to criticism, once the criticism begins. He has proven himself more sensitive to censure, since his nomination, then any man in public life.”—Fred Essary, Editor & Publisher, 1929
In fact similarities are so pervasive that they even relate to the inauguration speeches. On inauguration day, just after Hoover read the oath of office, Calvin Coolidge grasped his hand and gave him a warm smile. The crowd broke into applause and Hoover moved to the lectern to deliver his inauguration speech:
“As if beckoned by the ovation the misting drizzle gave way to a downpour. Umbrellas sprouted and the song fell into silence as Hoover delivered his address in strong, slightly metallic tones, his cadence flat and even. Rain spattered his face and soaked his clothes but Hoover did not falter.”—Herbert Hoover and White House, Charles Rappleye
If you remember, Trump’s inaugural speech, it started to rain just as he began.
Two days after his inauguration, Hoover met with the Federal Reserve. The warning bells from Wall Street were getting louder and louder. The current bull market is often attributed to the actions of Donald Trump (although he has nothing to do with it). Likewise, in 1929, the stock market was often referred to as the “Hoover Bull Market.”
“Speaking on March 6 (1929) the same day Hoover met with the officers of the Fed, Warburg warned that unless the gambling on stocks was throttled back,”The ultimate collapse is certain not only to affect the state Lee speculators themselves, but also to bring about a general depression involving the entire country.”—Herbert Hoover and the White House, Charles Rappleye
Several times, Hoover sent representatives to a group of New York bankers, in an attempt to get the Federal Reserve to raise interest rates to quell the out-of-control speculation in the stock market. The bankers refused to do anything.
“The New York bankers all scoffed at the idea of the market was not ‘sound,'” Hoover wrote icily in his memoirs, “They were certain that this was a ‘New Era,’ to which old economic experience did not apply.”—Herbert Hoover and the White House, Charles Rappleye
Once the crash had begun, Hoover proposed a dramatic expansion in federal public works, and called for the states to do likewise. He invited private business to join in. President Trump seems to have similar ideas in terms of a public works program going forward.
“Public officials across the country vowed municifent budgets for 1930 —$35 million for public works in the city of St. Paul; half a billion in the state of Texas. Private industry was even more open-handed: electric utilities committed to spend $1.4 billion on new construction and another half-billion on maintenance; U.S. Steel announced a three-year expansion budgeted at $250 million.”—Herbert Hoover and the White House, Charles Rappleye
Their were other interesting parallels between what’s going on today in the world of Washington and Donald Trump and Hoover’s era (pre-depression):
“Relations with the White House press corps had been deteriorating from the first days of the presidency, when Hoover had sent out his rules for quotation and attribution. Since then the twice-weekly press meetings have become sullen, desultory affairs, with the president making a few terse remarks and correspondents accepting brief, typed handouts in lieu of live interviews. The crowd of reporters, which initially numbered more than a hundred, dwindled to as few as a dozen.”—Herbert Hoover and the White House, Charles Rappleye
Against his better judgement, on June 17, 1929, President Hoover signed into law the Smoot-Hawley tariff bill, which fixed tariffs on 887 specific products and led to an international trade war. The rest is history, and Hoover has been vilified ever since.
President Trump appears to be heading down the same path—he’s openly talking about a program of tariffs, which will likely head to a similar trade war.
I’m fascinated by the march of cycles throughout history. It’s uncanny how the traits at 172 and 516 year cycles tops stamp themselves on the characters who seek the highest office. Society also takes on the subtle imprints of an era long past. If you’re sensitive to the work of Dr. Raymond Wheeler, for example, Alexander Chizhevski, Nicolai Kondratiev, or Edward Dewey, it becomes obvious how the past becomes full circles as the cycles echo the future. You can get a good sense of how to navigate the upcoming social and political changes by simply studying the past.
Parallels to Today
While the parallels to Herbert Hoover are really extraordinary, the real story is the deflationary cycle, which rears its ugly head with each and every depression we’ve experienced throughout history.
“Everything plays a part in the unfolding drama of a downturn. Under normal circumstances an economy will weather problems, but when it is weighed down by heavy debts to purchase land, or to speculate in its value, any shock, and more particularly a shock to the related credit-creation process, will expose the weak foundations. One of the secrets, In the final stages of a cycle, is to watch for a contraction in credit. A downturn is yet to happen without one.“—The Secret Life of Real Estate and Banking, Phillip J. Anderson
Next week: The Central Banking Cartel: International Blood Suckers
_______________________
Here’s the latest daily chart of ES (emini futures)

Above is the daily chart of ES. The full wave up looks to be like a triple three (a combination wave) which is almost at completion (or will be with one small final wave up to about 2406.
The final pattern of the triple three is now labelled as a very rare running triangle with a final motive wave as the final thrust wave. This would be the top of wave red 3 (not labelled). In high degree wave structures, the thrust out of a triangle can be a blow-off wave, and that certainly seems to be what we got.
The 4th wave will come down in three waves. After we finish the A and B waves, it’s likely we’ll be able to project the bottom of the fourth wave. Then once we finish the fourth wave, we’ll get a final blow-off wave. I’m making a point not to try to project a date for a top, as the indices have such low volume and are moving so slowly.
Here are the path predictions going forward:
- Wave 4 will come down in 3 waves with any of the corrective patterns possibly in play.
- Wave 5 is likely to be an ending diagonal. In any event, it will be in 5 waves (not motive).
Summary: We’re at the top of wave 3 of the final larger 5 wave pattern, ready to turn down into four with one more very small wave up to a new high. I expect all major US indices to turn early this week. The larger wave 4 should come down in 3 waves (an ABC configuration to the target).
After completing the fourth wave, we’ll have one more wave to go, which could be an ending diagonal, as a fifth wave. It could also be a wave in 5 waves. It will move in tandem with the final wave in the USD currency pairs.
The long awaited bear market is getting closer.
_______________________
Here’s the latest HOURLY chart of ES (emini futures):

Above is the 60 minute chart of ES showing our progress to the end of the day on Friday (click to enlarge). We’ve rallied slightly at the end of the day, but not to new high. I expect a new high at to hit the target on Monday or Tuesday. I’m projecting a target for ES of 2406/7.
Both ES and NQ have small waves that are overlapping the first waves, so this may be projecting a small ending diagonal as we move to the final top of wave 3.
_____________________________
Sign up for: The Chart Show
Thursday, March 9 at 2:00 pm EST (US market time)

The Chart Show is a one hour webinar in which Peter Temple provides the Elliott Wave analysis in real time for the US market, gold, silver, oil, major USD currency pairs, and more. You won’t find a more accurate or comprehensive market prediction anywhere for this price.
Get caught up on the market from an Elliott Wave perspective. You’ll also get Andy Pancholi turn dates for the balance of the current month. There’ll be a Q&A session during and at the end of the webinar and the possibility (depending on time) of taking requests.
All registrants will receive the video playback of the webinar, so even if you miss it, you’ll be sent the full video replay within about an hour of its conclusion. For more information and to sign up, click here.


Thanks Peter!
SPX correlation to VIX has been unusually high (positive), which hasn’t boded well for future price action
http://imgur.com/a/fBPxJ
http://imgur.com/a/dbcMS (longer term)
Nice charts !
Peter,
So now that what you had labeled as a W(IV) has dropped into W(1) territory I will assume the 60 min count is invalided?
The UVXY is saying the indices should be rising as this would fall in line with your count but the indices are not listening.. So confusing right now..
If we look at the 30 day SPX trend line it has now broken to the right side of the line – so the up trend is technically broken as of this morning..
I agree. 2363.63 will confirm the reversal has arrived.
I am a buyer of UVXY here at $19.30
Stop loss at $18.48
I have remained long during the topping process. Also shorted SVXY at 131.18 today which should yield a ten bagger for option trade by the time this decline is done as it will certainly move below its recent low of 118.44. These second wave bounces are where you make serious dough trading volatility as they closely approach, and sometimes even exceed the optimism of the recently established high. You see the same kind of double bottom for third and fifth waves down of terminal impulses for SVXY, and of course a double top, usually with upper BB penetration for UVXY. The set up is text book. 🙂
I have a lovely count that says prepare your best sled because tomorrow we start sliding. Bigly.
I hope you are right Alex, I want to load up for the long side.
8 years ago today, the SP500 bottomed at 665.75. 2 months after Pres Obama’s inauguration. Here we are 2 months after Pres Trump. 2400
This market continues to be quite cagey and outright treacherous. The failure of SPX to fill the closing gap from last Tuesday at 2363.64 is a bit of a red flag – it could be that we are still in a small degree fourth wave correction. Further, if the current bounce was a second wave, which is what would logically be expected, futures are in no way suggesting we are about to embark on a third wave decline. I am holding some dry powder just in case. Never underestimate the banksters!! I think they my dislodge a few early bearish bets today…. 🙂
Thanks Dave!
So we have hit a Fib 8yrs
We have went 100% of W1 off the 2009 lows
We are in March ( March and Oct have been turning points)
Monthly SPX candle at top of a megaphone pattern
Hmmmm…
chart update time – ‘YIKES”….. please be kind. i am on a diet, and prone to erratic and emotional sobbing outbursts. you “CAN” calm me down though with my drug of choice – spinach and cheese panini!! [slurrrp]
https://invst.ly/3edx8
https://invst.ly/3ee0q
https://invst.ly/3ee27
I am not the ghost seeker, but that’s what has appeared in the sky:
http://www.msn.com/fr-fr/actualite/insolite/zambie-une-tr%C3%A8s-%C3%A9trange-silhouette-est-apparue-dans-le-ciel/ar-AAnTTsQ?ocid=spartanntp
http://img-s-msn-com.akamaized.net/tenant/amp/entityid/AAnTOrB.img?h=259&w=460&m=6&q=60&o=f&l=f&x=138&y=135
Nice triangle all day!
Getting ready to break though one way or the other..
Yep! Look for an upward thrust to complete either a second wave of an impulse down, or a final small degree fifth wave up. Either way, the thrust should be short and sweet!
The one caveat about the upward thrust is that triangles are supposed to be continuation structures and since this triangle was entered via a downward trend, it would normally be expected to break to the downside….I guess we will have to wait and see what it actually does. This particular consideration argues for a second wave rather than a fourth….
I seen a thrust but it was to the downside.
I know what your saying though usually an (e) wave
Overshoots then drops back in..
I know Peter is expecting a wave up before W4 starts
It really looks like we are rolling over though.. curious on his thoughts.
corrective, so far.
🙂
??
It seems as if one strange feature of this market is how it can keep moving in the same direction in a non-impulsive manner. I have come to the conclusion that this is could possibly b the result of relentless central bank intervention.
I think there is an EW wave rule about triangles that says they cannot be the only structure in a second wave but they can be one of several structures. In this case we could have the triangle as a possible b wave with an upward thrust for a C wave followed by a quick reversal and continuation of the downward trend.
Verne,
What time frame are you looking at? Thank You!
I’m looking at the daily chart for SPX. It is starting to look like Peter is right on this being a corrective move as it seems intent on proceeding sideways. If we had a second wave correction at this degree of trend change we should have been seeing more downward momentum at this stage. I think we go higher form here; but not for long….
Sorry! I meant to say HOURLY chart….(but you knew that!) 🙂
Peter,
You said corrective so far..
Would that mean we are finally in W(4) and that small wave up you were expecting never materialized?
Or are you saying we are corrective in W(iv) and need (v) up before W4 starts?
Not wave 4. Note the ending diagonal in ES over the last couple of days (bottomed last night) and now we might have one in SPX.
SPX closed last Tuesday’s gap today but DJI did not. I hate when this kind of divergence takes place and it means some uncertainty about market direction remains. If DJI closes is respective gap tomorrow, it would imo suggest that we have a trend change and the current wave up is complete.
Peter, is this what you’re still seeing? http://imgur.com/e5FYW2g
Oops! That was a history of ES roll dates – which is relevant cuz we have one Friday and ECB tomorrow. but here’s the amended ES chart http://imgur.com/bvPBSJ5
Remember 12/2/2015 top? A lower hi 12/29. Bottom 1/20 & 2/11. Maybe markets doing the same thing with March 1 top. So possible low is 4/20 & 5/11 or thereabouts. Just a guess.
The gaps up at the open from last week Tuesday I think have to be given primary consideration. If DJI fill its open gap tomorrow they will have to be designated exhaustion gaps and this move up is done.
I think this move down is going to be a lot deeper than most folk expect. We saw a multi-decade high level of bullish optimism on this last move up and even with the strong five day move down in small caps, volatility has hardly budged. If we have another leg up, and I believe we do, it will more than likely commence from a substantially higher levels in VIX than we presently have. I expect at the very least a 7% correction, assuming a top is not in….Oh, I know, every says “No Way!”, but that is just the point I am trying to make…
If this hypo plays out with a mid-month low or double bottom (presuming a low tomorrow or Friday) then 3/21, a Tuesday, may be the best pivot low for the end of quarter ramp just like the uptrend towards end of December 2015.
Hi Liz, I am looking For a dramatic drop from, March 15th into possibly the end of the month. The 15th as I see it will be the start of a correction. NOT A CRASH I will be dollar cost averaging into the gaps from the last 3 months. Good luck every one !
I see no more than a 5 % correction at the max.
The way those gaps are closed is going to be critically important. So far DJI has not close the one from last Tuesday but SPX has. Considering how low volume has been, my suspicion is that a lot of those gaps was the result of leveraged central bank buying. The slowness of the way they are being filled suggest someone is being REAL careful about unwinding long positions. If they start to get filled violently it could signal big players rushing for the exits. The fact of the matter is there has been very few sellers in this market and it is now declining under its own weight.
Liz, you could be right for a bottom 3/20ish… http://imgur.com/a/d64K6
DWL, nice composite. Wha cycles did you use? I have Timing Solution and like your results.
Ron, I got this from Time-Price-Research and it’s the Venus Latitude Cycle. The highest amplitudes are the Min/Max levels. I’ve been trying to back test these but don’t have the dates for anything before 2015, which as you can see from this chart could be helpful to know. Maybe you can calculate? See extreme amplitudes in 1998,99,02,07 for instance.
http://time-price-research-astrofin.blogspot.com/2016/08/spx-vs-venus-latitude-cycle-min-max-0.html
2000-02-16 (Wed) 11:38 VEN Lat = 0
2000-04-10 (Mon) 17:35 VEN Lat @ MIN
2000-06-08 (Thu) 17:15 VEN Lat = 0
2000-08-05 (Sat) 17:58 VEN Lat @ MAX
2000-09-28 (Thu) 05:51 VEN Lat = 0
2000-12-02 (Sat) 13:45 VEN Lat @ MIN
2001-01-19 (Fri) 09:21 VEN Lat = 0
2001-03-23 (Fri) 14:52 VEN Lat @ MAX
2001-05-10 (Thu) 22:36 VEN Lat = 0
2001-06-24 (Sun) 18:02 VEN Lat @ MIN
2001-09-01 (Sat) 02:45 VEN Lat = 0
2001-10-23 (Tue) 21:17 VEN Lat @ MAX
2001-12-21 (Fri) 14:02 VEN Lat = 0
2002-02-17 (Sun) 07:29 VEN Lat @ MIN
2002-04-13 (Sat) 19:46 VEN Lat = 0
2002-06-15 (Sat) 13:51 VEN Lat @ MAX
2002-08-03 (Sat) 08:15 VEN Lat = 0
2002-10-15 (Tue) 17:44 VEN Lat @ MIN
2002-11-24 (Sun) 11:34 VEN Lat = 0
2003-01-04 (Sat) 18:04 VEN Lat @ MAX
2003-03-15 (Sat) 23:45 VEN Lat = 0
2003-05-07 (Wed) 03:38 VEN Lat @ MIN
2003-07-07 (Mon) 04:59 VEN Lat = 0
2003-09-01 (Mon) 11:45 VEN Lat @ MAX
2003-10-26 (Sun) 16:37 VEN Lat = 0
2003-12-27 (Sat) 14:59 VEN Lat @ MIN
2004-02-16 (Mon) 21:12 VEN Lat = 0
2004-04-30 (Fri) 10:09 VEN Lat @ MAX
2004-06-07 (Mon) 10:28 VEN Lat = 0
2004-07-15 (Thu) 15:01 VEN Lat @ MIN
2004-09-28 (Tue) 14:44 VEN Lat = 0
2004-11-18 (Thu) 03:52 VEN Lat @ MAX
2005-01-18 (Tue) 01:53 VEN Lat = 0
2005-03-15 (Tue) 02:37 VEN Lat @ MIN
2005-05-11 (Wed) 07:32 VEN Lat = 0
2005-07-10 (Sun) 09:47 VEN Lat @ MAX
2005-08-30 (Tue) 20:05 VEN Lat = 0
2005-11-10 (Thu) 13:56 VEN Lat @ MIN
2005-12-21 (Wed) 23:26 VEN Lat = 0
2006-01-29 (Sun) 23:50 VEN Lat @ MAX
2006-04-12 (Wed) 12:39 VEN Lat = 0
2006-05-31 (Wed) 21:18 VEN Lat @ MIN
2006-08-03 (Thu) 16:54 VEN Lat = 0
2006-09-27 (Wed) 08:04 VEN Lat @ MAX
2006-11-23 (Thu) 04:25 VEN Lat = 0
2007-01-21 (Sun) 19:09 VEN Lat @ MIN
2007-03-16 (Fri) 10:02 VEN Lat = 0
2007-05-22 (Tue) 09:37 VEN Lat @ MAX
2007-07-05 (Thu) 22:26 VEN Lat = 0
2007-08-24 (Fri) 04:09 VEN Lat @ MIN
2007-10-27 (Sat) 02:40 VEN Lat = 0
2007-12-13 (Thu) 10:42 VEN Lat @ MAX
2008-02-15 (Fri) 13:48 VEN Lat = 0
2008-04-09 (Wed) 21:45 VEN Lat @ MIN
2008-06-07 (Sat) 19:20 VEN Lat = 0
2008-08-04 (Mon) 21:12 VEN Lat @ MAX
2008-09-27 (Sat) 07:51 VEN Lat = 0
2008-12-01 (Mon) 18:31 VEN Lat @ MIN
2009-01-18 (Sun) 11:32 VEN Lat = 0
2009-03-21 (Sat) 23:02 VEN Lat @ MAX
2009-05-10 (Sun) 00:36 VEN Lat = 0
2009-06-24 (Wed) 01:28 VEN Lat @ MIN
2009-08-31 (Mon) 04:45 VEN Lat = 0
2009-10-23 (Fri) 01:45 VEN Lat @ MAX
2009-12-20 (Sun) 16:09 VEN Lat = 0
2010-02-16 (Tue) 11:04 VEN Lat @ MIN
2010-04-12 (Mon) 21:45 VEN Lat = 0
2010-06-14 (Mon) 17:43 VEN Lat @ MAX
2010-08-02 (Mon) 10:22 VEN Lat = 0
2010-10-14 (Thu) 06:30 VEN Lat @ MIN
2010-11-23 (Tue) 13:38 VEN Lat = 0
2011-01-04 (Tue) 03:11 VEN Lat @ MAX
2011-03-15 (Tue) 02:39 VEN Lat = 0
2011-05-06 (Fri) 08:20 VEN Lat @ MIN
2011-07-06 (Wed) 07:07 VEN Lat = 0
2011-08-31 (Wed) 15:47 VEN Lat @ MAX
2011-10-25 (Tue) 19:36 VEN Lat = 0
2011-12-26 (Mon) 18:51 VEN Lat @ MIN
2012-02-15 (Wed) 23:11 VEN Lat = 0
2012-04-29 (Sun) 16:00 VEN Lat @ MAX
2012-06-06 (Wed) 12:34 VEN Lat = 0
2012-07-14 (Sat) 21:07 VEN Lat @ MIN
2012-09-27 (Thu) 16:43 VEN Lat = 0
2012-11-17 (Sat) 08:18 VEN Lat @ MAX
2013-01-17 (Thu) 03:59 VEN Lat = 0
2013-03-14 (Thu) 07:51 VEN Lat @ MIN
2013-05-10 (Fri) 09:38 VEN Lat = 0
2013-07-09 (Tue) 13:53 VEN Lat @ MAX
2013-08-29 (Thu) 22:03 VEN Lat = 0
2013-11-09 (Sat) 23:18 VEN Lat @ MIN
2013-12-21 (Sat) 01:36 VEN Lat = 0
2014-01-28 (Tue) 14:43 VEN Lat @ MAX
2014-04-11 (Fri) 14:44 VEN Lat = 0
2014-05-31 (Sat) 02:02 VEN Lat @ MIN
2014-08-02 (Sat) 18:53 VEN Lat = 0
2014-09-26 (Fri) 12:01 VEN Lat @ MAX
2014-11-22 (Sat) 06:34 VEN Lat = 0
2015-01-20 (Tue) 23:32 VEN Lat @ MIN
2015-03-15 (Sun) 12:02 VEN Lat = 0
2015-05-21 (Thu) 16:18 VEN Lat @ MAX
2015-07-05 (Sun) 00:33 VEN Lat = 0
2015-08-22 (Sat) 11:47 VEN Lat @ MIN
2015-10-26 (Mon) 04:46 VEN Lat = 0
2015-12-12 (Sat) 15:26 VEN Lat @ MAX
2016-02-14 (Sun) 15:44 VEN Lat = 0
2016-04-09 (Sat) 01:24 VEN Lat @ MIN
2016-06-06 (Mon) 21:28 VEN Lat = 0
2016-08-04 (Thu) 01:38 VEN Lat @ MAX
2016-09-26 (Mon) 09:56 VEN Lat = 0
2016-12-01 (Thu) 00:37 VEN Lat @ MIN
2017-01-17 (Tue) 13:28 VEN Lat = 0
2017-03-20 (Mon) 05:15 VEN Lat @ MAX
2017-05-09 (Tue) 02:43 VEN Lat = 0
2017-06-23 (Fri) 07:13 VEN Lat @ MIN
2017-08-30 (Wed) 06:43 VEN Lat = 0
2017-10-22 (Sun) 04:54 VEN Lat @ MAX
2017-12-19 (Tue) 18:16 VEN Lat = 0
Thanks TPR!
Or may be top ?
Yes, Dimitri, I’m leaning toward maybe it being a top of some interim nature.
I’ll see if i can research this later tonight DWL. If you are into creating this type of chart, I don’t think there’s an easier way than using Timing Solution…truly amazing software.
DWL, I have the data. Let me know where to send it.
Thx Ron. Dwlentz@gmail.com Here’s what I’ve charted so far: http://imgur.com/hjti6EK
What has March, have for us this time ?
2000 was a high 2003 was a low 2009 was a low
How do you like this:
https://www.euronext.com/fr/products/indices/QS0011052139-XPAR
Manipulation on indexes through volatility has become extraodinary
so i know the consensus setup – its NFP tomorrow. and a glance at the RUT futures will show prices have fallen outside the bottom of the BBand.
https://invst.ly/3e-yb
so the simian brains of PhD’s that programmed the algo rig fest – would have you think to “get long”, cause its NFP, and well the market ALWAYS goes up on NFP regardless of what happens – and well we are selling down today, so we can squeeze the heck out of the shorts tomorrow.
BUT its called a “bull trap” for a reason!!!!!!! https://invst.ly/3e–5
so be TOLD!!! i need to drink some wetlicious water now – since FOOD is off the diet menu!!! [sob]
I think you’re seriously overestimating the presence of humans in this market lol. Retailers btw account for less than 5-8% at max of the liquidity. Algos are not playing against retailers’ pennies 🙂
alex,
i beg to differ. Algos/HFT’s are doing JUST that – stealing pennies from retailers and anything else they can steal from.
in 800 trading days – JPM had exactly 2 losing trading days. $800 million per day in profit…..now multiply that across all the other players [citadel/virtu] [who also had next to NO trading losses in 800 trading days – well that profit has to come from somewhere….guess where it is coming from??
Funds, MM, other HFTs. Well hidden in a report by CFTC and SEC post-flash-crash – Emini trading volume by retailers = 1%. I think there’s a sort of nostalgia that brings retailers to think their 50 bucks still count for something in this market 🙂 like the guys that look at J. candlesticks to gauge “sentiment”. That warm fuzzy sentiment of an HFT chasing an HF algo…
Probably if people knew they’re playing against machines, all the magic would be gone (it will be soon no matter what, the few retailers left are piling long just here at the top). But I think it’s important to know the game we’re playing, well before looking at a chart.
SPX hammer on the day..
Sold my UVXY for a small profit.
I am looking for upward movement tomorrow..
If there’s upward movement tomorrow, I’m going to sit this one out. I do not want to get caught with a new long position tomorrow unable to unload it before the weekend starts with the 15th just around the corner.
If you remember 2008 when we started the correction
We would open up then sell off
We have seen that pattern 3 days in a row
If I am wrong and we do not close green tomorrow we might very well be in that pattern again.
I think 4 has started or something even bigger, but I have to trade what I see in the charts.
The charts said today near the daily 21 Ema there were buyers
So with a hammer on the day I would have to expect tomorrow is a big green candle.
But just like you my gut says something different.
Andre’,
Any additional thoughts that are different from your previous posts? I believe you have March 10th as up…then down from this area for perhaps weeks! Thanks in advance!
I said 8 and 10 would be highs. This weekend a very strong change in trend; should bring a Multi week high. Basically down into 3/29 in ABC. First low 15, then 22 high and a C down into 29. I think.
Cheers,
André
Andre,
So today we will see a snapback rally in the US but March 1 will be the top from there it´s downhill (A,B,C) till the end of the month?
I guess Europe will have to top today to get things aligned?
The AEX is going grazy ….because of AKZO…
Thanks keep up the good work.
p.s.
Take your time my mother also passed away last year in August almost 97 years old but I still miss her.. from time to time.
Good luck
John.
energy chart supports most of your dates
https://s8.postimg.org/5deipwwmt/energy_chart_March_13_to_April_4th.png
Tom how do you create that chart? Amazing…
Thank you Tom ! I was expecting more of a drop on the May 15th myself. Either way, I will exit one third of my position on the 15th thou and sell the rest as my indicators light up. Good luck every one.
PS Happy fishing Joe.
Will give some more detail this weekend but 10/11 should be a high. 15 is a strong date as 22 and 29. 29 is a low; for sure.
But in between we could have inversions. Still think 22 is a high. The 4 year delta gives a low 13 and a high 14/15. If 15 is a high we need a date in between. 17 is opex; could bring the inversion. Have to think about this,
http://www.mahendraprophecy.com/userfiles/files/6-10_march_2017,_weekly_financial_letter,.pdf
Thanks John
http://www.mahendraprophecy.com/userfiles/files/6-10_march_2017,_weekly_financial_letter,.pdf
Welcome, that man has never been wrong in the longrun,but we have to be patient till June/July.I think we will fall into the fed meeting but after that we will rise again.
Maybe this will be the same patern like March/July 2007.
Thanks John. As mentioned before, I am a BULL by heart. I have been waiting for some time to get fully back in this market and exit some time this summer. Than very reluctantly, go short the market.
Just need to select all the link with .pdf
Thanks so much for sharing the Mehendra newsletter…….very interesting and falls in line with EW and Peter’s work. If you’re a Mehendra paid subscriber I feel like we owe you some money for posting this!
I had to smile at his exhortation to Trump to speak to his supporters about their potential to inflict violence on their opponents. Now there’s real irony!
As to this being necessary to forestall the country becoming divided, it seems to me a bit too late for that.
link to mahendraprophecy doesn’t work. Would you mind correcting it? Thanks.
Don’t click.
Just make copy-paste
Hmmmmm… SPX Hourly looks like an H&S pattern setting up…
you mean “this” jody – https://invst.ly/3faqk
An ABC pattern would bring us back just right under the top – 239.15 more or less (sadly 🙁 WOULD YA CRAAAASH lol
yes that is what I was seeing.. Just has to confirm..
But, as I keep saying, we’re going up. 2400 for the C wave to come.
🙂
That’s ES (M contract numbers) 2403 otherwise.
We could have started that move today I agree.. I see a 1 up and a 2 down on the 5 minute, however if that neckline breaks we could see a 50 pt or so drop. If that happens then what?
I am all in cash watching. I expected the up move today then it looked like we traced out a 2 then at the end of day started 3 so Monday 3 wrap 4 tues, 5 wed with the announcement of the hike confused everyone then drop thurs.
The drop will be wave 4. Your count today is correct, imho. I put us in an ending diagonal. There just isn’t any other option at this point, (although I’ve seen a lot of weird counts out there, as usual) but I’ll put a chart in the post on the weekend. The wave up to the recent high was in 3, which is incredibly obvious (but not to some, who should know better—outside this group, of course). The wave down was corrective (a 3).
My peeps know how accurate I’ve been and so it’s unlikely I’m wrong (based only on history). This time could be completely different … lol
Mahendra link does not work. Can u pl summaize what he us saying
Try this:
http://www.mahendraprophecy.com/userfiles/files/6-10_march_2017,_weekly_financial_letter.pdf
Oops sorry that doesn’t work either….but that’s because it requires a subscription.
Purvez,
Here you go .. it takes some figuring out. There’s a comma in there, for some reason ..
http://www.mahendraprophecy.com/userfiles/files/6-10_march_2017,_weekly_financial_letter,.pdf
Here it is properly inside quotes. Just copy this and remove the quotes. The comma, creates a new line and screws up the url.
“http://www.mahendraprophecy.com/userfiles/files/6-10_march_2017,_weekly_financial_letter,.pdf”
Thanks for the Mahendra analysis. Remember I said last weekend that 3/8 was a strong date? This fits with what mr Mahendra says : last week may have been the high.
Velocity. Some people say that planets that move fast have more energy. Mars velocity peaked in december, Venus velocity is down and went negative last weekend (retro) and now Mercury velocity peaks 3/12. So, after this weekend all trading planets are slowing down.
My mantra stays that 2/1 was the system high. If the trading planets tried to fight this turn, they are running out of steam about now. Venus declination peaks 3/11. This shoud be a high but is a change in trend in any case. So 3/11-12 are strong. 3/12 we have a tidal inversion and 3/13 venus is parallel natal venus.
Short term bearish is Venus moving to aphelion. With Venus and Jupiter almost at opposition, the inter planetary field is weak. The only positive here is that earth and venus are moving to conjunct 3/25. This gives a local high in IMF. But combined with the other arguments this is weak.
Another bearish influence is the new moon moving to perigee. This is part of the 411,78 day full moon cycle where 27.5 and 29.5 synchronize. The new moon at perigee will bring a strong gravitational force and that is bearish. On top of this perigee is moving closer to earth. This cycle alone gave a high in march and a low in may. These are not the strongest cycles, but they do have an impact.
You may recall I gave a possible date for a low 5/28. Seems like perigee agrees.
So, combined this says that this weekend will show another weakening of force with a little support into the 3rd week.
80 years ago the yearly high was 3/10. Gold made a low 3/10. The yearly low was deep into november. So when Mahendra says a low in december I think he may be right.
Strongest days are 15/22/29. So the million dollar question is : will 15 be a high? If so, Monday will be a low. I am pretty certain 22 will be a high (49 days from 2/1 = deathzone) and 29 a low.
22 is a very strong date and will bring a strong turn down. 17 we have opex and 15 the Feds. So another week of consolidation is possible. If Monday is a high Wednesday will be a low and then up into 22. If Monday is a low, wednesday will be a high and Friday a low.
When the trend (down) grows stronger forecasting will become a lot easier.
Cheers,
André
“So when Mahendra says a low in december I think he may be right.”
carefully review what Mahendra wrote: “the market may bottom out in the first week of December so plan your trading and investments accordingly”
may be more of a marketing ploy than a forecast…as in, buy my 2017 Financial Predictions book…be well!
“Final request… Every day I receive requests to put out some predictions for free members, please stop asking for that, I always publish small part of letter whenever I felt that we are at important time juncture of market. Unfortunately, I can’t put out complete letter here because my members get very upset about it as they pay big fee for subscriptions. If you can’t afford to subscribe our weekly newsletter or Daily Flashnews then I am sure our book “2017 Financial Predictions” will help you in making all important investment and trading decisions in 2017. Book had detail monthly cycles for all metals, energy, Indexes, most of global stock market, most of currencies, grains and softs and bonds.”
http://www.zerohedge.com/news/2017-03-10/recession-alert-us-government-revenues-suffer-biggest-drop-financial-crisis
With declining revenues and plans for a tax reduction a rise in interest payments is the last thing Trump needs. Trump will have told Yellen that if she raises rates she’ll be looking for a new job. The massive shortposition on eur/usd will trigger a shortsqueeze that will catapult the eur/usd towards 1,20.
Thank you André!
Yields have completed a five wave rise so you could be right. I personally think Yellen has no choice but to raise rates as the bond bull run has come to an end and rising rates is now the order of the day. The FED has to follow the market. I suspect that if yields initially decline in what will be a corrective wave, it will be due to muted expectations of future rate increases, and not the start of a new downward trend.
Mahendra correctly identifies the tech and housing bubbles as being catlysts responsible for the market crashes in 2000 and 2007 respectively, and the very surprisingly stated that he did not know what would trigger the next one. One would think it would be easy to recognize the biggest bubble of all time – the BOND bubble!
Compared to 2000 and 2007, global debt has mushroomed; of course the bang is going to be bigger! 🙂
I just happened across my Cycles by Dewey. I saw Wheelers 100 year cycle. 2008 should have been the top of a warm wet period. We are 9 years toward the trough of the warm dry period, 2033. Therefore the cooling should not begin until then?
Kent,
Dr. Wheeler wasn’t that accurate in his small scale projections for climate for the period of about 1970 to today. However, he did project a major turn at about the year 2000. Warm-wet is always the first part of a warm cycle, so we actually just finished the warm-dry phase near 2000. I put us in a 25 year transition between the warm and cold cycle. The first part will be wet, the second part dry, but overall, it’s an extreme climate cycle. When that calms down, we’ll have cold wet and then later cold dry. And with the turn to cold, comes a financial collapse. Fun times.
The strongest date between 15 and 22 is 17. The tides give a low on Wednesday (high high tide) and a top on 22 (low high tide). Tom’s energy chart also suggested a low on wednesday.
As 22 seems to be the strongest date, the signal noise ratio stays low and inversions rule the game. So Wednesday will be a (weak) high, then a low 17, and up into 22. 20 is the equinox that will shake up things a bit.
I am convinced 1942 was a significant low. Another piece of evidence is given by the Saturn/Uranus cycle. This cycle gives 45,3 years. Starting in april 1942 and adding 45,3 years we get august 1987. Wasn’t this a significant high?
1942 gave the significant october 2011 low. 2/1/17 is conjunct this date. Next significant date is 4/25.
Andre’,
Do you still feel “everything is now down”? I am thinking Peter’s Wave 4 begins somewhere in this price level. You have mentioned in your past posts that late April could be a low. Thanks!
Ed,
Yes, I do. But real movement starts 3/22. I have said I have 2 dates for a low, in april and in may. Think May is the most likely.
Thanks to Ron from earlier for the data, and as you can see the Venus latitude points to a major amplitude (high?) on 3/20/17. SImilar amplitudes have led to some pretty big turns http://imgur.com/a/AIAF2
You’re welcome. I enjoy that chart too:)
Thx Ron. Let me know about that follow up email I sent you
In carolan’s system we should see this:
spring low 5/18/17
summer high 6/25/17
fall high 9/21/17
crashlow 10/17/17
It is remarkable 9/22 is lilith 120 degrees the node; according to McMinn a financial panic.
you know my expectations for March and May…currently traveling…will check the data next week and get back to you relative to the other dates…be well!
thanks
A spiral date on Gold gives 3/15.
A new post is live: https://worldcyclesinstitute.com/relax-it-always-happens-like-this/
This website is for educational purposes relating to Elliott Wave, natural cycles, and the Quantum Revolution (Great Awakening). I welcome questions or comments about any of these subjects. Due to a heavy schedule, I may not have the time to answer questions that relate to my area of expertise.
I reserve the right to remove any comment that is deemed negative, is unhelpful, or off-topic. Such comments may be removed.
Want to comment? You need to be logged in to comment. You can register here.