
 Truncations Don’t Exist

Truncations are one of those Elliott Wave market anomalies that don’t exist, in fact. There has never been one; each example in the book is bogus and at no point in the past hundred years, have we ever seen a documented example of one.
I have argued that, in fact, it doesn’t make any sense for one to appear. In that case, the discovery of the Elliott Wave Principle in the 1930s by Ralph Nelson Elliott would not be a science (as I have long maintained it is). After all, I have never seen it fail and I used it with great success every day of the week, at all levels of trend.
Now would be the perfect time for a truncation, of course, due to the fact that we have the coronavirus scaring a lot of people to death. While I’m expecting pandemics to start to crop up as it’s turning colder and dryer, this one appears to be man-made. It seems to have been a stolen from a Winnipeg, Canada lab and weaponized, ending up being released in the area of another world-renowned lab, in Wuhan, China. This story raised its ugly head about three weeks ago, and now we have the mysterious death of a Canadian (connected) Canadian scientist.
But, the market pays no attention, as it has a job to do. It’s like The Little Engine That Could, a well-known children’s book that I grew up with. It will keep going until the final sub-wave traces out in every affected asset class. Then, and only then, will everything turn at once.
There are no black swans that people keep talking about. The market doesn’t suddenly “crash.” People have imaginations and they use them. They don’t do their homework and figure out what’s really going on. My goodness, if they did, the entire market pundit industry would be on the ropes! OMG!
There is so much misinformation and propaganda out there, you can cut it with a knife (as the expression goes). That’s an phenomenon of the top of a 500 year cycle. The same thing happened at the top of Rome, in the period of the reign of Queen Elizabeth I, and to lesser degree at incremental 172 tops.
By the way, these same 500 year tops saw the same type of corruption we’re seeing come to light as the US Empire start to disintegrate. The CIA, Deep State, FBI and other elites will be found to have plotted against the government. Grab your popcorn; the next couple of years are going to be both interesting and very scary to very many on the wrong side of history.
But, “The Little Engine That Could,” the movement of the market, will keep on chugging along, doing its thing, which is providing a mathematical representation of the mood of the herd (the masses, in other words). Gradually, in this rally, the mood of the population is turning negative—you can see it in the wave structure—the waves get smaller, and shorter and shorter, but the turn will not happen until the final sub-wave plays out.
That event is coming very soon. It won’t be a surprise.
__________________________________
DXY (US Dollar Index)
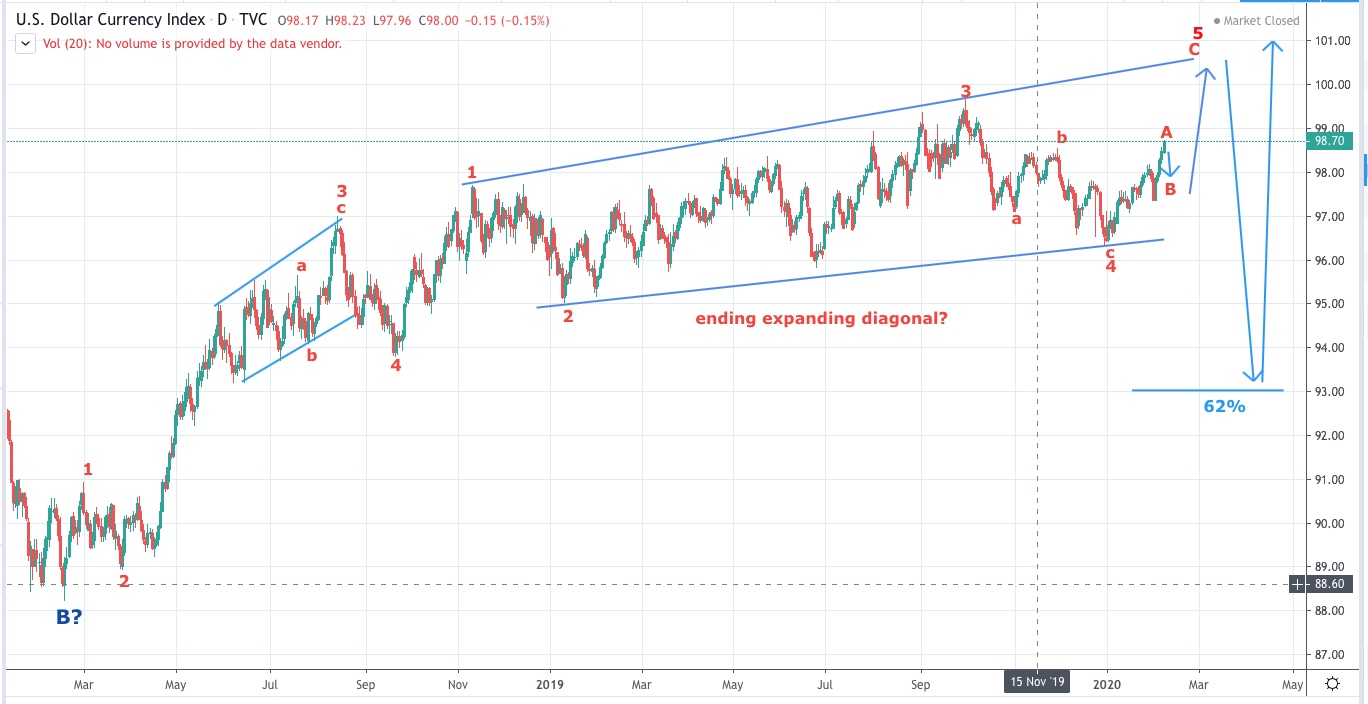
Above is the daily chart of the DXY (US Dollar Index).
The US Dollar is, of course, the world’s reserve currency. The international economy revolves around it and, for the past four years, or so, other assets classes have been becoming more aligned with its movement. These days, the international stock markets are moving more of less in lock-step with the US Dollar Index, as the reported 250 trillion dollars in worldwide debt fluctuates.
For months now, I’ve been calling for a trend change in the US indices when the US dollar reaches the bottom of the last leg of what appears to be an ending expanding diagonal (marked 1,2,3,4,5) showing as a sort of “channel” between the slightly rising trendlines in the chart above. This week, it continued up to complete five waves to the upside.
So, in fact, the US Dollar Index has already turned. We have a non-confirmation, of sorts, between it and the the US indices. That being the case, it now will partially retrace to the downside in three waves before turning back up to trace out another segment of what appears to be a zigzag.
The US Dollar moving up is deflationary (it increases in value) and inflationary in the opposite direction. The EURUSD has a similar pattern in the opposite direction (a regular ending diagonal in that case). When the Federal buys more debt, this injects liquidity and the dollar moves to the downside (decreases in value).
The week before last, the Federal Reserve announced that it is resuming the liquidity operation it began in the fall of last year, in an attempt to increase reserves in the US banking system. They’re obviously losing the battle.
Know the Past. See the Future.
____________________________
Elliott Wave Basics
Here is a page dedicated to a relatively basic description of the Elliott Wave Principle. You’ll also find a link to the book by Bob Prechter and A. J. Frost.
______________________________
Tops in your field DZ 2
Tops in your field …You are tops in your field. Tried to follow Elliot Wave international for years. They were always behind the market. After discovering you, I perceive that you are an expert in reading the waves, which puts you way ahead of the rest of your peers. And you can read the Waves like you are reading tomorrow’s financial section. I pray you stay healthy. —DZ |
Get an upper hand … JC 2
Get an upper hand in trading …Seeing all the different currency pairs and the wave structures and hearing you explain why this has to do that on a nightly bases gives one a upper hand when trading. Elliott Wave applies to all stock and indices and can be applied to any candlestick chart. If someone ask what you want for Christmas – Tell them a membership to Peter’s “Traders Gold!”—JC |
A true expert in Elliott Wave FL 2
A true expert in Elliott Wave …You are a true expert in EW analysis. What you provide is not available anywhere and is priceless. Subscription on your services is the best thing I have ever done. Many thanks for your effort to make me a better investor. I now have more trust in my investment decisions. I hope you will continue the excellent work! —FL |
Have not had a losing week RW 2
Have not had a losing week …I have been with Peter almost a year. The only thing that matters is have I made money with his service. I think I have finally turned the corner using Peter’s EW. I have not had a losing week in the last 5 months. Thanks Peter, for your amazing amount of hard work. —RW |
the real deal SM 2
The real deal …‘Educational, insightful and thorough market analysis for all levels of traders. It’s Elliott Wave at its best….Peter Temple is the real deal’ —SM |
Couldn’t be happier … KK 2
Couldn’t be happier …The analysis and insight you provide is simply amazing! I’ve been trading the futures and equity markets for well over thirty years and usually average around 5% monthly. Since joining your Traders Gold Service two months ago, that number has better than doubled. I couldn’t be happier.—KK |
Rise above the rest … SM 2
Rise above the rest …I have only ever met a few people who, in their chosen fields (astrology, medicine, music, martial arts, technical analysis), rise above all the rest and you are one of them…you have ‘the gift’…and that’s why I’m a Trader’s Gold member. —SM |
The best of them JL 2
The best of them …Last couple of years, I subscribed to several ‘market traders’. You are by far the best of them and the personal contact is awesome. Daily and daily updates are very well written! Besides your expertise in EW, I also like your cycles analysis. Best investment I ever made! —JL |
US Market Snapshot (based on end-of-week wave structure)
This chart is posted to provide a prediction of future market direction. DO NOT trade based upon the information presented here (certainly NOT from a daily chart).

Above is the daily chart of ES (click to enlarge, as with any of my charts).
We're now in the final sub-wave of the rally from Dec. 26, 2019.
The wave up is a B wave of an expanded flat, a corrective wave, which I identified right from the start. It will completely retrace to the downside in five waves.
The turn is imminent, but since it depends on the movement of the US Dollar, which has a corrective wave to the downside to complete, the turn date remains a question. The advance in the US indices has slowed to a crawl. While the gap is very small, guessing the time it will take to get there is anyone's guess. A few days; a week?
All the US indices (again, as I've long maintained) need to reach a new high. The stragglers are the Russell 2000 and the NYSE exchange itself (certainly no surprise in either case; they're typically the ones we wait for).
Late Friday, we saw the start of a turn in the US Dollar Index after what appears to be a "broadening top" type pattern. As the wave down should partially retrace the five waves to the upside, it's difficult to tell where it will turn.
With five waves to the upside confirmed, the US Dollar Index has already turned up for the longer term. The partial retrace expected to the downside this week, will be corrective and result in more upside.
But since everything should turn together (oil, gold, silver, US Dollar, USD currency pairs, and the US indices, there will be some warning. It's also just as easy to pay attention to the wave count, which it almost completely played out.
The DAX, which appeared to have topped last week, did not complete its wave down (the final wave down came up short) and is now back up to a high. It will also turn with the US indices. It's going to be quite the drop, as virtually everything will move in tandem.
___________________________
Summary: The current B wave up is most probably the B wave of an expanded flat. The A wave ended on Jan. 26, 2018. The B wave rally has all but ended, as other asset classes I cover have turned, or are about to turn after one more small wave.
We're going to drop from here into a large fourth wave. Look for the ultimate bottom to be somewhere under 2100 in ES.
Once we've completed the fourth wave down, we'll have a long climb to a final slight new high in a fifth wave of this 500 year cycle top.
_______________________
There is an option of a set of zigzags down to the same level, but it's much less probable because there are so many flats set up across multiple stocks and indices. If a zigzag is the pattern that traces out, the retraces up will not be as strong as they would be with the C wave of a flat. We'll get a lot of information about the probable path from the first wave down.
_________________________________
Trader's Gold Subscribers get a comprehensive view of the market, including hourly (and even smaller timeframes, when appropriate) on a daily basis. They also receive updates through the comments area. I provide only the daily timeframe for the free blog, as a "snapshot" of where the market currently trades and the next move on a weekly basis.
I do a nightly video on the US indices, USD Index (and related currency pairs), gold, silver, and oil) right down to hourly charts (and even 5 minutes, when required).
______________________________________
Sign up for: The Chart Show
Next Date: Wednesday, February 19 at 5:00 pm EST (US market time)

The Chart Show is a one hour webinar in which Peter Temple provides the Elliott Wave analysis in real time for the US market, gold, silver, oil, major USD currency pairs, and more. You won't find a more accurate or comprehensive market prediction anywhere for this price.
Get caught up on the market from an Elliott Wave perspective. There’ll be a Q&A session during and at the end of the webinar and the possibility (depending on time) of taking requests.
For more information and to sign up, click here.
| "I think you are the only Elliot Wave technician on the planet who knows what he's doing.” |
| m.d. (professional trader) |
All registrants will receive the video playback of the webinar, so even if you miss it, you’ll be sent the full video replay within about an hour of its conclusion.


