Update Friday, Feb 5, Noon EST
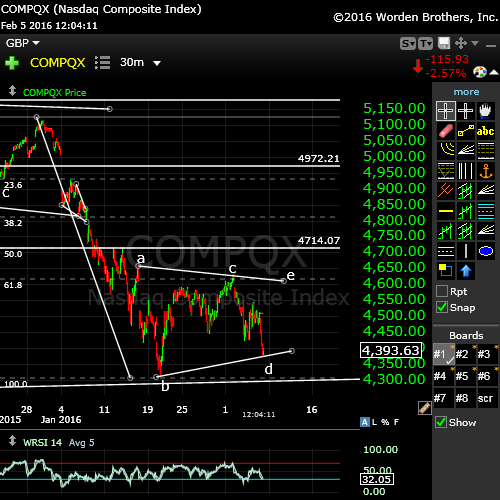
The Nasdaq “gave it away” this morning. Here’s the 30 minute chart of the Nasdaq. We are definitely in wave 4 of the first wave down. We should now turn up in an e wave, which is the last wave in a triangle, and a fifth wave down will follow. The other indices will be in the same position, but do not show a triangle as the pattern. So … nothing has really changed. We have one more leg up … more patience required.
I will produce a new post this weekend with all the indices in it and targets (although they haven’t changed, either).
_______________________________
Update Thursday, Feb 4, After the Bell
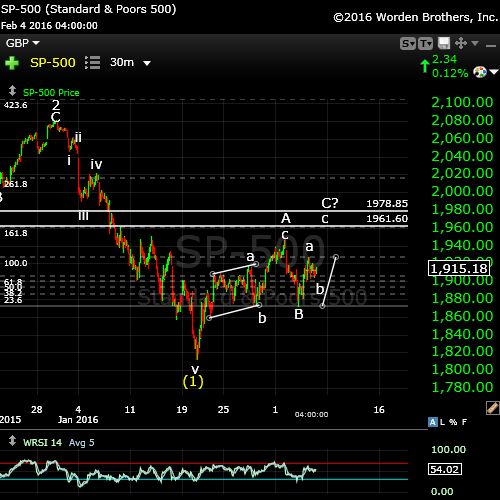
Above is the 30 minute chart of the SP500 showing are progress so far. In terms of the count and measurements, nothing has changed in SPX. The most recent B wave came down to the previous b wave and so the count remains the same. We’ve now completed the b wave of the second zigzag and based on the length of the a wave of this final zigzag, I’ve raised the target slightly to 1961. This would amount to a c leg the same length as the a wave.
Since eurodollar is moving inversely to equities, consider watching for a turn in the eurodollar at the previous fourth wave level (1.1074). It may coincide with a turn in equities.
_______________________________
Update Wednesdasy, Feb 3, Before the Bell
Up we go again in equities. We should see a top today or tomorrow. I expect a new high.
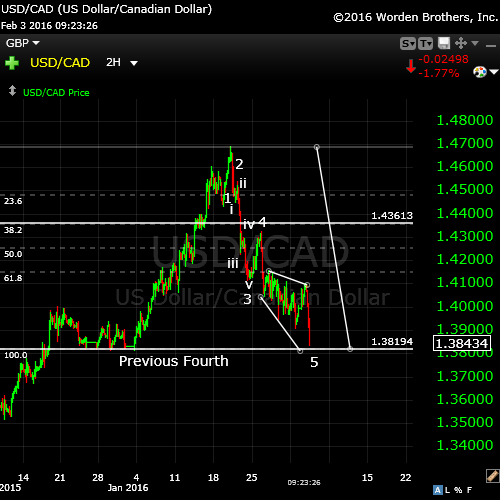
Here’s the 2 hour chart for USD/CAD. It’s reached the previous 4th now (as mentioned earlier as the target) and should turn in this area and retrace about 62% to the horizontal line. Then it will turn back down into a third wave.
___________________________
Update Tuesday, Feb 2, Before the Bell
This morning we have a fourth wave down in futures. This will lead to a final fifth wave up to tag the previous high. Then we will head down into the fifth wave.
Currencies are all reversing. Eurdollar has done a full five waves up now and should retrace 62% down before heading up in a much longer third wave.
Update Monday, Feb 1 Noon EST
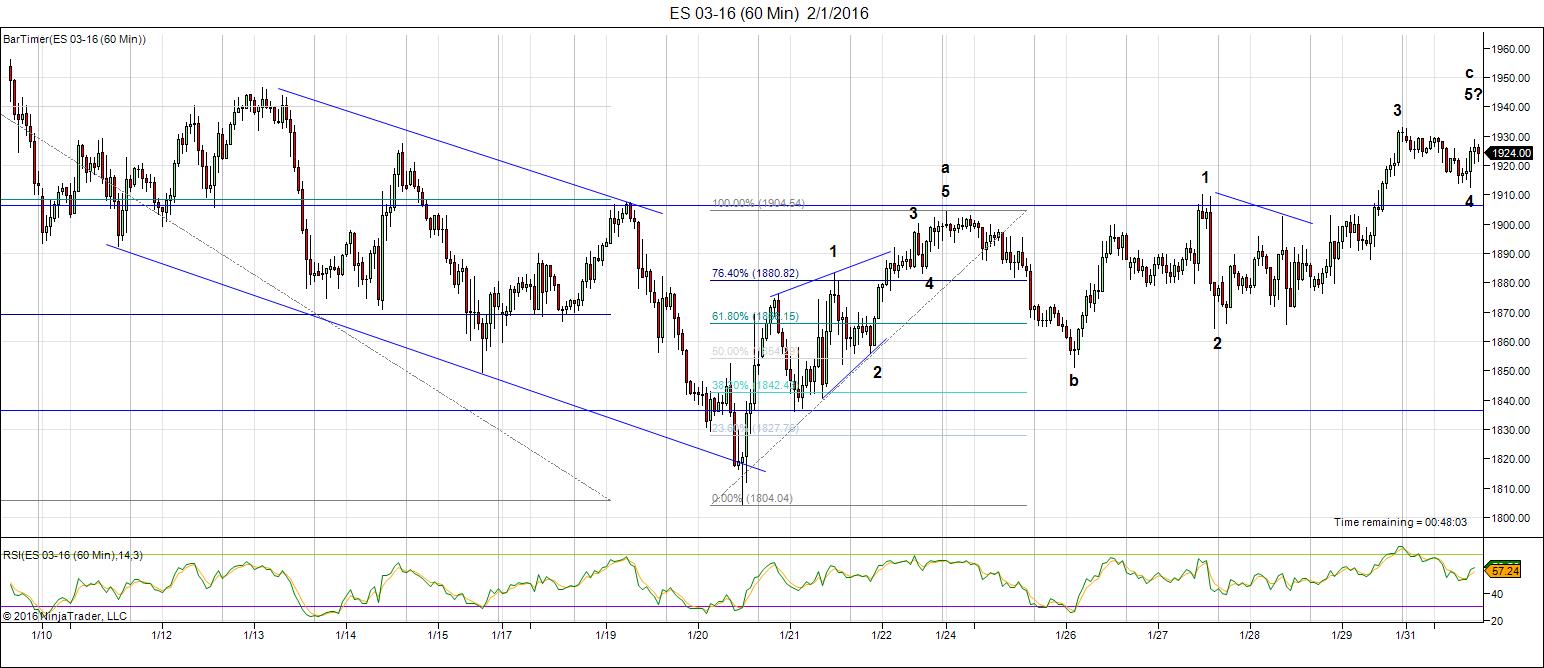
Here’s a 60 minute chart of ES (emini futures – SPX) showing where we are right now. We’re a bit short of the previous fourth wave, but certainly “in the area.” We have an abc corrective wave up overall from about 1810, with two waves of 5 waves each (almost). We would at least want to see a new high … and we want to be looking for a top. We could go up further, but it looks like we’re in the final wave up.
_________________________________
Original Post: Saturday, Jan 30:
“The Little Engine that Could” is a children’s book that was published in 1930, interestingly enough—right after the market crash. So I thought it appropriate to use the title here, for this wave that just isn’t going to make it very much higher, even though it’s chugging away with very good intensions.
We’re either completing a second wave or a fourth wave up. There are options as to where it will stop and that will give us more of a clue at to what it is. Usually, this would be obvious, but because of the truncation of wave 5 up, this particular wave is much harder to read.
Five waves down will signal a trend change. We may already have it (I believe we do—from May 20), but the next wave down, no matter what it is, will signal a trend change as soon as it drops to a new low. At that point, the fibonacci projections will become much more accurate, because we’ll know where we are.
Even so, I’ve posted a chart below of the possible downside targets, again based on where this wave up turns over.
Here’s a video overview of the market as at Saturday, January 30:
Market Report for Feb1, 2015 |
____________________________________
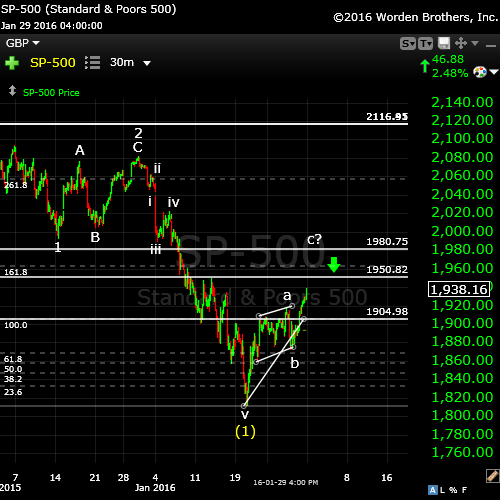
Above is the 30 minute chart of the SP500. We look to have completed wave 3 of the c wave at the end of the day on Friday. I expect us to start down Sunday in a 4th wave which should retrace about 38% of the c wave. Once that’s done, we should turn up into a 5th wave up to complete the c wave.
There are options in terms of the stopping point of this wave. My fibonacci extension (not shown accurately on this chart) points to 1980, but the previous 4th wave is at 1950. However, I place this fourth wave at two degrees lower. The bottom line is that we should turn over somewhere between 1950 and 1980. The point of turnover will help determine whether this is a second or fourth wave.
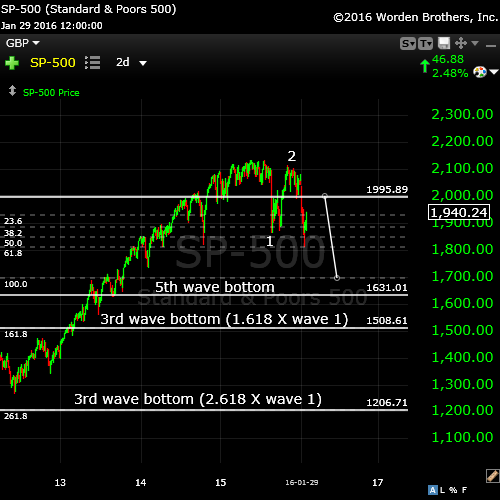
Here’s a 2 day chart of the SP500. It’s a longer-term look at the possible targets on the downside, depending on what this next wave down turns out to be.
If this is a fourth wave, the typical stopping point would be a 1.618 extension of the first three waves down (approx. 1631). If it’s a second wave, the third wave down will be at least 1.618 X the length of wave 1 (truncated), which should drop to at least 1508 and could possibly drop as much as 2.618 (1206). We’re going there eventually, one way or the other.
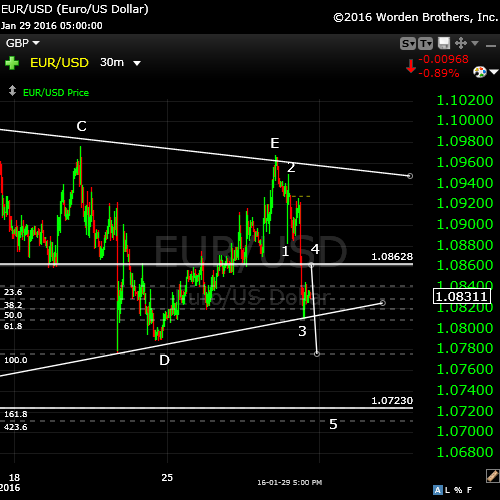
Here’s a chart of the euro/dollar (30 minute) showing the triangle. The euro has been running counter to equities in lock-step pretty much. When it heads down, equities head up. On Thursday night, we completed a first and second wave down and on Friday, continued down into the third wave. We’re now bouncing in a fourth wave of the third, which should retrace 38% of the third wave, or to 1086 before heading down into the fifth wave.
Longer term, I’ve been expecting it to head down to tag the previous low before heading up in tandem with the rest of the US pair currencies, but I think now it will likely stop at the end of the fifth wave down, at approximately 1.0723.
I expect the eurodollar to head up as US equities head down, which means the US dollar should head down at the same time.
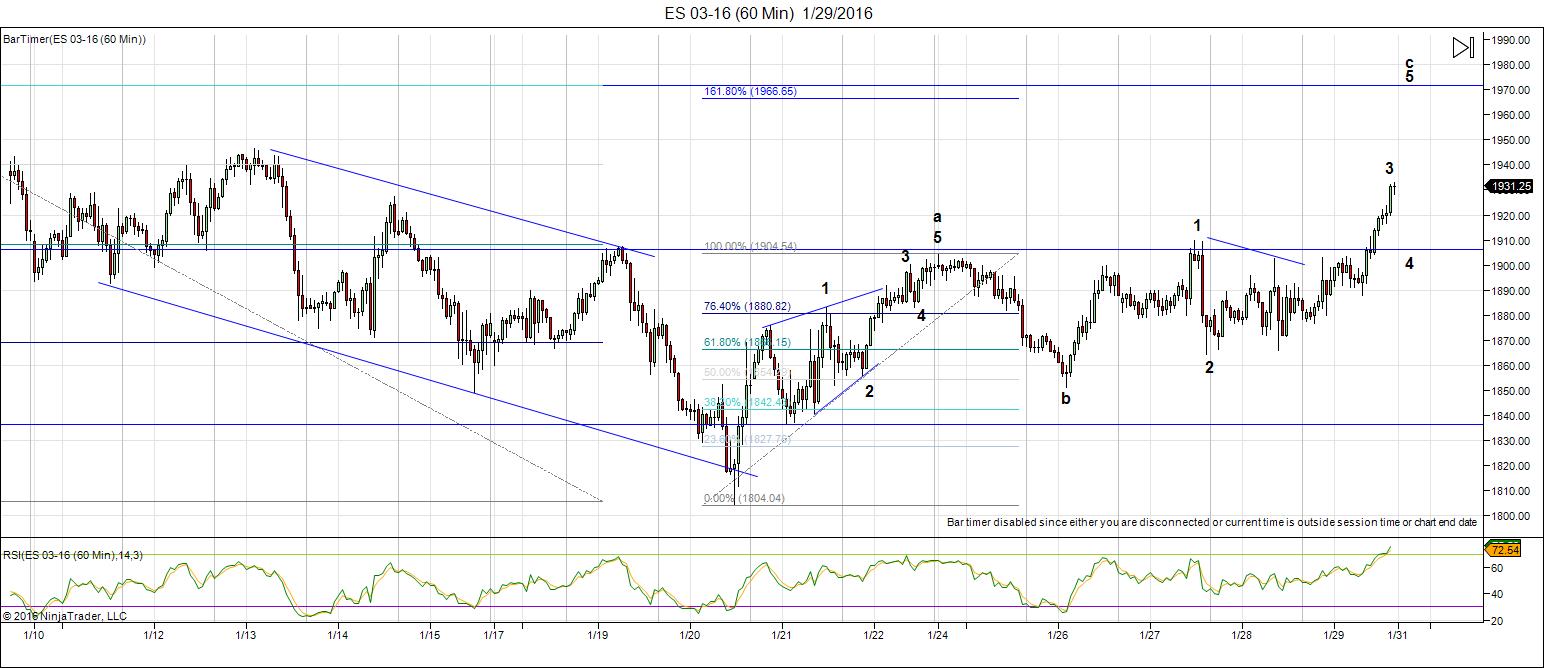
Here’s ES at the end of the day (one hour chart) on Friday. You can see that we’ve completed wave 3 of the C wave, as predicted. Sunday, we should start down in a 4th wave of the C wave, leaving the 5th wave up to a top (I measure the top at 1966 or so, which is a 62% retrace). I expect this to take two-three days this week to get there.
__________________________________
History: The 1929 crash
I posted the 1929 chart a few months ago and now’s the time to bring it back to the forefront. I would expect a similar path moving forward.
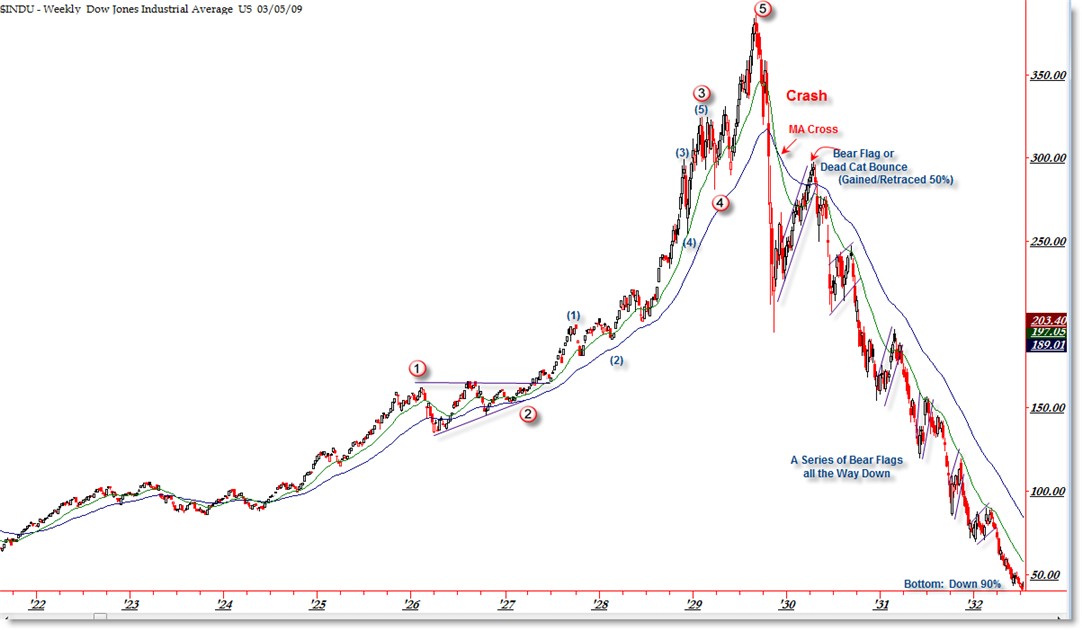
I think it’s important to look at 1929 and the wave structure (above and below), which was the same as 2007—to a point.
The wave structure of the 1929 crash was in 3 waves overall. There were 5 waves down from the top (the A wave) and then a very large B wave retrace. The final C wave down was a stair-step affair and lasted over 2 years.
In our current situation, we’ve had wave one down that’s lasted three months (May, 20, 2015 through Aug. 24). Then we had wave 2 up, which lasted from Aug. 24 through Dec 31, 2015 (approx. 4 months). I would expect the wave 3 sequence down (all the waves—the A wave) to last approx. 3 months. Next is the fourth wave (B wave), which should be at least 6 months, I think and then the final C wave to the bottom, which will likely last a couple of years.
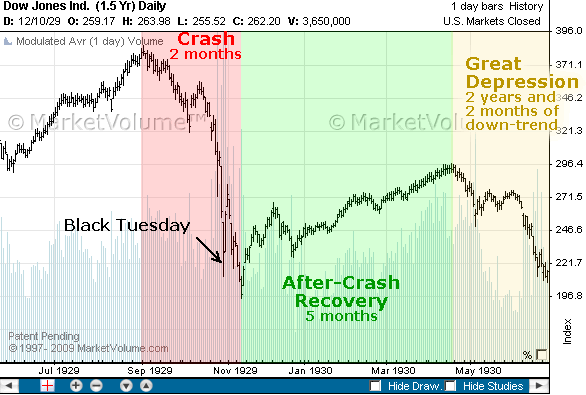
Let’s look a little close at the timing of the 1929 crash because the similarities to today are uncanny.
The market peaked on September 3, 1929 and then it took 2 months for the crash to actually happen (to reach the bottom of wave 5 of the A wave). The larger crash which we always hear about began on October 23, 1929. Then there was that large B wave, which lasted 5 and a half months and finally, the C wave which went on for more than 2 years. This might be the scenario we’re looking at going forward.



Thanks Peter…..nick
Thanks! 🙂
Good review Peter.
Thanks!
Since we are discussing 1929 it let’s revisit the crash angle. This angle is defined by the number of days between the nyse birth date and the 1929 high date. This angle is 122,143 degrees, close to a trine (120).
In the square of nine we find the associated numbers on this angle.
Adding these dates to the 5/20 high gives powerful turns. One such number was 195. Add that to 5/20 and we get 12/1/2015. We know what happened then.
The next number on this angle is 255. This gives us 1/29/16. In other words; this is a crash date. (to illustrate how strong these numbers are : the price angle of the 10/15/14 s&p low was 253 degrees).
So I think the market couldn’t ignore it. Yesterday I explained how gravity provided the fuel for this retracement. The pop Friday wasn’t sentiment driven. Portfolio managers needed to rebalance their portfolio’s on the last day of the month due to the January decline. So this was a one day wonder. NOT a W3!.
Bayer has (had) this rule about mercury 80 years ago. 1/31/1936 the sun was conjunct mercury. Coincidence?
Cheers,
André
As Peter is fond of Fibonacci let’s do a little exercise.
The number of days between 5/17/1792 and 9/3/1929 is 50146. 61,8% of this would be 30990. Add that to 9/3/29 and we get 7/9/14.
Carolan has a very long spiral that gave 12/25/15, based on the full moon close to the winter solstice.
Let’s assume both techniques work. The midpoint between the two dates is 4/2/2015, close to the 20/5 high. For calculations that go back 100 years or more, 1 month difference isn’t really that much.
One remark on the 1929 analogy. In 1929 the wheeler cycle – according to the drought clock- was still up. In 2000 both cycles (100 and 170 years) turned. So I really wonder what that woud mean for the forcast. I still think 2018 as a first target is the least to expect, with 2020 a very likely alternative. So this down wave may be one for the history books.
Just a little Sunday morning contemplation.
André
André,
I put the Wheeler cycle at 172 years actually (as per Puetz). I’ve equated it with the Uranus/Neptune conjunct, which averages 171.4 years. The last three conjuncts, exactly 14 years later we’ve had a stock market crash, the latest being 2007. The most recent conjunct was 1993. Then there was were the 1835 and 1663 crashes. Before that, the dark ages and we don’t have a lot of info on that era. Some thoughts.
As per André’s comments, the drought clock is here: https://worldcyclesinstitute.com/dr-wheelers-drought-clock/
Everything on track tonight (Sunday) ES may only drop to 1915 and eur/usd is heading up to 1.086, where it should turn over into a fifth wave down.
Peter,
For the sake of argument I would like to present an alternative view. I have reasons to assume 2000 gave a W3 high. After that in 3 waves down into 2009 (2003 low, 2007 high, 2009 low), to complete a 9 year cycle (march 2000, march 2009.
Then the Fed started the QE circus to drive world debt to unprecedented levels. In my book typical W5 behavior.
The Japanese are so desperate, the BOJ had to introduce negative interest rates last Friday. Now that is the 5 of a 5; trying to make money on your debt. And I thought they wanted inflation!
This has to end bad. Very bad. And I think we are running out of time.
Just some thoughts.
Cheers,
André
Sounds like logic to me André! 😉
Cheers,
W
So my outlook remains : down into february with 2/7 low, 2/14 high, 2/22 low.
Andre’
Hi andre’
I tend to agree with you with those dates . And I remember you mentioning
The feb 7 ish date prior . I’m still watch the den 3-8th time frame
Along with the feb 23 rd date .
At this point I’m not calling them highs or lows .
That said feb 23 to me will matter yet feb 3-8 is a starting point .
Peter
The puetz window has been extremely helpful to me over
The years only because I have expanded on it . Yet it was
By observing its failures that I learned from it . So I credit
Steve puetz yet I use it in my own expanded version .
As for the 2007 top . That top was much easier to see coming
As was calling the bottom before the trend even turned down .
What amazed me then was seeing the forecast play out
Almost exact as the 10 year pattern called for .
I still have issues with this market as bearish and I find
Andre’ and his recent posts going back to July 2014
( posted above ) fitting to my thoughts I’ve already mentioned .
Pretty much everyone is now saying a bear market has begun .
I see how this can be a bear market but I’m not convinced
Do to the timing . Andre’ is sticking to 2018 as a low and I’m
Sticking to it as a high . My methods I can’t toss out and I’ve
Researched them in depth . No doubt Andre’ as well as yourself
Have done your own in depth research . My concern is
Not being right but knowing when I’m wrong and only once
The market proves me wrong can I adopt the bearish move .
On that note the Dow failed to hit 18137 chock one against me .
The spx blew threw 1848 on Jan 20 and yet turned back
Above it . Not a good call yet time was a direct hit .
The Dow has held the August lows , slight positive yet no proof
It’s a bottom . We are now entering the puetz window for better
Or worse it’s trend is beginning . A low I nearly February would fit
As would a low on the full moon February 23 .
Then March 8 would need to be a high with March 23 a low . On top of
This the Dow really must hold the Jan 20th lows . It’s a very tall order
To ask of this market . As for it being a 4 th wave or a 2nd , I prefer to
Say we only have 3 waves down and as for the truncation I prefer to say
We only had 3 waves up . This implies waves 1 2 and waves I. Ii. Iii are the only
Waves in place if this wave is wave iv wave v is the 3 .
I can only label the waves I see not the ones I don’t .
Late April is the end of the cycle and as much as I want it to be a high do to
My own model I can see other reasons it’s not .
My model though has been very consistent for many
Years and I’m not going to call it an inversion just yet .
If the cycle has truly turned up then 2116 on the spx
Gets taken out and 18138 on the gets hit by June this year .
The only way that can even possibly happen is if March
23 is a low and we see a repeat of what happened in October
All over again . The old rule fool me once shame on you
Fool me twice shame on me applies ( speaking of the market obviously )
The next Venus and Mercury sun conjunction will be technically
Called the starting point of a Venus bear cycle . They don’t both hit
Exact at the same time but until that date comes I’ll favor the upside
Until proven wrong . It’s an inferior and superior conjunction
Joe
Joe
Sorry, I have to keep remembering to watch for comments in spam … argh.
Thanks Joe,
It is very clear the only thing I want to add is the panic cycle that can paly it’s role
see link below:
http://timeandcycles.blogspot.nl/
Dear Peter and Andre,
I have been following this blog very closely and I
would say Peter and Andre are about the best around.
Btw I subscribe to many other newsletter and there are very few as accurate as
the both of you.
Maybe it is old news already but just a quick reminder….
Feb 26 is the day when NYSE and Nasdaq will not entertain
A) stop order
B) Good to cancel order
Talk about counterparty risk.
Vince
Great reminder, Vince – on the stops.
Thanks for the kind words.
Sorry, had to rescue you from spam so you’re a little late in getting posted.
I would put Joe in that category.
Hi Dave,
Everything oke?
I agree
The euro went up a little higher than I predicted to just about a 62% retrace, so what we have now looks like a double second wave, which lead me to believer the euro is headed much lower. Better for my bigger picture, even though I’m not happy about it this morning …. 🙂
Lower Euro, higher indices, loving it. ^^ So now the price for put options will decrease even more. 🙂
I’m out of the market now, but I’m switching to “5 wave down watch.” I expect the market to top this week, and will be watching for 5 small waves down to confirm … and likely a double top in most of the major indices. The double top will be the first signal, of course. I’m not expecting it today, but it’s not far off, imho.
My numerical targets as posted in the blog have not changed.
We have a possible 5 waves up here, so I would be wary of the current setup. If we get a double top around 1936 SPX, although a bit short of the previous 4th, I’d be watching carefully. We’re struggling and I’m showing some indicator divergence …
I’m now neutral eurdollar.
I just posted a new chart of ES – where we are now.
ES and SPX have now dropped back into the 62% retrace area after what looks like 5 waves up. That suggests a second wave, so we may get a third wave up (of the 5th), which means more upside, which will likely get us at least to the previous 4th wave level.
This current rally (5 or 10 min chart) in ES and SPX puts us the third of the fifth of C.
I’m short the euro again … with a tight stop! I still think it’s going to drop out of the triangle. The triangle now, however, could be bullish or bearish. Hard to tell.
Looks like 1980 on Es possible.
R
Possible, but I don’t think we’ll get that far. End of this third wave should be about 1946 in ES and that makes the 5th wave top at maybe 1956. But these waves don’t need to be regular lengths, so hard to say. Depends a lot on the wave 4 retrace.
Peter-
On The SPX (cash market) What is the level that differentiates a wave 2 versus a wave 4, do you have a “line in the sand” or will the look of the next wave down give you more of a clue?
Ted,
Usually it’s 38% for a fourth wave. Getting close to 62% leans towards a second wave. That’s normally how simple it is. However, I believe we’re dealing with a truncated wave, which is extremely rare and it upsets the “look” and structure of the wave. So this particular retrace is a bit of guesswork in terms of what the wave is. The gravity of the retrace will also dictate the length of the next wave down. It’s a bit of a “wait and see,” unfortunately.
Let me just add that there are a couple of ways to come to a target. As well as measuring the length of the full wave down to determine those retracement levels, you can also measure the corrective waves. The C wave up is usually either the same length as the A wave or 1.618 X the A wave. I think you’ll find the range of those targets in the blog post. I don’t have them in front of me at the moment.
I tried to answer your question as much as I could, but this wave will be a bit of a guess.
Not a problem thanks for the input!
Hmmm. Something popped NQ at the end of the day. Who reported? Anyone know?
Alphabet, I guess.
SPX looks to have got in a fourth wave by the end of the day, so that would leave only one small wave up for it.
Hi Peter,
SPX has a gap around 2044 . Don’t you think that the current wave 2 need to close this gap before we start wave 3 ?
Regards
AZ
AZ,
haha … have we had this conversation before?
If I extend the fib tool using the first wave of this fifth wave up, given that the fifth is typically 1.618 X the first, then the highest SPX can go is about 1964, so no. And quite frankly, I don’t think we’re going to get that far, because that level’s not quite the 62% retrace level and it has no other significance that I can see at the moment. I think it more likely that we turn around 1950, but I could certainly be wrong about that.
In fact, AZ, futures tonight are suggesting to me that we may have already topped. Currencies also are leading me in that direction.
Nope. No top. Close, though. One more small wave up, I think.
Hi Peter
Thank you for your reply , and yes of course I do remember asking the same question few months ago , and you gave me the same reply :-)) nice how cycles repeat itself !
I think we need to wait and see what will happen , but if we do get up to close the GAP , then I feel it might be a very good short .
Regards
AZ
And now I’m back into the first wave down is complete camp. Just looked at the market – middle of the night here. 5 AM EST. We will likely open lower and do a 62% retrace and that’ll be the short entry.
Sorry, 1am EST. A bit groggy …
Or we’ve completed a fourth wave and will simply run back up and tag the previous high. Either way, we’ll have an interesting day.
Hi Peter,
So what is your retrace level voor SPX?
John,
Not sure I understand. Because it’s a fourth wave, it’s going back to the top so whatever that is.
I’ve posted a quick little text update at the top of the post.
Thanks…
Since I posted, ES has come down to a new low, creating overlapping waves, and NQ has created a wave in 3. So I’ve corrected the post entry. We now have a fourth wave and should tag the high (or go a little higher) before turning down into a fifth wave.
Another drop. The support trendline up from 1810 or so for the SPX is at about 1907, which is where we may be settling. This is still a wave down in 3 waves so I expect for that reason, and for the additional reason that the waves up don’t look complete, that we’re expecting another wave up to a new high. From a cycles perspective, I don’t expect a top for another day or two.
Also keep in mind that for any motive wave down (which is what we’re looking for, we need a second wave (which requires a 62% retrace—the preferred entry point) from an EW perspective.
I’ve been out for the past couple of hours and just now looking again at the market, which has continued to drop. However, I don’t see a motive structure, so I’m expecting a full retrace to the top. I’ll let you know if that changes. In ES, I would expect a low at 1890 (one more small drop). In SPX, we have an ending diagonal forming, so we should be close to a low. In SPX, we’re at just about a 38% drop of the entire wave (62% drop of the C wave).
We’ll be alert for a 62% turnover anyway, but my first inclination is to call this a deep fourth wave.
Peter-
Keeping in mind that your preferred count is this is a deep wave 4, could you provide some feedback on this as an alternative count. I am using the SPX as the example.
Yesterday as the top of wave 1 of wave c. Wave 2 of wave C completed this afternoon. You made a comment that correctives waves do not have to follow regular fib rules, so we get a wave 3 that is smaller than wave 1 and a wave 5 that is smaller than 3, to complete C (Since wave 3 can never be the smallest wave). Potential target could still be the 1980 area and wave A=Wave C.
I do like to use other technical analysis to help confirm wave counts. Comparing the Daily MACD to other drops in history, only the second half of 2008 produced a daily MACD more oversold than the one reached on 1/20. (Granted from reading Prechter, we should expect some record oversold conditions during this overall bear market). This made me think we had to spend more time/movement to work off the oversold reading wand get to wave 3.Though i think your turn dates still make sense, this drop to the 62% made me look at this alternative wave count scenario.
Ted,
I don’t have an issue with 1980 as a target and in fact, that’s still the 1.618 extension of wave A up. It’s certainly viable and I’ve not ruled it out. But is would still be wave 5 up. We’ve done wave 1, 2, 3, and 4 (now). We haven’t had wave 5, so you can refer to the C wave as wave 1, as it’s not complete. We’ve had a lower degree wave 5 of 3, but not the higher degree 5.
So it really doesn’t differ from my count, other than that fact. We could still get to 1980 (as an upper end).
Peter,
isn’t it a little bit long 80 points for this 5th of C compared to 1 and 3 ?
Wave 3 of C is about 70 points and in a motive wave situation, wave 5 is typically the same length as 3, so I don’t find it out of the ordinary at all. It might be surprising in this market, but nothing more. There are certainly no rules or guidelines in the way.
I added a quick update and a chart for USDCAD, which is at the previously identified target.
Boy, you really have to keep your eye on either the euro or dollar as the market reacts to them dramatically. Euro has done one wave up now (looks like a first wave) and I expect it to back up at least 62% as we head up in equities. The third wave up in the euro looks like it will be quite the spike.
ES starts to look like a first wave down (although still a “3”) but SPX still looks like a B wave. I still think we’ll head up one more time … but we wait to see if there’s any more downside left.
Peter-
Do i take this to mean that Monday’s High is the end of the A wave of Wave 2? Or are you suggesting this is still the Wave B of Wave 4 of C of 2?
I am sure all of those subsets are as clear as mud.
Yeah, clear as mud is about right. This wave down in equities is in 3 waves, as far as I’m concerned. It’s missing some second waves, etc and it doesn’t measure correctly. So this tells me we’re headed back to the top. Other than that, I can’t say much more at the moment. Monday’s high would have been the top of wave 4 and we may tag that high. I’d be surprised to see us go any higher.
I’m watching the euro for clues. It should come down in a second wave (it’s got the clearest wave structure). When it does, equities should head up. But the euro has a second wave to do, so at the end of it, we should head down in equities.
The currencies are what’s moving, but I don’t know what the game is quite yet.
The eurodollar seems to be completing a large flat to the previous 4th wave, which would suggest that it’s going to come way back down and finally bottom. Other us currency pairs seem to be at extremes, as well.
Hi Peet and the rest,
I thought 5 Feb would be important and it might still be. However, the 5 Feb top I suspected has been made this Monday already it seems…
If you ask me, we are in 2.B down already. I will talk to you later this week Peet!
Cheers,
W
I was starting to think we were in a B wave of wave 2. That means wave A would be about 135 for SPX, which points to around ~2005 on as the top of C. Since Stocks and oil are fairly correlated at the moment, that seems to match nicely with a target of high 30s for the wave 4 of an ending diagonal. Then when wave 5 of oil hits, we should see this wave 3 in equities. 2000 on the SPX is the 62 retracement from the Nov 3rd top, which adds intrigue.
1956 is still a potential concern for me as that would mean wave C is .618 of wave A. I think that still matches with Peter’s targets. My other one is certainly high.
I would not be at all surprised to see a solid wave 2 out of this, partly based on what currencies are doing. The dollar is clearly in control and after a second wave, the euro will be set up for a third, which would correlate nicely with a third down in equities. Speculation on what I’m seeing across the board.
Depending on the index, the wave down came down to the previous 4th, or B wave, so we’ll at least see a new high …
I think eurdollar is topping … this is at the previous 4th. Possible double bottom on NQ to watch if you’re trying to get long ES.
So much for NQ … still difficult to figure out what equities are doing …
Peter,
what level do you see Eur\Usd should retrace to ?
Dimitri,
I’m just working on a short video for that. I think currencies are only going to retrace 62% of the most recent move. For eur/usd, that’s 1.096 (that’s an extrapolation from this first wave down in eur/usd and close to the 62% retrace for the entire wave up. That would suggest that equities aren’t going to get very far. I’m still looking at a 4th wave retrace for them … going higher I think is less likely. So still 1950 SPX.
Dimitri,
This market is SO volatile at the moment, I can’t get a video done. It keeps changing.
Dmimtri,
Now that the euro has topped, the first stop will likely be the previous 4th. (1.0744). I still measure the probable top for SPX at 1950. Nothing has changed in that regard. If that doesn’t hold, then we look at 62%.
A fib extension to 2.618 X the first wave down in eurdollar goes right to that same spot 1.10744 (sorry number was wrong in the first comment). This one’s correct. Watch for a turn there and a possible turn in SPX, depending on where we end up at that point.
I think the more likely turnover number for SPX is 1980.
Thanks Peter,
do you think it to be just the retrace in EurUsd to 1.20 before continuing down ?
I don’t think so, but this market has had a lot of surprises so nothing certain there. I’m short so hope not. This should be a fourth wave, I think …
Does it mean that you expect Euro to go up for longterm
Yes, I’ve said that for some time. Dollar should head down.
Oh, I read your question earlier as 1.12. We’re almost at that point. No not 1.2 yet, but eventually.
?
Sorry. Tired today. Trying to short the euro is absolutely brutal!
Dimitri,
Is there an ECB meeting or something somewhere I’m not aware of? We’re at a complete stop.
Meanwhile, the eurodollar is in a bearish triangle.
It must be about the UK vote in Parliament …
Welcome in the 2.B.c wave up till the end of day / tomorrow. 🙂 Yesterday at the panic low we made 2.A.c bottom. That is all I can make of it and explains why this markt is behaving like a JOJO…
Cheers,
W
WoW I must have drank to much water… Sorry guys! I am rereading my statement and it makes zero sense… What I ment was:
Welcome in the 2.B.b wave up till the end of day / tomorrow. 🙂 Yesterday at the panic low we made 2.B.a bottom. That is all I can make of it and explains why this market is behaving like a JOJO…
ES 1930 might be a cool target I guess for the top of 2.B.b and than down for 1-2 weeks in 2.B.c.
Cheers,
W
Whazzup-
So you are thinking the end of wave 2 is still 3-4 weeks away?
Jups… 😉 Today we should finish the 2.B.b I guess to 1930 minimum. TOUGH market…
Cheers,
W
However, looking at the markets from Peter’s view, I think I go with him and it looks like I am wrong… It is more logical and I am totally NOT the EW expert in this blog however (not doing that bad) the wave 1 down was spot on! 🙂 So I can see this market go up till like Feb 19 to finish the 2.C wave of the big III DOWN! So that means Wave B was done in 3 2 days and we are now up in C.
So if you want to follow somebody for EW, follow Peet! Looking at timing, I guess it is not bad to check me sometimes. 😉
Cheers,
W
Labour report at 8:30am EST. It is very likely to move markets. Watch for a turnover shortly after if we reach the target.
Labour report didn’t do anything to the count in futures. It wasn’t much of an event. New high for the euro, which cleared the slate and maybe it will correct now, which it hasn’t done to any great degree.
New chart and thoughts at top of the post.
I’ve updated the SPX chart at the top of the post slightly. We’ve completed the a and b waves of the second zigzag and only have the c wave left to go. Based on the length of the a wave, I’ve revised the target slightly.
Thanks for the updates, Mr. Temple. Is there any particular theoretical reason why corrective waves, such as these, are so erratic? Or is it just the universe’s way of keeping things interesting?
Mike,
Peter … please. Mr. Temple was my dad … haha.
Motive waves move the market ahead in a particular direction and determine the trend. Corrective waves are fighting the trend and are always in 3s, rather than 5s. I guess the big thing is that they’re counter to the trend–they’re against the herd. Interesting they are, all right!
Peter–Thought this was interesting. -What makes this even more interesting is the fact that the Chinese markets are closed all of next week for Chinese New Year…..year of the fire monkey.
In Chinese Taoist thought, Fire attributes are considered to be dynamism, strength, and persistence; however, it is also connected to restlessness. The fire element provides warmth, enthusiasm, and creativity, however an excess of it can bring aggression, impatience, and impulsive behavior. In the same way, fire provides heat and warmth, however an excess can also burn. GB
http://www.zerohedge.com/news/2016-02-04/event-could-unleash-vicious-bear-market-rally Gary (Denver)
Cool, Gary, Thanks! I like this kinda stuff!
Not exactly what I expected this morning. I’m searching for clues. One of them is that the Nasdaq (the weakest index at the moment) appears to be in a triangle, with one more leg up to go. If we turn here, that will likely continue to be the case. It supports the idea that when we top in the other indices, they too will have completed fourth waves. It’s a weak market.
Hi Peter
As you may well know that I am not good in my EW counts, so I apologize if what I am saying here below make no sense to you .
Please can you advice me if it is possible that the low of Jan 20 th ( on SPX ) was wave iii of WAVE 1 and not wave v ?
This means we are now in wave iv , which might go up say to the 1950 , and then start going down in wave v to complete WAVE 1 ??
This means wave v of WAVE 1 will finish around say 1760 – 1770 ?
Is that possible ?
Regards
AZ
AZ,
That’s what I’ve been saying … we are in wave 4. We’re going back to the previous fourth. There’s a chance this could be wave 2, but it’s been a small one. And it’s even smaller based on today’s action. The true wave 4 top I think is 1960 or so in SPX, and that’s supported by my measurements (don’t think they’ve changed). There’s also a possibility of a turn at 1950 … that’s pretty much the range.
And to your point about wave 5 … maybe I should be clearer in my explanations. It IS wave 5, but wave 5 of 3. The first wave structure has a full five waves and then a larger fourth wave (which revert back to the previous fourth of the third) and then the 5th wave also consists of 5 waves.
I’m about to post a chart of the Nasdaq that makes it clear we’re in a fourth wave triangle with it, so the other indices will also be in a fourth wave. The Nasdaq this morning has supported the current count.
Wave 1 should finish much lower than 1760 … more like 1627, but let’s wait to see the first wave down before locking in that number.
Thank you Peter , that is very helpful for me
Regards
AZ
🙂 Really sorry about your gaps.
The Nasdaq did indeed give it all away this morning. We’re in a fourth wave and the targets haven’t changed. One more leg up. I’ve posted a chart of the Nasdaq at the top of the post.
A little more patience, top coming soon.
Peter-
I know you had mentioned the 3-5th as a turn date. What is the next big turn date out there?
Ted,
I don’t have anything until the last week of the month. I’ll pull André’s comments closer to the top and see what he had.
Ted,
Latest from André: “So my outlook remains : down into february with 2/7 low, 2/14 high, 2/22 low.”
Today is a short term low, which works. It took about a week for the latest leg of the Nasdaq triangle to reach bottom, so I’d wager it will take a week to reach the top again. So his high might work just fine for that (14). The fifth wave down will likely take a couple of weeks, so not sure about the 22 date. I have a major date for later that week, though.
Actually that make me thinking when will these Gaps be filled ?
Any way let us take things step by step , and later we can think what will happen to these Gaps .
Regards
AZ
Well, some always remain open. The one I think you had mentioned was in the middle of a third wave and they tend to be ones that don’t get filled.
Ending diagonals on futures … yet again.
SPX and ES are at previous lows. I would expect to see a bounce start around here. Currencies are showing a little bit of life.
Now fairly clear where we’re going. We have a few days of up before we turn down into a fifth wave.
It actually looks like 4 is complete and we are into 3 of 5.
Kent,
Because of a problem I had with a plugin a while ago, if you’ve posted before, it thinks you’re spam when you post again. Only happens to “regulars.” But once I find you and approve you, you should be good for future comments. Sorry ‘bout that!
This was the only one I could find. Tried to email you but it got bounced back.
Peter
Kent,
We’re definitely in wave four. We finished wave 3 Jan 20. I have to relabel a chart to that effect, but I’ll do a new post tomorrow.
Last weekend I said 1/29 was a crash date and that the market had to go down. Well, it did. So gold/euro were up in a w3. No surpises there.
2/14-15 is the next major date when Vedic sun enters aquarius. Aquarius is bearish so the market will test this date.
As vedic mars in libra is bearish into 2/22 I expect a strong move down after next weekend.
Euro/gold will do a w 4 retracement this week and spike up next week. I expect 1,15 – 1/17 for euro.
What comes next? My longer term view is bearish and I think I have an exact date. Put 10/25/2019 in your schedule. We will have to wait a long time to see if this will work but I am confident as I can give 6 or 7 reasons for this date.
So I think gold/euro are just in a longer term w1 up. After 2/22 a retracement down into early march when the market will do a retrace up. Next major low around 4/25 as I have said before.
Cheers,
André
Goodmorning André,
Thanks for your update I have a question,do you Know the future dates
for this site?
http://time-price-research-astrofin.blogspot.nl/2015/06/spx-vs-mercury-latitude.html
Time price has no future dates anymore is there an other site where they can found?
http://www.theplanetstoday.com/ ??
Maybe you know?
Thanks have a nice weekend..
John
Hello Peter, Andre! Thank you for guiding us. Amazing blog!
Andre, I’m confused with what you said, “After 2/22 a retracement down into early march when the market will do a retrace up. Next major low around 4/25.”
Did you mean, “after 2/22 low, market will retrace up into early March then down into 4/25?”
My $.02: If we are copying the Feb. 2008 playbook, then Feb. 7 is a low then up into Feb. 25. If we are copying Dec. 2008 pattern then this week, Friday low will be retested Mon but Wed will print a HI a few cents higher than Feb 1 hi.
Maybe, spy will print 186/185 either M/T/W?
Sorry for the delay-you went to spam, but I waited until the new post was live. Up now.
André,
The forum is just about ready so you’ll be able to post there shortly (and add visuals if you want). This will provide an area dedicated to astro where the information will be much more easily accessible.
Andre thanks. Do u think gold will touch. 1000 near april 25
Rose,
Sorry for the delay. I waited to make you live after I posted the newest post, which is live now.
Rose,
What I was trying to say is that I think equities are down into April – for starters. So equities up int 2/15, then down into 2/25 and up again into 3/15. Then down into april 22-26. Gold and euro move the other way. I don’t calculate targets for gold but I do think the long term trend in gold is up (for years).
Cheers,
André
John,
This calculation (mercury lattitude) is fairly straight forward. And I can give a few dates for the near future. I use all these techniques in my forcast as I think there isn;t one that is always right.
Here goes :
2/11/16 ML (mercury latitude) @ zero.
3/9 @ min
4/1 @ zero
4/22 @ max
5/9 @ zero.
Hope this is what you asked for.
Cheers,
André
Thanks André,
I m a Mercury fan so very happy with these dates..
Cheers.
John.
New post live: https://worldcyclesinstitute.com/the-world-turns/
This website is for educational purposes relating to Elliott Wave, natural cycles, and the Quantum Revolution (Great Awakening). I welcome questions or comments about any of these subjects. Due to a heavy schedule, I may not have the time to answer questions that relate to my area of expertise.
I reserve the right to remove any comment that is deemed negative, is unhelpful, or off-topic. Such comments may be removed.
Want to comment? You need to be logged in to comment. You can register here.