
Update: Wednesday, Feb 15, 1pm EST
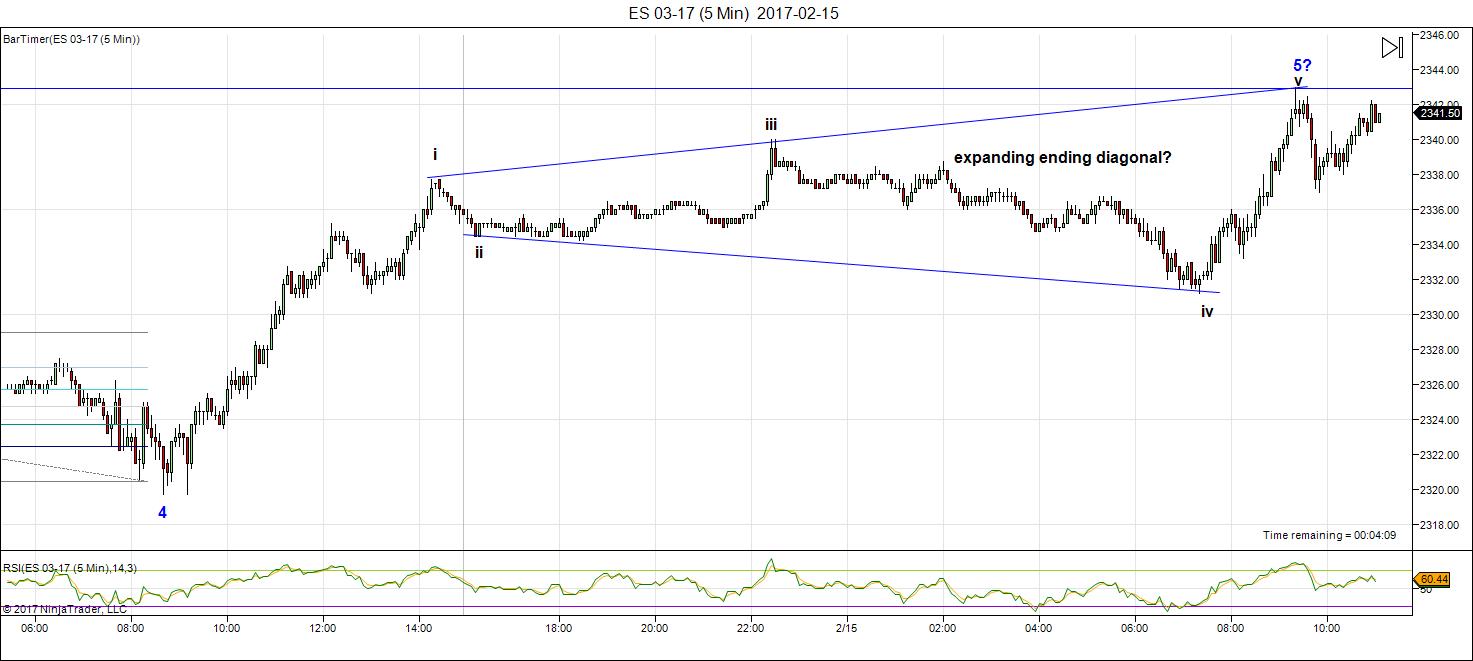
Something to think about. Above is the 5 minute chart of ES showing a potential expanding ending diagonal. Although I’ve never seen one until now, this sure is one if it holds. I would want to see a new low below wave iv on the chart.
I share this as it’s cool if it is the expanding ending diagonal crawling out of its hole to show it’s ugly face …
________________________________
 Original Post: The core of the problems affecting societies around the world today are a result of usury—the lending of money at compounding interest. This has been a recurring problem for centuries. If you study history (and cycles of history), you’ll find that the rise and fall of money-lending parallels the rise and fall of great civilizations.
There has been a movement by central bankers over the past 300 years to stamp out societies that don’t allow usury (most notably Islamic nations). These bankers have colluded over the past century to devastate western societies through the practice of driving governments into heavy debt and sucking huge interest payments from them, which eventually drives these nations into ruin through inflation.
Once these nations are under full control of central bankers (Greece is a good example), they begin selling off the country’s assets. Greece has had to sell all its national airports to interests in Germany, for example.
We’re at a point where the monetary systems of western nations have been debased so badly that citizens have been driven into poverty while the elite have increased their wealth through ownership of assets that increase in price during a highly inflationary process.
However, that trajectory is about to reverse, as the US dollar, for example, is now worth about four cents (it has reduced 96% in value in only 1oo years). In other words, as a result of inflation, the cost of living has risen so much that the population has been driven into debt that is unsustainable. We have already moved into a deflationary environment (particularly in Europe) and, along with trade wars, mortgage defaults, bank failures, and credit freezes, the process of robbing the people of their livelihoods is going to come rapidly to a grinding halt.
The result, for those who are unprepared will be financial ruin, which will lead to yet another financial revolution. If you’re prepared, it’s a chance to change your financial situation many times to the better.
As I’ve alluded to again and again in this blog, this is a man-made cycle. It parallels the natural civilization and climate cycles and for that reason, on a grand scale, is highly predictable.
But let’s go back to the Roman Empire and review how these financial cycles revolve. I’ll pinpoint some of the highlights.
The Roman Empire
 Society had become extremely fragmented at the top of the Roman Empire and there were civil wars the Social War (91-88BC) and then the Spartacus revolt in 73-71 BC. When Julius Caesar returned to Rome after his battles to secure Gaul (France), he found usury rampant (rates were as high as 48%) and, as a result, there were 300,000 poor people being fed daily in the granary.
There were two main political parties in those days: the Optimates (nobility, the Senate, etc) and Populares (the citizens). Caesar was a populist emperor and fully understood the evils of high levels of interest charged on loans. In fact, when he got into power, he outlawed usury. He also doubled the pay of soldiers (minimum wage—a bad idea) but controlled the power of the mint to government. And he abolished slavery.
In 44BC, he was murdered 60 conspirators who, as the elite, were angry at the financial changes he’d made. This marked the beginning of the Roman decline and was right at the top of the warm climate cycle, as I’ve shown in previous posts.
Rome then went on the gold standard, but there was not enough gold and so it became scarcer and scarcer in coinage, industrial production suffered, and the population became poorer. Usury was rampant once again. Wealth was concentrated in just a few hands.
Over the next 500 years, successive emperors (and there were many, and for very short periods) debased the coinage sending the population into poverty. Eventually slaves outnumbered citizens five to one.
The Angles, Saxons, and Jews
With the invasion of England in 1066 (top of the next warm cycle) that I wrote about last week also came the Jews, who were behind much of the financing. The consequences for the English were disastrous. The Jewish moneylenders charged up to 33% on mortgaged lands by nobles and 300% for workmen to buy their tools of trade.
By the beginning of the 13th century, many nobles were in danger of losing their land as a result of high interest rates and taxation. This ended in a revolt in 1215 and the signing of the Magna Carta. Its primary purpose was to cancel the contracts of the Jewish moneylenders and to abolish usury.
However, the laws were relaxed until 1275 when Edward I passed strict usury laws and all the Jewish moneylenders were expelled from England.
The Middle Ages
 The Middle Ages was really a wonderful time in history. Climate began to warm up again slowly and, as it did a period of low taxes and no usury ensued. People had lots of money during this period and lived very well. The tally stick (shown on the left) came into usage as a way of keeping track of who owed what to whom (this was a tool that was used at various periods throughout history and contributed to a fair and just society). They spanned a period of about 600 years in the Middle Ages.
By the time King Henry VIII (1509-47) came to power, things were turning sour financially. I’ve written here about the parallel of this time in power with that of President Trump. The Roman Catholic Church was in power and Henry VIII decided to break with the church to escape high taxes. He relaxed the laws of usury.
During the reign of Elizabeth I (1588-1603), the Jewish moneylenders returned to England and many became goldsmiths, accepting deposits of gold for safekeeping and then lending it out in loans with interest. They quickly realized they could lend out receipts rather than gold in greater quantities than the gold they had, and so started fractional reserve banking. Interestingly enough, the reign of Elizabeth I was the top of another warm 515 year cycle.
The rate of interest merchants paid once again crept up to 33% per annum.
The Bank of England
In 1694, the Bank of England came into being. It was created to lend King William unlimited sums at 8% per annum so that he could go to war with Louis XIV of France. France, at the time, was not on the usury system. This became a pattern going ahead several centuries, in fact, right up today.
“Significantly, most of these wars were started against countries that had implemented interest-free state banking systems, as was the case in the North American colonies and France under Napoléon. This pattern of attacking and enforcing the banker’s system of usury has been deployed widely in the modern era and includes the defeats of Imperial Russia in World War I, Germany, Italy and Japan in World War II and most recently, Libya in 2011. These were all countries that had state banking systems, which distributed the wealth of the respective nations on an equitable basis and provided their populations with a standard of living far superior to that of their rivals and contemporaries.” – Stephen Mitford Goodson, A History of Central Banking
Buried in the Bank of England bill were a range of brand new taxes on ships, bear, and liquor (and many more on everything from marriages to deaths, to pedlars and bachelors) which were to be levied on the citizens to pay the interest on the borrowed money. This is the same system that was later used when the Federal Reserve was set up in the US in 1913.
The Bank of England became the model for western banking for centuries to come.
Two years after its formation, the Bank of England had almost £2 million circulating on gold reserves of only £36 thousand (that’s fractional reserve banking for you!). A series of wars began, of course, including the War of the Spanish Succession (1701-14) and the American War of Independence (1775-83). By the time they were finished, there was 50% unemployment and the national debt has risen to £175 million.
Napoleon
 The war against France (1792-1815) was for the primary purpose of destroying Napoléon’s interest-free system of finance.
“One has only to consider what loans can lead to in order to realize their danger. Therefore I would never have anything to do with them and have always striven against them.” — Napoléon Bonaparte
One of the first things Napoléon did when he came to power in 1799 was to take control of the banking system. He created the Banque de France, which replaced the fifteen, mostly Jewish, private banks which had been charging extremely high rates of interest leading up to the French Revolution (1789-99).
The Rothschild family, who had become extremely wealthy bankers by loaning money to England and other countries involved in war, were excluded from contracting loans on the European continent, a prize which would be worth a fortune. It wasn’t long before Napoléon began to get into trouble for not frequenting the loan market abroad and relations really soured when he refused to sign a trade treaty.
In 1802, England, under the direction of international bankers (the Rothschilds), proceeded to bankroll Austria, Prussia, Russia, Spain, and Sweden and soon declared war on France.
It took about 10 years, but gradually, with Rothschild money as the backing, a series of coalitions of countries destroyed France and Napoléon was forced to flee the country.
“Give me control of the economics of a country, and I care not who makes her laws.” — Nathan Rothschild
Napoléon died in exile fit at the age of 51 and when his body was exhumed, it indicated that he’d almost certainly died of cyanide poisoning. Similar ends have come to others in high offices all over the world after tangling with the likes of the Rothschilds.
Next Week: Usury Invades the U.S. and The Double-Whammy Effect on the Economy
___________________
The Ending Diagonal Option
I’m keeping the option for an ending diagonal open, but this is my preference after the waves unfolded as they did at the end of this week. However, you can’t call and ending diagonal until the fourth wave unfolds. This is because the fourth wave needs to drop into the area of the first wave. Until that happens, we could have something else. However the third wave up looks corrective and so this brings to probability of an ending diagonal to the top of the “pile.”
Based on relabelling as a 5 wave move in ES wave (3), I’m still projecting a final top to our five hundred year set of Supercycle waves sometime in the early part of this year. I’ve given up on being specific, as these waves have been moving very slowly. Ultimately, Mr. Elliott’s waves will forecast the end and give us adequate warning of the turn.
______________________________
Here’s the latest daily chart of ES (emini futures)
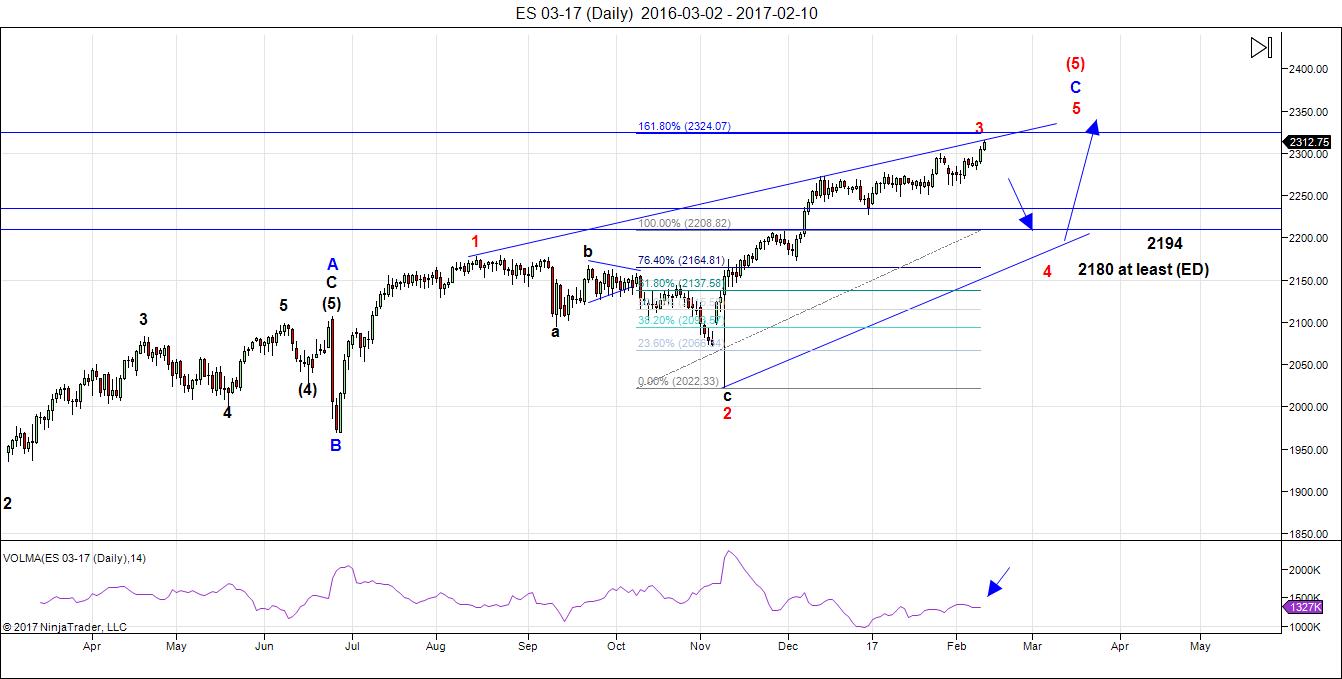
Above is the daily chart of ES. The trendlines are back as the subwaves keep pointing towards and ending diagonal. The full wave up looks to be like a triple three (a combination wave) which is nearing completion.
Even though we went to a new high late last week, there are no changes in the overall prognosis. We are very near a turn down. My measurements are pointing to 2324 as a possible target for a turn. This would be the top of wave (3).
We may still end up with an ending diagonal. The wave up is clearly corrective and has always looked that way to me. However, to confirm an ending diagonal, wave 4 will need to drop below 2180.
A typical wave 4 retracement would target the 38% level (2209, based on hitting 2324 on the upside).
The 4th wave will come down in three waves. After we finish the A and B waves, we should be able to project an end to the C wave of the 4th wave. Once we finish the fourth wave , we’ll get a final blow-off wave for the month of February, with a potential top that month or into very early March.
Here are the path predictions going forward:
- Wave 4 will come down in 3 waves with any of the corrective patterns possibly in play.
- Wave 5 is likely to be an ending diagonal. In any event, it will be in 5 waves (not motive).
Summary: We’re at the top of wave (3) ready to turn down into four with one more 4/5 combination (and possibly two). There will be a move up to a slight new high (the target in ES is 2324. There’s a major turn date Monday/Tuesday, February 13/14 with all major assets slated to turn this week. The larger wave (4) should come down in 3 waves.
After completing the fourth wave, we’ll have one more wave to go, which is likely to be an ending diagonal as a fifth wave. The long awaited bear market is getting closer.
_______________________
Sign up for: The Chart Show
Thursday, February 16 at 2:00 pm EST (US market time)

The Chart Show is a one hour webinar in which Peter Temple provides the Elliott Wave analysis in real time for the US market, gold, silver, oil, major USD currency pairs, and more. You won’t find a more accurate or comprehensive market prediction anywhere for this price.
Get caught up on the market from an Elliott Wave perspective. You’ll also get Andy Pancholi turn dates for the balance of the current month. There’ll be a Q&A session during and at the end of the webinar and the possibility (depending on time) of taking requests.
All registrants will receive the video playback of the webinar, so even if you miss it, you’ll be sent the full video replay within about an hour of its conclusion. For more information and to sign up, click here.


Fantastic Insight Peter,
I have never learned this at school…
Thanks,,
jody,
i am still tracking the RUT. I feel this index is giving us the most forward looking information
intermediate term https://invst.ly/39dvu
short term https://invst.ly/39dya
The question of an ED in SPX will be resolved today. If we do not see an intraday sharp reversal and this morning’s gap completely filled it is NOT an ending diagonal. Period.
noon time update for the RUT – jody, this one is for you.
https://invst.ly/39fq6
Thx Luri..
What is interesting is if we look at the move off SPX 666 we can see a clear 5 wave move for W1 to SPX 1219.
1219 – 666 = 553
553 added to the bottom of this last wave 1810 = SPX 2363
W5 usually equals W1.. Hmmmm..
hmmm…this is a test….is anyone else having problems posting? if yes – nod head once……..if no – nod head twice!
Virgo moons typically bearish ( see moon upper right on this site )
looking like 20400 top of the range , 19748 bottom of the range
19600 ish now support .
if we drop all week id be happy ( i want to get longer 🙂 )
The only one dropping like a rock is NVDA. Most likely same price action from 12/28 to Jan. 3.
So far my ‘revised trading strategy’ is ……loosing me money (as planned)…..but in tiny amounts that I can handle. However my ego / emotions are lying on the floor in disarray and tatters gasping for breath!!
Still I’m told that the ‘bank balance’ is the No 1!! thing to worry about. If I’m not mistaken I gave similar advice to another colleague here on the last post.
….bbbbbut it’s HARD!!! (That’s not teeth chattering from fear, but the bottom lip blubbering in a vain attempt to stop from bursting into tears)
Just to be clear, I’m still ‘stalking’ my beloved DJIA even though I no longer ‘bet on her going higher’…… AND I can count at least 5 (5 wavers UP) in the last few days. Surely ‘she’ must be exhausted by now!!
Maybe I’ll get a Valentine’s swoon tomorrow. Oooh that would be soooo good.
“The top that never comes” by Metallica
Hahaha!! Very NICE!!
Otherwise, it’s still Goddot we are waiting for since longtime
The movie in my mind this week: Waiting to see if ES will put a topping tail in a 1 hr candle, fade a bit to maybe 2311-2313 but then the bulls will push it back up to retest the high. The real fade will most likely be on the 15th which alas, will be short-lived again. http://www.reuters.com/article/us-usa-fed-yellen-idUSKBN15N1ON
I’m FINALLY getting a sense of ‘capitulation’ here!! THAT’s the kind of extremes that are necessary for a ‘top’ (note small ‘t’ yet).
Did I say? ….’I’m so looking forward to shorting this market….just not yet’
As per Friday’s close the P/E ratio for the DJIA was 20+ (pretty much near all time highs). The DJIA in itself put on 30+% in the last year when the US ECONOMY STRUGGLED to grow by more than 1.x%
I REALLY AM looking for ‘SOMEONE’ to explain WHY this is ‘normal’.
Something’s GOT TO GIVE. It’s either my sanity or the markets. I’m currently betting on the latter (for anyone interested).
Yeah, well what time is it over there? It might be too late today to make a judgement call re: your question …
Yes it is late, but surely someone in your time zone can give me a ‘response’.
What are friends for….if not in emergencies?
purvez,
we are in a terminal move. there is no rhyme or sense of prices and moves coming into the terminal thrusts of a market. you must put aside you need to be ‘rational’ and sit back and watch the fireworks…..go back and look at the final moves of the nasdaq in 2000.
so get some popcorn and some lip balm, some evian face mist, and some cannabis – and enjoy the fireworks…
and a lava lamp, of course …
just about 100 years before 1800 and froze to death .
Interesting read
http://www.nationalgeographic.com/archaeology-and-history/magazine/2017/01-02/1709-deep-freeze-europe-winter/
JODY – revised RUT chart. you know the machines are in charge when this happens!
yet again another AND final broadening formation is occurring. a broadening formation to end a broadening formation of a broadening formation!
short term https://invst.ly/39mfz
medium term https://invst.ly/39mgq
long term https://invst.ly/39mis
Yaaaay another day and another HIGH!! Luri, Peter I have some 100+ years worth of ammo (in TEENY TINY bits) before it all fizzles out. However at the rate this is going it may well beat my 100+ years.
Thanks very much for the encouragement and I’m going to Portobello market soon to find me a ‘lava lamp’. I used to be fascinated as a kid with those things.
Ooooh I am SOOOOOooooooh looking forward to shorting this market…only just not yet.
Have I said that before? Apologies if I have…but it DOES give me a sense of ‘it will be my turn….some day’. Which I LURVE!!
I’m starting a ‘book’ on the DJIA going to 21K before it drops below 20K again ever. Anyone interested?
Oh you want to know the ‘odds’? Ok then I’ll have to consult my ‘trusty excel calculator’ but don’t expect a ‘roll over’ OK!!
Purvez,
I think you have to prove you’re “high” to be able to purchase them nowadays. (oh, sorry, I forgot who I was writing to …) Go ahead then, with my blessing!
🙂
Hahahahahaha!! Thanks very much for the CHUCKLE, Peter!!! You DO have a great sense of humour.
Are you SURE you weren’t a stand up comic EVER?
No thank you! I can only take so much of a beating. And back to you … the English sense of humour – can’t beat it.
btw, did everyone read the Cleese letter to America?
http://www.snopes.com/politics/soapbox/revocation.asp
This already looks like a giant blowoff top. And it’s wave III. I’ll use what’s left of my account to buy some morphine in preparation for wave V…
My sentiment exactly. However, wave 3 has to be the longest, unless it’s an ending diagonal and I don’t see that as much of a possibility any more.
2337 SP was the maximum number for the top according the famous astrologer from now on it should be down hill in a multi year bearmarket.
the below link was posted on MS’s website on Thursday, February 9, 2017 and was made readily available to the public without subscription…
http://www.mahendraprophecy.com/userfiles/files/9_february_2017_daily_flashnews_with_day_trading_range_&_strategy.pdf
“S&P will be saying goodbye to 2287 or maximum 2337 (if it closes above 2287 for three days) figure during this period.”
I have 2337-2340 as my top measurement now for this wave.
the quote originally came from MS’s 2017 Financial Predictions which he authored in mid-December 2016…
Interesting …
Still two waves to go, though, in the bigger picture.
Sentiment continues to be extremely bullish. Difficult to imagine it become any more extreme. As I have previously opined, absolutely no one is expecting this market to experience any serious decline in the near term.
you may find MS’s forecast for 2016 interesting as well…he wrote the 2016 forecast in mid-December 2015…the below link was published on his website on January 16, 2017…
http://www.mahendraprophecy.com/latest-news.php?id=1106
Not seen The work of MS before. Thanks for sharing. It’s probably one of the extremely few predictions I have seen that has not been devastated by the central banks and trump. Let’s see if the 2338 S&P level holds as his analysis suggests we cannot go higher than that!
It seems he is bullish UVXY for September. ?
What I can tell you things will go really bad this summer…
John, should I rethink any vacations abroad? As for uvxy, hope it doesn’t do another reverse split between now and summer.
I cannot anwer that question,but be carefull arround the time with sun eclipse this summer.
sorry for the typos
We are fast coming to the day of decision. I have been in bear mode for the last year or longer. Each week EW counts have been eliminated, extended, changed or new ones added. There are more cycles in play than at a Schwinn factory. Here is the bottom line for me. If the SPX crosses 2350, that is all she wrote for the bear market. There will be corrections but we will not see SPX 2100 again for many years. You can’t apply logic to an illogical market. I personally hope we do not see SPX 2350. I hope Peter and Mahendra are right. But if not, it is time to be cautiously long the market. Having said that, nobody knows when or if a major catastrophic event will occur. It may be time to look at the glass as half full instead of as half empty.
There is nothing special about SPX 2350. A number of EW analysts I have read even several years ago called an SPX top at exactly 2500.00 to conclude the current cycle degree. This final wave up is also in my opinion concluding Super Cycle as well as Grand Super Cycle wave degrees. All this talk about a perpetual bull market is exactly what one should expect at a top of this magnitude. Otherwise intelligent folk are talking nonsense about the all-powerful central bankers and their displayed prowess in buying indices like DJI out of thousand point decline overnight. This smug arrogance was also displayed by Yellen when she smirked about the Chinese not being “deft enough” to arrest their own market crashes. Most analysts see us completing a third wave up with a a fourth wave yet to do. Some Ellliotticians see the next fourth wave correction at minor, some at intermediate, and some at primary degree. I personally have my doubts. All I know is the current level of complacency is historic in its extreme, and in my mind fully qualifies as a blow-off top. I am not saying we will not go on to even higher highs, but the notion that bankers, however deep their pockets, can indefinitely forestall a reversion to the mean will prove to be a delusion. All bubbles ultimately burst. So will this one. I suspect it is closer than most folk think.
Yup. Well put!
Agreed. If you have deep enough pockets you could start building shorts now and use infra-day/week trading to cover initial paper losses for any further rallies to new highs.
this is not a prediction…rather, a tentative ‘game plan’…Wednesday SPX could close in the red (PD-2)…possibly the same for Thursday…Friday SPX could close in the green (PD-3)…if things play out that way next week could be interesting (PD-1)…
https://twitter.com/astrogann33/status/831625408659415040
PALS has rare triple alignment negative right now. Moon phase post full moon going into lunar mid phase bearish. Moon distance is increasing and is maximum distance next week. Moon declination has crossed the equator (today) and will be moving south for next seven days. February is seasonally weak. And planet pre Venus inferior conjunction and pre Jupiter conjunction is negative until end of March. So, I will be looking to short until next week and will only buy if we get a 4% sell off.
The Jan 20 low came 1 day early
the Feb 3 low came 1 day early .
my intent was to go long and add stocks into those lows
and that plan was made in august last year.
Today i have changed my mind.
I am not going to add to any stocks even though i have a bullish bias
out into October .
Why the change of mind ? I cannot find any decent valuations to justify
buying more stocks . NVDA as an example has a valuation of 67 bucks
and trades at 108 and change . This internet of things mind set is no
different then the tech bubble of the 1990’s . Most of these companies
are either losing money or simply trading at valuations that i cant
justify to buy into.
STM is valued at 7 bucks yet trades at 13.78
AMD valued at 1.20 yet trades at 13.26
1927 was 90 years ago
1957 was 60 years ago
1987 was 30 years ago
Andre, Your the gann guy , any thoughts on the 30 yr 60 yr and 90 yr cycles ?
im going to use the June high to sell, the august high to sell and if
we do see an Oct 2017 high which i have been jumping up and down about .
ill be out and heavily short.
today’s rally to me showed negative divergences.
if we run up higher still into Feb 26th ? ill be nervous about being long
march 7- 28th i still consider a low of sorts.
This is me just playing around with numbers…waiting for the inevitable:
The wave on the DJIA from the 8th Feb low to now is approaching 1.618 times the wave from 30th Jan low to 7th Feb high. At 20624 on the DJIA it will be 1.618 times exactly. Since we crossed the 20600 level a few moments ago that may well be ‘a’ target.
Of course this is all academic as there really is NO WAVE COUNT that makes sense in the stratosphere.
I feel quite ‘light headed’ and dizzy writing this from such lofty heights…..despite my love of flying.
no….no…..i am ok – “THANKS FOR ASKING” purvez!!
i am crippled with a ‘flu’, probably a genetically altered version of the flu virus by way of the UK MI5 labs……..but i am ok — cough….thanks for asking.
NO…NO…..i have no appetite, a cup of tea chamomile and ginger tea would be nice, but ….no no……thanks for asking…..[cough]……
[sniff]………… oh and for the record,,,,the point and figure charts are indicating that 20,950 is “THE” potential target for the dow to hit that will lead to the collapse……..
you’re welcome……no worries…….. [sniiiiiff, cough]….
does this look like a bull market to you?
https://invst.ly/3a0b3
Luri,
it depends upon if your 3rd wave will stop here.
Otherwise it’s pure speculation
NOTHING has looked like a Bull market to me for a very long time…..but that hasn’t stopped the market from disproving me.
Mahendra is already out of play with it’s 1337 max
Sorry, 2337
Aaaah luri, are you feeling poorly? Haven’t you got a ‘nurse’ that would rub Vicks on your chest to make you feel better?
You really shouldn’t be out in such inclement markets you know. That’s where you caught your cold. I told you these ‘heights’ are not good for you…..but would you listen!!
I just shared a chart at the top of the post.
Thanks Peter, it would be inline with Mahendra..today is his top and prices should fall,,,
”From Wednesday market will start falling any time between 9.45 AM to 11.45 PST, after achieving top as predicted in book and our letters ”
Overshoot goodbye 2337… but I can accept that for now
John are you sure there wasn’t a typo in mahendras letter? Maybe not but this major call was wrong price wise and seeming as how confident he was I’d say it’s very embarrassing for him.
I just recieved a new alert:
Price wise it is a wrong call but he is confident that the market will fall
But 2337 was his top…
Dear Members,
On request of many we unlock yesterday’s small part of stock Investment report. Please you can go through without log-in. We predicted market to make top today and fall to start by 11.45 AM which didn’t happened but we are confident in our theory so fall will start anytime. Most of yesterdays recommended stock on earning performed very well.
John I think it’s safe to assume MS got it wrong time and price wise this time. He has a 90% accuracy rate so this is not unexpected. Will be interesting to see what his revised targets are.
“I’d say it’s very embarrassing for him”
this is a particularly troubling comment…regret posting the links to the forecasts of MS …it won’t happen again!
Rotrot,
don’t take it negative.
We all respect the other opinions here.
Just everybody is frustrated by this dawn market
Rotrot I didn’t mean it in a bad way. Just thought it was a major call for him and you would expect the main major calls to be correct. It could be me that’s the embarassed one if the market tanks and MS was right timing wise and slightly off price wise. Plus I was a little frustrated by this market. Apologies.
nothing short of unbelievable, it simply doesn’t stop
Alex it’s ALL to do with Pres Trump. He said ‘people’ liked what the new administration was doing and therefore they were pushing the markets higher.
I LURVE hubris like that. I WILL double down on my DOWN bets once I see a ‘gap’ opening.
SPX 2363.11 equals the first leg off SPX 666
Anytime now.. BOOM!
No wave V?
jody…no retrace BEFORE ‘boom’? Wow that would just be a continuation of ‘first leg’ of 666. Do you have a ‘time frame’ for when it might end? I’ve ‘JUST’ got a 100+ years before my capital goes to zero. I would like to leave ‘something’ to my son….a few coppers would do.
UVXY says the uptrend ended @ 2351.30
3:18 pm EST.
If we do not do another extension up to 2363 that should be it.
It’s here, if not tomorrow then Tuesday.
The monthly chart is clear. Rising wedge in progress.
The under shoot last year telegraphed the overshoot we are in right now.
Everyone knows when the breakout fails you short the crap out of it once it closes back inside the wedge. It will be a self fulfilling prophecy.
1st wave down should take out 2083 if it bounces before then – then yes one more leg up to 2363 at least if not 2500.. For me though it would not give the “Right Look”
http://s1126.photobucket.com/user/Jodyjody1988/media/Screenshot%205_zps1i3ljcly.png.html?sort=3&o=0
Rising wedge on all time frames now..
15 min
Daily
Weekly
Monthly
http://s1126.photobucket.com/user/Jodyjody1988/media/Screenshot%207_zpsakw3g0vd.png.html?sort=3&o=0
Jody, I’m curious what trigger you’re seeing with UVXY. I looked at the one-hr chart and I found some fractal similarities:
1) 2/14/17 to 2/15 looks similar to 7/29/16 to 8/1. SPX fade next day
2) Today looks similar to 9/8/16. SPX sell-off next day.
3) 10/25/2016 and well you know what came next.
4) 1/26 and fade next day.
Conclusion: I’m going stalk uvxy tomorrow.
The market was up today yet UVXY also gained 5.65%
Also came up to $19.78 @ 11:30 am backed off and then took out that top late in the afternoon, higer high as SPX was heading lower.
https://twitter.com/dynamicvol/status/831973426160099342
“S&P 500 & VIX Both Jump: Which One Will Blink?”
https://lyonssharepro.com/2017/02/sp-500-vix-both-jump-which-one-will-blink/
Very sharp eyes Jody!
It’s opposite cousin, SVXY put in a fat red candle today and was down 3.7 % while all the indices continue to cavort above their respective upper Bollinger Bands with nice green candles. This suggests we will get one more pop for a final fifth wave of the current impulse with one more high in SVXY, possibly a bearish engulfing candle and it’s lights out…I suspect few giddy bulls are paying any attention to this divergence with VIX futures…how fitting! 🙂
Jody, Verne, rotrot thank you. SVXY 1-hour chart from 2/13/2017 to today looks similar to 10/21, 24-25/2016. Hmmm…
Oh I see!! Sorry!! I thought you meant ‘boom’ UPWARDS.
OK then I’ll definitely look forward to that. It may even leave some coppers behind for my son!
Don’t even joke about the boom being upwards…
That move up in DJI is starting to look parabolic. They all end the same way- back to where they started.
Well guys, finally some good news for the end of the bull market. I closed my shorts for a huge loss.
It’s called “bearish piggy noob amateur no-skin-in-the-game why-am-I-even-trying dumb money capitulation”.
That usually signals a top. I took one for the team. Damn. Not that I don’t love you guys but I think I was way too generous in this gesture.
Given Peter predictions, I better use what’s left to buy food, ammo, and shelter…and 1 put contract, just so at the end of the nuclear war I can say “TOLD YA” to my friends…
Alex
There is an old saying .
Manage your money or the market will manage it for you
And most likely you won’t like the outcome .
Losses hurt no doubt but you did the right thing no matter
What the market does next .
‘re group and learn from it .
I added a small option trade in dba , Jan 2018 calls the other day .
It’s a do or die trade on commodities . I’m done buying stocks .
My bias is to hold the stocks I have and sell out a little at a time
As I mentioned before . I’m following wheat mostly and I was looking
For a low in April . Rather than touch wheat futures I decided I’ll
Trade more if the softs as a whole. As purvez has mentioned many times
Trade small , so my trade is small for me and since I used options my risk
Is limited and we’ll defined .
Lastly , never say prices can’t go higher in an uptrend and never say
Prices can’t go lower in a down trend .
The masses are correct in a 3rd wave . This move is a 3rd wave it’s pretty obvious .
Yet it will end at some point .
I do not fight the mars Uranus cycle which bottomed on time ( 1 day early )
Venus mercury cycle should only add to this insanity and drive prices even higher .
Another added cycle to the mix is when you have both mercury and Venus retrograde at the same
Time . That I have not yet checked to see if we get one of those this year or not .
That that , mars Uranus is a 2 year cycle . Venus mercury is a 20 month cycle . They will be working in tandum
From the end of March moving forward .
Bottom line this can become rediculous to the upside which is why I posted my warning and my chart
If the oex and showed it’s upside target into June .
The chart I posted of the nya into the 13,000’s is not that big of a % move .
Dow 23,000 – 27,000 would not suorise me .
It’s Dow 38,610 that would blow my mind .
That’s why I’ll hold yet not add to any stocks at this juncture .
Heading to sea in the morning . My planatary model needs more data entry
Won’t have the rest of this year completed for about a month .
June is important as is August but October is my major key month .
I’m not a die hard bull at all . I am just tuned into the larger cycle .
If I’m proven wrong I’ll except it….
So far the market is exploding upwards after a pretty much 2 year sideways
Move .the vix or vxo won’t be helpful yet being long volitility is most likely the best
Choice . The vix can rise in an up market with an expanding range .
Under this scenerio call options become expensive .
Welcome to crazy
Hey Nick,
These are the latest comments from Raj:
You can read his twitter…
https://twitter.com/TimeandCycles/with_replies
Thanks will get back to you….nick
jody,
it seems to me, this it is the kind of scenario of price surges that gives birth to the truncated 5th wave. the market gets far beyond itself [for whatever reason], a violent drop back, and then market is unable to make new highs, and truncates. So for me this could very well mark the top in prices.
What is scary, is that the story below – if accurate – means that a single hedge fund blow up can move the entire equity markets worldwide This highlights the characteristics of the algo machines, whereby they stretch the market so badly that it collapses “under its own weight”…….
http://www.zerohedge.com/news/2017-02-15/multi-billion-trade-meltdown-here-reason-markets-inexplicable-surge
is anyone else hearing through the grapevine that “Ms. Yellin” is being taken “out” as head of FOMC? within the next week/ few weeks? ….i have a quote, “he is about to get rid of her in the next week”……… alex jones. With the proximity of collaboration between Trump and Info Wars in dispensing info to the masses – and the accuracy of jones as per Trump’s direction of policy and intentions for picking the policy makers – this statement [if true] is ‘destabilizing’ at best for the fake equity markets.
http://www.cnbc.com/2016/12/14/yellen-says-she-wants-to-serve-out-her-term-despite-trump-pressure.html
Market in small degree fourth today. Probable new highs tomorrow to draw in a few more
giddy bulls over the weekend…
Ever heard of a hedge fund called Long Term Capital Management?(LTCM)
Watching the 15min H&S on the SPX.
Neckline 2338 needs to break..
Liz,
After 11:10 looks like a 3 wave up until 12:50 then
3 wave down to 2:20pm and a
5 wave up into the close to finish a C wave.
The structure looks and has the characteristics of a minute 2
The selling should continue tomorrow..
Thanks Jody. I also think we will fade again tomorrow but just a mild one to test today’s low because it’s opex day and weekend holiday. I think 2/15 may be the Wave 3 high but Verne thinks otherwise. Either way, no longs for me tomorrow since I have no intention of worrying about a new position over a 3-day weekend. Andre did say 2/23 is an important high. Maybe it will be important because we get a sell-off 2/22 then bounce 2/23 and that is the last good day to get out before the start of wave 4?
After a second look, I think it is possible we topped on the 15; clear up-trend channel broken today…I was surprised at the red VIX candle
It would be a rare running flat since C did not go past A, but who is to say not?
That may be it for the fade for the day.
ES I think was tracing out a falling wedge today. On the 5 minute chart draw lower trend line from yesterday’s 7:30 pm lows to today’s lows. Draw upper trend line connecting today’s candle highs.
Then boom ES printed 2 hammers 11:05, 11:10 am while UVYX printed topping tail candles at the same time.
ES broke out of the wedge 2:55 pm in preparation for the alleged 3:30 ramp I suppose.
I expect we will see an at the very least, an interim top tomorow…
Back from holidays, As mentioned before, I was looking for a low Jan 19th. I was out of my shorts. I took a hair cut on my shorts 3x etfs and options. I have not started out the first part of the year in the minus for many years. I am bullish after a possible small set back in the markets here shortly. I am bullish into the summer time frame.( Late July ) A lot of money flowing into our markets from over seas. Europe. My compliments to Joe for his trading skills as well as Valley, Andre ect. Below is some thing to take notice. All the best every one.
Regarding the economy, fire element is often the driving force behind the stock market. The five elements are also affecting people’s mood. In general fire is joy, water is fear, Earth is meditation, metal is sadness, and wood is anger. As such, fire year often generates optimism and drive up the stock market, For example the last financial tsunami happened in 2008 because it is strong water year of the Rat. The economic crisis deepened and continued until 2012 because all these years did not have fire element. As expected, when fire returned in 2013 with Snake year, the US economy showed strong recovery with Dow Jones industrial Average surpassed 18000 points in 2014 strong wood fire horse year. In 2015, the year of wood goat does not show apparent fire, but there is fire hidden in the goat, hence optimism continued until January 2016 when the month of Ox came to clash against the Goat and extinguished the hidden fire. So there is serious setback in stock market, terrorist attacks, many celebrities passed away, and extremely cold weather and snow storm. In 2016, year of fire monkey, it is “sun setting in the west”, so the economic atmosphere suffered slow down. However,. 2017 the Yin Fire is still positive for the economy and the optimism continue to bring confidence to buy particularly in spring and summer time, when the candle flame gains seasonal support and drives up the illusory optimism. However, as the yin fire is illusory candle flame, it will be extinguished by autumn and winter. So there will be serious setback towards August and October and this will bring long term bearish market as there is no more fire years before Tiger year 2022.
Wow, Dave. That is poetic.
Worth a read
http://www.news.com.au/finance/economy/australian-economy/australia-headed-for-economic-armageddon/news-story/998390d5128ed69e8799db3de9efe52d
Andre’,
No lows or weakness on February 14-15…Are you still thinking 22-25 for a high? Yo You mentioned your turn point had been pushed forward…Has there been an “inversion” of the cycle? Thank you in advance!
Ed,
I certainly do. 2/19 we enter Vasant; a new vedic season. 2/18 we see last quarter at apogee. This is not only a synchronization of the 27,5 and 29.5 day cycles, it also is the mother of all highs; gravity weakest here. 2/24 is a dark day.
Monday US markets closed as was 24 weeks ago (labor day). That week we saw a 2% decline 9/9. 24 weeks gives 2/24. SPX made the high 9/7 (2/22).
My maudar cycle and sunspot cycle give 2/23. Next week will bring the final turn and then the first low is 3/7, with more to come.
The market is syncronizing; US markets were flat the last days, but European markets showed new highs. Very bearish.
22-23 the stongest dates this month.
I expect a black swan.
Have a nice weekend
This week we have Venus at aphelion. This gives the strongest tidal pull on the sun by Venus. And this should be a high. As Venus has a 225 day cycle, This is significant.
We also have a Bayer rule 2 (merc-mars speed difference. Next date 3/14,
Most significant: The market wants to test the midpoint of the 1440 cycle from 12/28/16. After that at least 59 days down. That would be late april.
See : a major confluence of medium term cycles that all turn the next 7 days with the longer term down already. Wednesday could be explosive according to Olga Morales. Trump heart attack? War?
I meant : Venus at perihelion.
“22nd February 2017…The first Moon Wobble for 2017 is a rather intense one…Keywords: Force, Brutality, injury, accidents, violence, shocks, and upheavals.”
https://astrologyforganntraders.wordpress.com/2017/02/15/moon-wobble/
“The Dawn of the 7th Day begins on the 21st March 2017”
http://0104.nccdn.net/1_5/268/038/2d7/Dawn-of-the-7th-Day—Article-.pdf
I should add the mauder cycle gives an extreme reading; the next high (april 16) has a lower value. This confirms the venus cycle.
One other cycle I have is based on Ray Tomes’ work, This cycle gave a (significant) high 2/1 and gives a low 3/5. As this indicator moves between 0 and 200, 100 is the midpoint. This midpoint is 2/22. This is based on the universal harmonic 34560 and the harmonic forecast,
This shows 2/1 was really a significant turn and we should see some more action from this week into early march. Will do some more analysis on this cycle.
365 moons from 8/25/87 is 2/27/17. The low in 87 was 10/19 or a 55 day decline. That would give us a low 4/23.
See what I wrote above about the 1440 cycle; that gives 4/25. And that is 45 degrees in the sqr9 on 1942,
Andre’,
Thank you for all the responses!
Thanks Ed for asking intelligent questions and making things clear!
Very interesting reference to 1987 Andre.
W.D. Gann considered seven to be a fatal number for the markets.
It is really amazing how diverse the EW wave counts are for the future of this market. Some see us mere months away from a final top in a third of five waves up to a major multi-generational top at intermediate, primary, cycle, super cycle, and grand super cycle degree.
Other analysts see us only in the fifth wave of primary three with as much as a year before we put in a major top. The former are predicting a top in the 2450-2500 area, the latter possibly as high as 2800. There is even one analyst who thinks that even after that major top is in there will be a correction of 15-25% but no crash. While it is impossible to know who is right, there are few things I do know.
First, that we are seeing historic levels of complacency in the market as evidence by action in the VIX. I know a lot of folk have written very smug articles about that not being necessarily indicative of trouble for the markets but so far as I know no one as abrogated the concept of reversion to the mean. Extended periods of extremely low volatility absolutely have always been followed by the opposite. Here are some years ending in the fatal number seven, and resulting market performance in those years.
1807 – 53% 13 months
1857 – 50% 9 months
1904 -45% 10 months
1917 -40% 13 months
1937 -46% 9 months
1957 -20% 3 months
1977 -20% 17 months
1987 -36% 2 months
2017 ??? ???
I am not sure what principle EW analysts who are arguing for another year plus of an ongoing bull market is invoking. I know the EW principle states that the waves develop independent of external events and are unaffected by them. I think in attempting to underscore that waves are driven by emotion, some analysts make the fatal error of failing to recognize that events in turn do affect emotions.
We are seeing the rise of chaos, both social and economic everywhere you look.
What the central bankers have done to this financial house of cards is entirely lost on the average observer. Who can get their mind around the idea of hundreds of trillions in derivatives, to say nothing of the un-payable debts crippling sovereign governments globally. Personally, I am not sure when this thing comes to a screeching halt, but when it does, I think it will be a grand super cycle top. Those insisting on a bull run into perpetuity, I wish them all the best. I am accumulating long positions on volatility….the higher they rise, the harder, farther, and faster they fall…
Sorry about typo on last post for year 1904, which of course should be 1907, the year the notorious Jesse Livermore made his first fortune…
Verne, nice summary of years ending in 7s.
Andre’,
You mention in your post at 2:38am…
“Most significant: The market wants to test the midpoint of the 1440 cycle from 12/28/16. After that 59 days down. That would be late April.”
My question…What is that midpoint? Can you be more specific? Just seeking clarification.
When you say…”the market is sycrinizing: U.S. Markets were flat these last days…
But European markets showed new highs. Very bearish.”
Seeking clarification…Can you tell us more about what you mean by “flat”?
Not seeking trading or investment advice.
Thank you in advance!
Ed,
That midpoint is 2/25,
We are now in cycle down into 3/7. Very strong days this week. 23 should be a high but this will be inverted. So 21 high 23 low and then up into 27/28 before we decline into 3/7. I have 2 strong dates for a low : 4/25 and 5/28.
Flat is relative. What I meant to say is that some markets made a new high as other markets didn’t. This is not a healthy situation.
An alternative would be that 2/25 will also be a low. 2/24 is adrk day and 24 weeks from 9/9. Could be a strong down day. Then 2/25 low and in the weekend up to test 27/28.
Andre’,
Thank you! That was very helpful!
A new post is live at https://worldcyclesinstitute.com/another-win-for-usury-the-battle-of-waterloo/
This website is for educational purposes relating to Elliott Wave, natural cycles, and the Quantum Revolution (Great Awakening). I welcome questions or comments about any of these subjects. Due to a heavy schedule, I may not have the time to answer questions that relate to my area of expertise.
I reserve the right to remove any comment that is deemed negative, is unhelpful, or off-topic. Such comments may be removed.
Want to comment? You need to be logged in to comment. You can register here.