
Update Thursday, April 22, Before the Open
Sometimes you just need to sleep on things to think through what could be happening … (chart updated ~12:30PM EST)
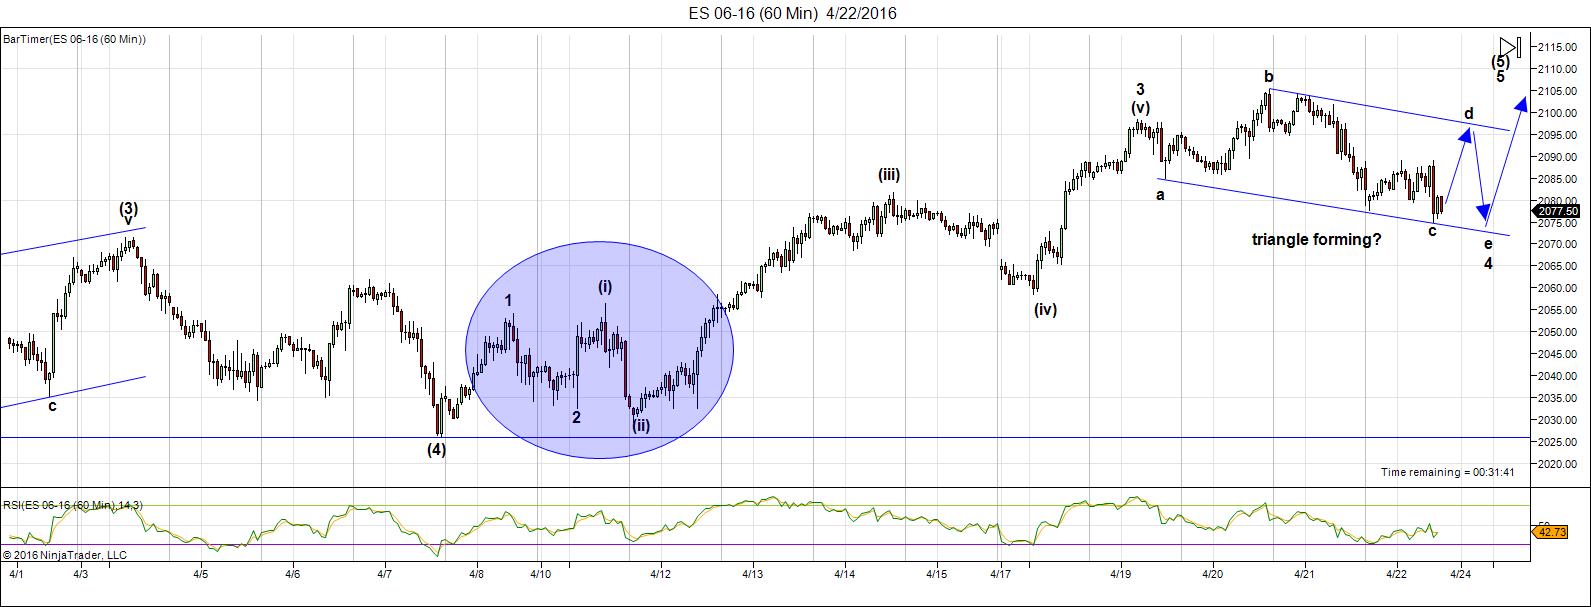
Above is the 60 minute chart of ES (emini SPX futures). I’ve completely re-labelled this wave and I’ll tell you why. The circled area has always been the area of contention, because it sports an abc pattern. However wave 1 was in 5 waves. Wave (i) looks like three waves, though. I’ve labelled it as a 1-2,1-2 pattern, as a result (that wave in 3 is still an issue, however).
I’ve labelled the entire wave up as a third wave within a larger five waves, because each of the major waves look like they’re in 5 waves and labelled this way, there is no overlap. However, it’s unusual for wave (ii) to be lower than wave 2 (in the circle). Usually the third wave is fully within the confines of the larger wave enclosing it, but in this case, it has fallen slightly below it.
This would make the final pattern we’re in probably a triangle. This works for timing due to the fact that we don’t have a cycle turn until April 28/29 (right after the fat lady Yellen sings). A triangle warns of only one final wave up after it’s over and that wave up is usually about the same height as the triangle itself. My target for SPX is still 2116/7.
This seems to me to be the most logical labelling of this wave at the moment.
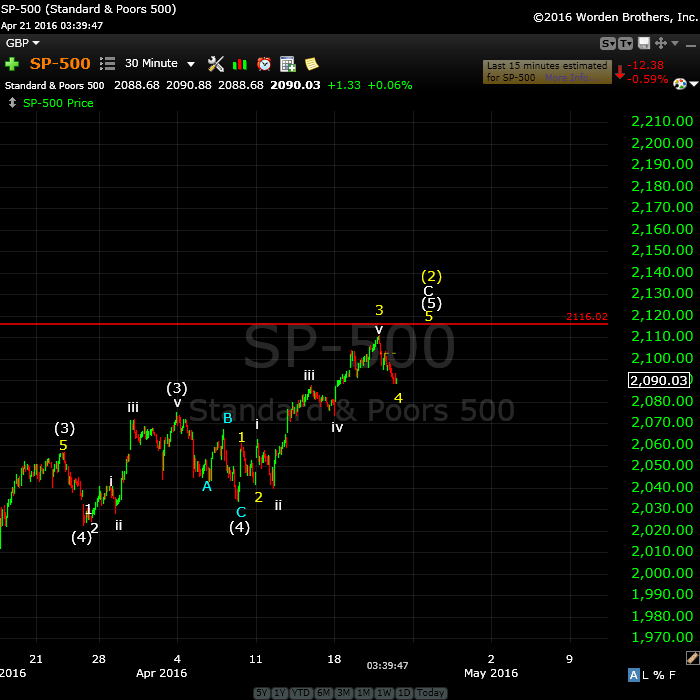
Above is the 30 minute chart of the SP500 showing the final set of waves. The structure and wave measurements project a target top of just over 2116.
I’ve relabelled the chart as I have with ES. However, this chart is much more normal in wave structure.
We get this by measuring the first wave (yellow 1) which in this case is an abc wave. The third wave (yellow 3) should be 1.618 X wave 1. It is exactly. Wave 5 should also be 1.618 X wave 1. The red line is at 2116.02.
2116 is also the previous wave 2 high. At the end of todays’ session, the wave structure looks like it needs one more subwave for high.
During today’s session:
- the VIX hit a new low of 12.50
- put/call ratio is .776, the lowest in 2 years
- volume continues to tank and had been moving steadily lower since Feb 11.
- 5 day sentiment is at 83.4%, higher than even the market high on May 20, 2015
These are all attributes of a market in the final stages of a second wave, ready for a trend change.
________________________
Update Tuesday, April 19, Before the Open
Futures headed up to almost finish the ending diagonal. It’s not quite finished because we have 3 waves down.
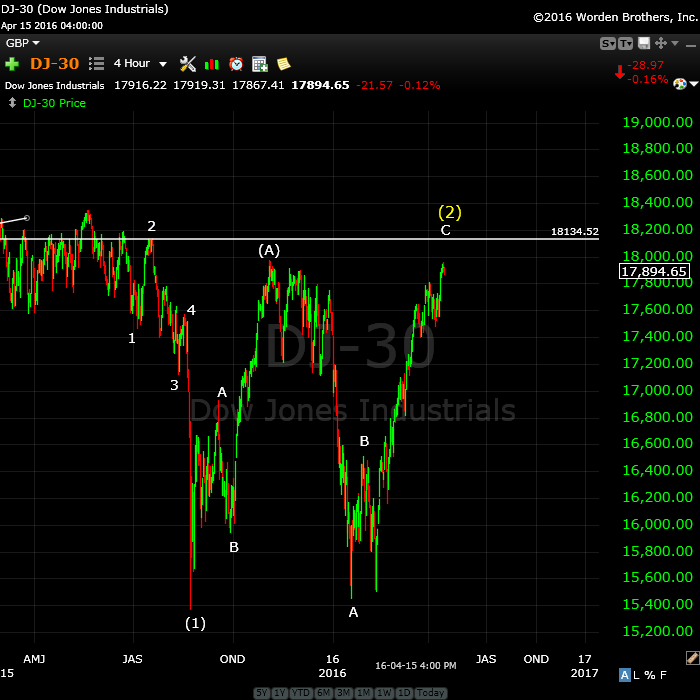
We look to be at the level I had forecast in the video—the previous second wave top. For the SP500, that would be at 2116. For the DOW, about 18,137 (by my chart).
If so, I would expect a reversal with one more small rally close to the open. We’ll be looking for five waves down.
If you look at futures, you can clearly see the 3 waves up, with each A and C leg comprised of 5 waves.
USDCAD is right at my target ready for a turn. EURUSD is clearly in a triangle and should start heading down relatively soon (likely with a first wave down in the indices).
_______________________
Update Monday, April 18, ~ 10AM EST
Top Tick Time: Today we really are looking for the top tick. We’re in the final leg of the fifth wave. The waves in the indices should go up in 3 waves. We’ve arguably finished the A and B wave and are working on the C wave.
We need to reach a new high above the upper sloping trendline of the ending diagonal. The top will be a sudden turn. Then we’ll be looking for 5 waves down. Finally, three waves up in a second wave will confirm the change in trend. More on that at the very bottom of the post.
_______________________
The Second Coming refers to the top of this second wave, which is slowly inching it’s way to a double top.
But The Second Coming is also a poem written by Yeats in 1919 in the aftermath of the First World War.
“Yeats incorporates his ideas on the gyre—a historical cycle of about 2000 years. He first published this idea in his writing ‘a vision’ which predicted the expected anarchy that would be released around 2000 years after the birth of Christ. The gyre suggests the image of a world spinning outwardly such that it cannot recall its own origin. These anxieties are closely tied to the traumas of a continent at war, and the rise of industrialism and militarism on a global scale.” … cycles yet again.
This 2nd wave is almost over. The next cycle turn date is the end of April for just about everything. This is a MAJOR turn date (the middle of the month was a more minor turn date and gave us the start of the final subwave wave up).
We were expecting some sort of geopolitical (or financial) event towards the end of the week. We got Doha and some other events.
- The Doha oil talks ended without agreement, as expected. We already knew oil is in an ending diagonal and hasn’t hit the bottom yet, so this meeting falls right in line with expectations.
- Japan had two major earthquakes, one after another.
- We’ve got Brazil’s President in the midst of an impeachment vote.
It certainly isn’t boring!
Events don’t affect the market to any great degree, of course. Social mood affects the market (it’s a mathematical projection of the social mood of the masses); human cause events as a result of their mood.
In terms of the market, the dollar controls the market and it’s coming to a major turning point. Watch it closely for the signal of a turn down in equities. (More on this in the video).
The direction of US equities is still up. But not for that much longer.
We’re still in the the final fifth wave of the C wave. The structure of the move up in the SP500 is questionable. I’m going with the start of an ending diagonal, as I explain in the chart below and in the video. While we may see a spike in the indices in this fifth of fifth wave (the throw-over), it should be short-lived and I would expect a dramatic turn down, with waves that should revert to the beginning of the ending diagonal relatively quickly. I don’t have an upside target for the SP500.
The short story is that equities and currencies all seem to be heading for the same top tick (or pip) all together!
As I mentioned last week, the VIX has flashed a sell signal for equities, so a turn down is imminent.
There’s a lot of information in this post to digest. I hope I’ve made it clear what I’m expecting. I’ve been saying for some time that the markets are all moving in tandem as one (due to deleveraging debt worldwide) and I see everything lining up for the turn. I actually pointed this out last September.
I’m casting my attention towards month end now.
______________________________
Here’s a video overview of the market for Monday, April 18, 2016:
Market Report for April17  |
 |
Make sure you zoom the video to full size with frame expander (arrows) in the bottom right hand corner and also set the quality to as high as your web connection allows. This is an HD quality video so the best viewing is at that level. |
_______________________________
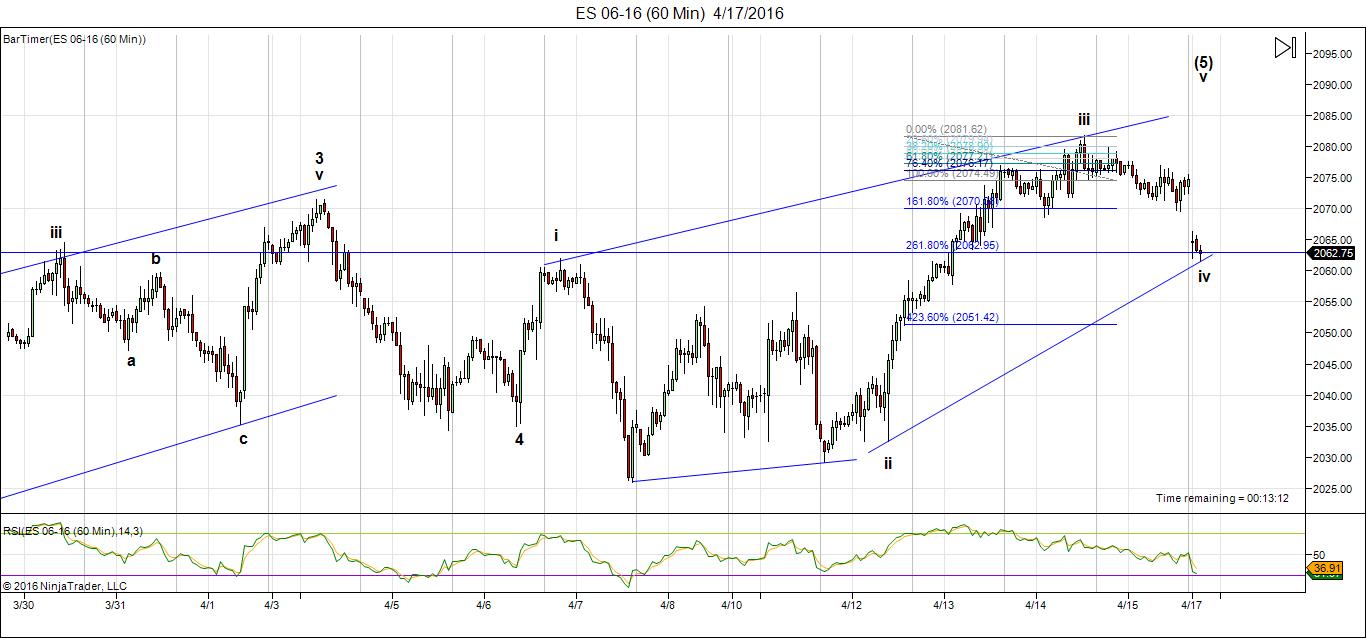
Futures Sunday: Above is the 60 minute chart for ES (emini SPX futures). You can see that we opened lower—at just slightly below the 2.618 retrace level (the extension of the first wave down) that I mentioned in comments on Friday. This now lets me draw an ending diagonal with overlapping waves (finally!). It’s now clear where we’re going …. up to a new high. I was clear before, but the pattern was in question.
We still could top on Monday—we’ll have to see how rapidly this market moves to a new high.
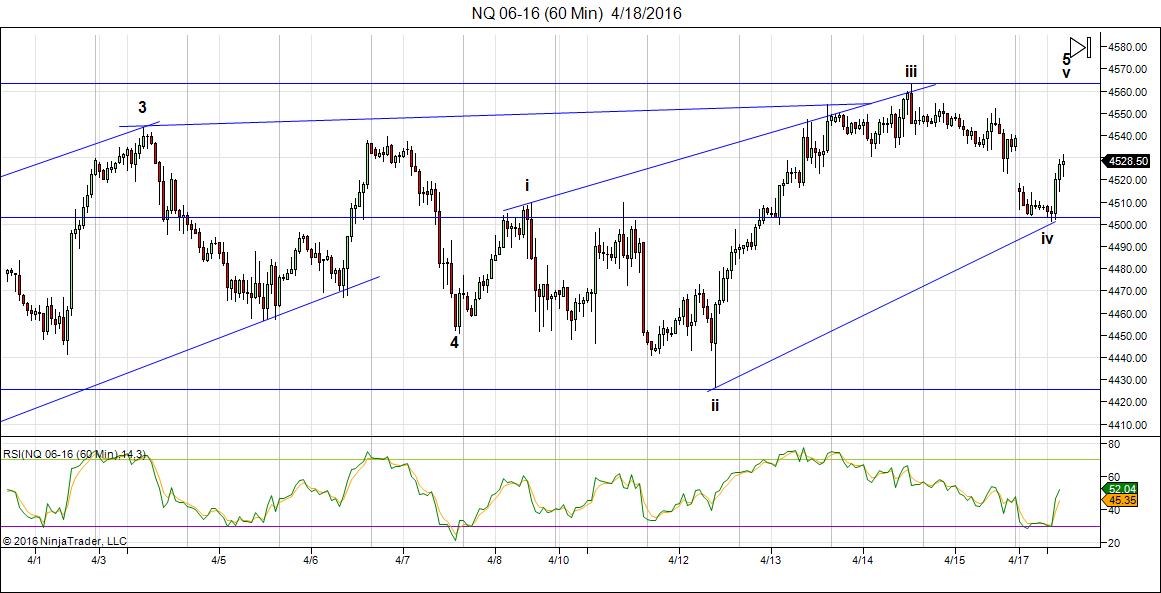
Here’s the 60 min chart of NQ. Same structure. You’ll find YM is almost exactly the same, except the 4th wave happened at a slightly different time.
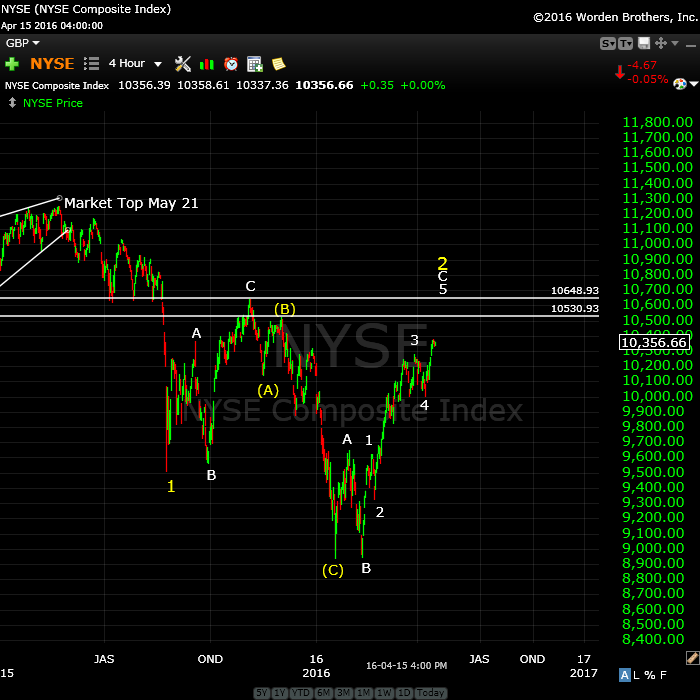
Above is the 4 hour chart of NYSE. I keep a fairly close eye on this index as it’s by far the largest in the world (in terms on capitalization). We are at the top of an ABC corrective wave (a bit more to go). I’m expecting at least a test of the yellow (B) level before the turn down.
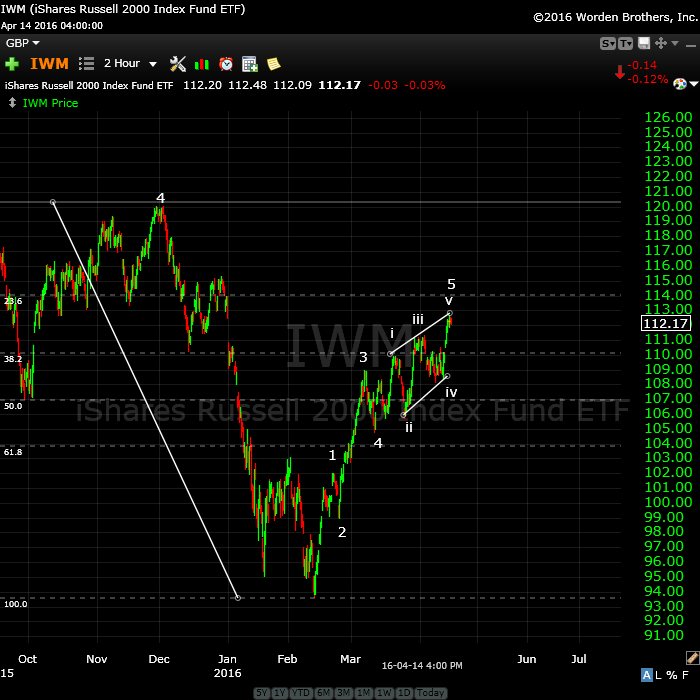
Above is a two hour chart of IWM (Russell 2000). It’s traced out a very obvious ending diagonal and just has the throw-over to complete. This is a small caps stock base and should give a pretty good indication of what’s happening overall.
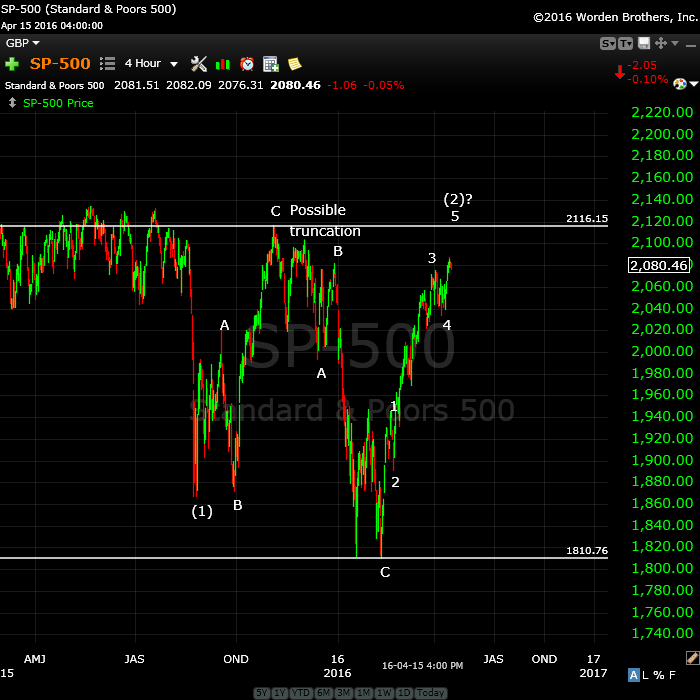
Above is the 4 hour chart of the SP500, showing the possible double 2nd wave top waiting to trace out. This would negate the “truncation” and create a spectacular EW textbook set up for a huge third wave down.
Second waves have few restrictions. The key rule is that they can not retrace to the previous top. They should retrace between 62 and 100% (but cannot hit the 100% retrace level).
It’s typical in a bear market for second waves to trace out a double prong (and ABC wave down in this case and a 5 wave structure up). The five wave structure, however, is not motive (subwaves won’t necessarily all be in “legal” 5 wave motive configurations).
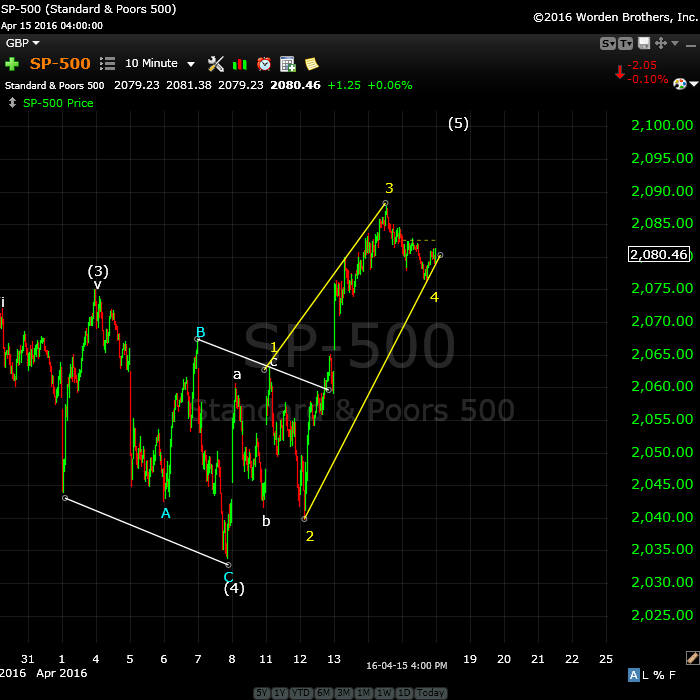
Above is the 10 minute chart of the SP500, so I can focus in on the wave structure of this final wave up. From the fourth wave bottom, we have a wave up in 5 waves. There is no overlap, so this suggests a simple 5 wave ending wave. However, none of the subwaves are in 5’s. They’re all in 3’s. Now, if you look at the most recent wave up (wave i on the right), you’ll find it’s also in 3.
These threes lead me to believe that we’re looking at wave 1 of an ending diagonal complete and that we’re working on the third wave up. OR … we’re going into a normal third wave, that interestingly enough (based on the length of the first wave) projects at top at 2120 (1.618 X the first wave), which is exactly the previous higher degree 2nd wave top (see my next chart below).
If this is an ending diagonal, this final wave will go up in three waves to a top and turn. If it’s a normal 5 wave ending wave, it will go up in 5 waves, of course.
Above is the 15 minute chart of the DOW. It’s similar to all the other indices, as it should be. Don’t be surprised to see the double pronged 2nd wave make it to the previous wave 2 level.
Note that just about everywhere I look at individual stocks, we’re in huge second and fourth waves spikes. This whole market is about to turn.
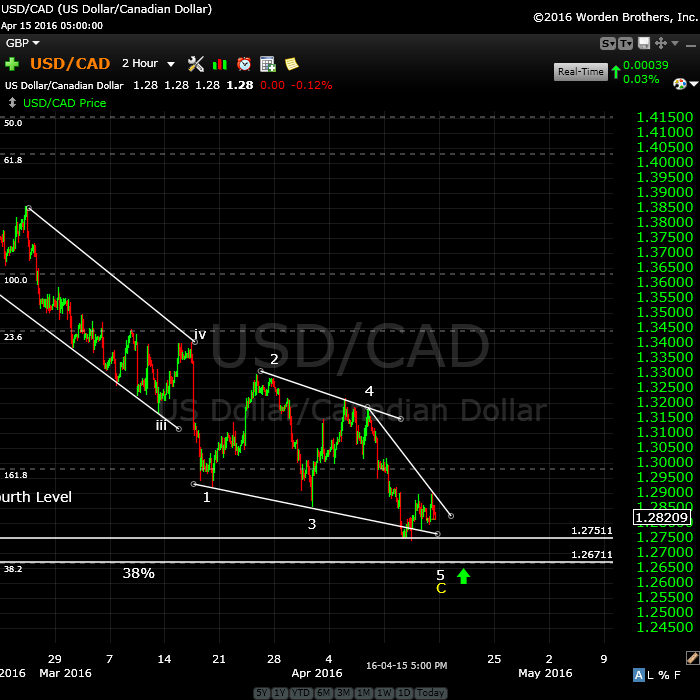
A Major Inflection Point: Above is the weekly chart of USDCAD. I have been following this for some time, and called the bottom of the third wave, expecting a retrace (although unsure as to how deep it would be).
The larger pattern is an ABC corrective wave, but the C wave is in 5 waves. We are completing the 5th wave of this pattern (an ending diagonal), which should reach the 38% retrace level (shown by the bottom white line) before turning back up.
Once it turns and heads up, it will head up in a fifth wave to a new high, a very lucrative trade. The euro, Australian dollar, dollar, and Canadian dollar are at similar major inflection points.
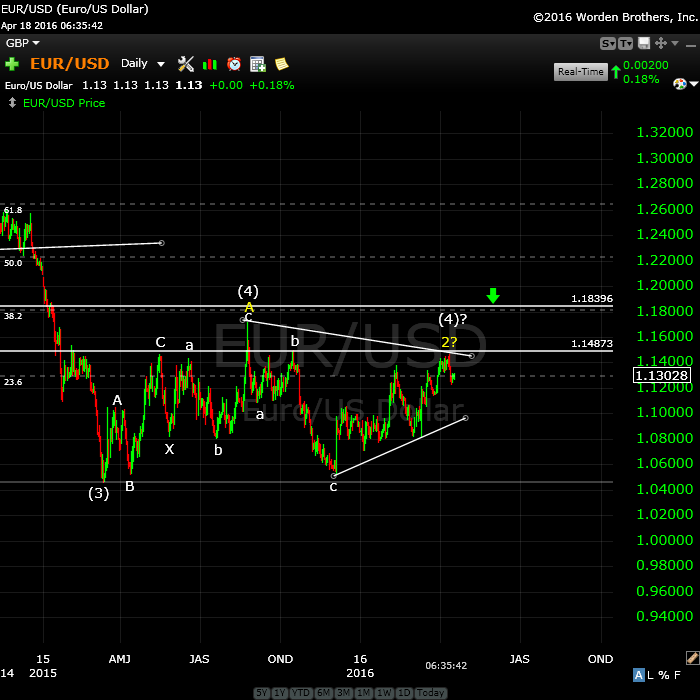
A Major Inflection Point: Here’s the daily chart of EURUSD showing the major corrective pattern from the low of March, 2104. I have been advocating for some time for a retrace to at least the 38% level, and I’m entertaining the possibility that we’re finally going to get there. Although I’ve been able to anticipate and call all the major turns, it was two weeks ago that the white C wave we’re in now turned decidedly corrective, as well. However, this current C wave should continue up to either the previous high (yellow A) or touch the 38% line and then turn down. Note that at that point, the white C wave would be exactly 1.618 X the white A wave.
On the chart, I’ve labelled my preferred top as (4)?. But I’ve also labelled yellow 2 (in case we don’t make the 38% level).
There is also the possibility of this being a triangle. Considering what’s happening Sunday night, the triangle may be the highest probability active pattern.
The eventual turn (at any level) should send up down into a very large 5th wave. It should turn in tandem with the US equities.
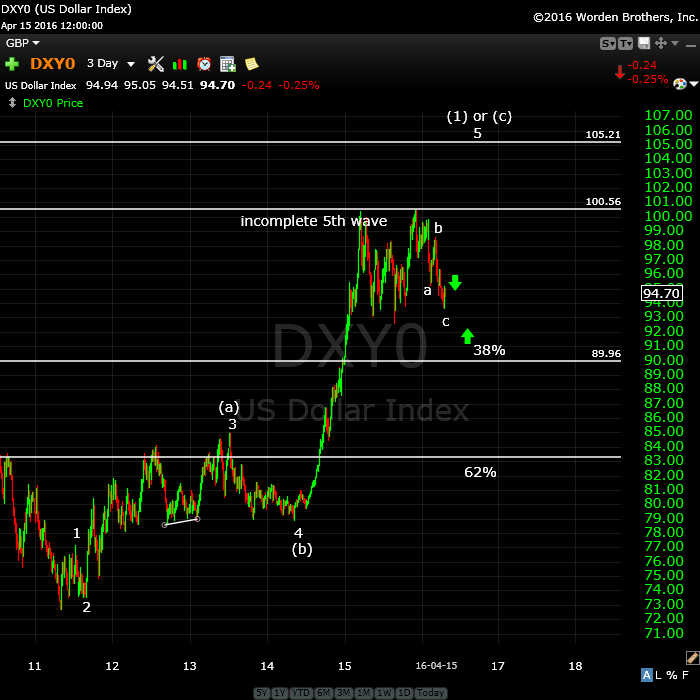
The US dollar (this is a 3 day chart) should do the same thing but in the opposite direction (up). I’m up in the air right now about the structure of this wave. Although in 5 waves, it looks more corrective to me than motive.
Short term, however, we’re heading up (after a pending double bottom). More in the video.
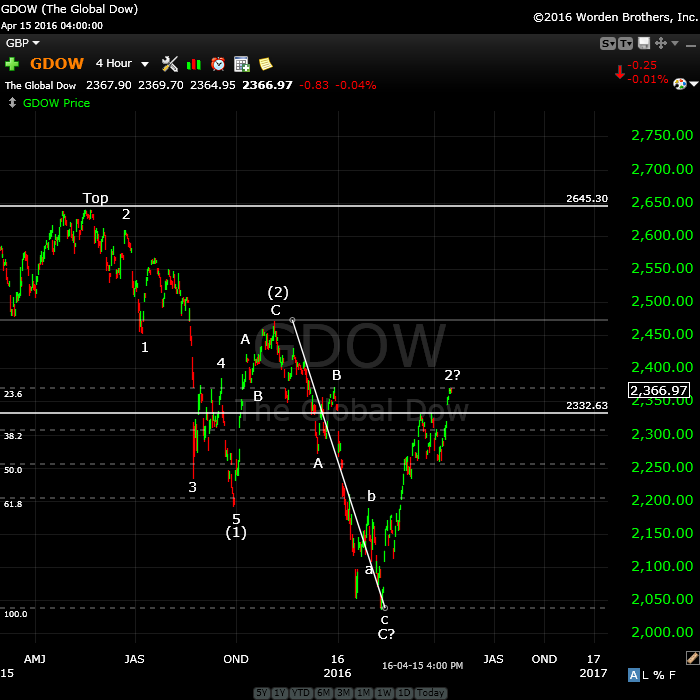
Above is the daily chart of GDOW (Global DOW) showing the current count. It looks to me like we’re tracing out a second wave after an ABC lower part of the wave. I think we have one more small leg up. This wave has stopped at the the 23.6% retrace level (or 76.4%) from the bottom of the wave (as forecast). Whether it will stop here or not is the question. If not, it will likely retrace tot he wave (2) level.
I do not see a path to a new high for GDOW and, in my opinion, this strongly lowers the probability of a new high for the main US indices.
________________________
First Wave Down – What to Watch For
This weekend we’re dangerously close to a top of a second wave (in the fifth of the fifth, with an ending diagonal pattern).
What we’re looking for to confirm a turn is a motive wave down in 5 waves.
Because we have an ending diagonal, the first wave will likely drop to the previous fourth, which is also the beginning of the ending diagonal pattern (~2022). After that, we should get a second wave that will retrace in 3 waves about 62%. That’s the preferred EW entry point. So don’t feel you have to rush in. There’ll be a much better opportunity at the second wave level than at the top and the risk is substantially reduced.
__________________________


Peter, thanks for outlining this pivotal turn so clearly.
You’re welcome! It’s the waiting for the inevitable that’s so frustrating. I think it likely we’ll see more of these double second waves in the subwaves after the turn down.
This is the moment tomorrow it’s all over:
http://time-price-research-astrofin.blogspot.nl/
http://econintersect.com/b2evolution/blog3.php/2011/06/11/the-double-triple-doji-have-we-been-warned
http://nl.investing.com/indices/us-30-chart
I personally wouldn’t rule it out. But we still have some work to do to get to a new high.
Hi Peter,
I agree it is either tomorrow or when mercury goes retograde at April 28.
The big drop will start around April 28 that is what I think.
Thanks for the update.
I added a chart of ES tonight (Sunday) as it retraced to the level that creates a valid ending diagonal. It’s at the top of the charts section of the post.
Hi Peter,
Great post! Thank you. You have the most detailed and reasonable approach to market analysis. Good job predicting last weeks rally and your currency trade.
PALS suggests weakness in SPX this week based upon apogee, full moon, declination.
Gee, thanks, Valley!
EW isn’t great on timing (as you know), so I listen to people like you on that. Otherwise, it’s pretty darned accurate. What we have as an added indicator for us right now is currencies, as a check against what equities are doing. We’ll see how this all shakes out.
I mentioned I’m looking to the end of the month, but on the other hand, I can’t imagine how this market can stay up that long based upon the current structure. This could all end very suddenly, but equities need to get to a new high … and nothing more (not a market high, just past the previous one).
PALS has not been so good last few weeks. Work in progress. Thanks for the EW lessons.
I think using them together to check each other is the ultimate tool … 🙂
K index has been at or above 4 for last few weeks which is causing geomagnetic effects, may cause market effects also, according to Hampson at Solarcycles usually to down side.
Hi Valley, I still have my three batches ( dollar cost averaging). I was looking for a down turn late last week. Basically even going into this week. Will unload before going long again. I see No severe down turn until the middle of May. I am waiting for an up tick in gold to short . All the best every one.
Hi Dave, I agree.
Hi Peter
I’m looking at your Sunday ‘Futures’ chart and you have 4 as the low on the 6th April and then you are starting your Ending Diagonal count of i, ii etc.
However your ii appears to be lower than the start of i (i.e. the previous 4). Even with EDs I don’t think there is any lee way for ii to go beyond the start of i.
Am I misunderstanding something here?
If however the 4 should be at the low of 7th April then i would end at the high of 11th April. In that case your current iv which is the overnight (Sunday/Monday) low has not overlapped i yet.
At the time of writing (10:41 BST) it has retraced some of that down wave to 2075, so if it comes back down then there is the definite possibility that it will overlap the top of the wave on 11th April.
Of course we then have the added issue that it is no longer just an Ending Diagonal but an EXPANDED ED.
Here’s a chart showing what I’m trying to say above. The text in Red is Peter’s and the text in black is what I’m suggesting. It is a chart of the S&P 500.
http://postimg.org/image/5qaft0vy1/
Sorry I meant to say that I agree with Peter’s iii wave marking hence I’ve not shown it on this chart. I think iv is still in progress and will come down to make a lower low than Peter’s iv mark.
Hi Purvez,
I reposted that chart for you so that it’s more correct. I didn’t spent a lot of time measuring it originally. My attitude on these is that if I have two sets of futures that are so obviously ending diagonals and the third one looks like one but the points are somewhat questionable, but I can see that they probably work, then it’s good enough for me. I also have CAD in an ending diagonal and that adds to the evidence.
So, since you’re keeping me honest (haha, and that’s fine), I went back and did the measurements and re-posted ES so that everything works. I also posted a chart of NQ so you can see what I was eye-balling when I posted the original chart. YM is also in an ending diagonal, but the wave apexes aren’t necessarily on the same days.
Except that the new chart has no wave 1/iv crossover. As far as I’m concerned the first works just fine, so we’re really into semantics at this point.
Actually, I went back and posted the original ES chart. I think it’s more correct. I have no problem with it as a valid ending diagonal, particularly with the structure of YM and NQ. I will post the two charts as a study in the forum tomorrow if I have time (it’s the middle of the night here at the moment …)
Blimey, Peter, my apologies. I wasn’t meaning to disturb your sleep…. or don’t you do that any more? LOL.
I’ll go look at what you’ve posted up there in a moment but I just had to comment on your ‘time keeping’!! 🙂
I happened to wake up and you presented a puzzle. It’s me, not you. Gets me every time! 🙂
Peter, I’ve just looked at the charts again and the only point I disagree with is having ii lower than the start of i. Other than that what you’ve posted is actually got the ‘right look & feel’ that RNE talked about.
…..But to break an EW rule is a bit OTT for me. A guideline I can understand but a rule is different.
Anyway I am both appreciative and grateful of your forthrightness on the subject. Perhaps it’s I who needs to ‘lighten’ up a bit.
Always question the count. I’m OK with that, really. But I always look at multiple charts for confirmation. That’s really the key.
We might just be looking for top tick today.
We have several ending diagonals working. The final wave should be in 3. We’ve completed the A wave and B wave and are working on the C wave. We need a new high (past the upper trendlines). We just might get it today.
Hi Peter,
ES now @ 2082
My target for the TOP will be 2088 – 2094
It should be today .
Regards
AZ
Hey, Mr. Fork,
That’s about what I have. Good stuff! 🙂
Yeah, today it is.
That is good Peter … two different methods … ending up with same target :-))
But we may not have the strength to get there … we’ll see.
We’ve now done a smaller 4th wave of the C wave, so we shouldn’t be too far away.
The euro is running out of steam. CAD seems to be stopping at a 62% retrace level. We seem to be stalling.
hi mr temple can the whole pattern from feb 12 be ABC with widenging c 5 broadening top …how can we post a chart here sir
You can easily post charts in the forum.
Do the words : ‘Blow off top’ match the action since the open today (at least on the DJIA)?
To keep everyone guessing I’m betting that we don’t go higher than last Thursday (14/4/16) high before turning down.
Purvez,
I’ve re-labelled that final set of waves. It still has some problems but I think what I’ve done is the best solution. Comments welcome.
HFT trader:
We must be close
Very strong $SPY selling into the rise from that program on the Accumulators..algos and dark pools both.
NQ appears to be in a first wave down … still a little early.
Off and limping again …
My measurements on ES take us to about 2092 now for a top. Hard to measure as the waves are so small.
Peter ,
The Top could have already be in ES @ 2087 ??
Let us wait and see if that could be the case
AZ
I count one more wave missing.
Oh not again please :-((
One more very small wave should take us to the target. You always need 5. we only have 3 and no motive wave yet.
Euro and CAD are also not quite there yet. Should still be today. Unfortunately, I’m going to be out during the final hour.
If we drop below ES 2080, then it should be all over.
The 4th wave in ES dropped so low, we may now only get to 2088 tops.
This wave up (1 minute) looks like a 5 waver (an ending wave), so look for a top after 5 waves. In the third now.
May 19, 2008
286 days (trading days)
July 8, 2009
286 days
August 25, 2010
280 Days
October 4, 2011
283 days
November 16, 2012
282 days
December 31, 2013
289 days
February 25, 2013
Cycles have ranged from 280-289. Today is day 288 from 2-25-13 resolution!
Thks, Peter! Cool info.
That 2-25-13 date should obviously be 2-25-15
From the 3/24/2000 high, 4/18/16 is 4037 trading days. Devide that by 14 and you get 288,4. Nice average.
Counting forewards with 289 I get 6/9/17, 8/1/18, 9/23/19 and 11/16/20.
Maybe handy to keep these dates in mind. 289 is 17-squared and 315 degrees in square of nine. Just some facts….
André
p.s.
A clean 289 average from 2000 we’ll have 4/29/16. This date I had for other reasons as a major date.
Mr. George , how do you count trading days ?, without going to calendar and doing it by hand . I have a web site for counting calendar days, adding to any date or subtracting from any date. But trading days stump me !!! Help ,please…nick
I use two different ways to count trading days. TradeStation has a cycle tool to count trading days. The second method is to confirm that count with my daily data on my Excel spreadsheets. Simply look at the row numbers and subtract one from the other (or add if you are looking for future dates, but you obviously need to be sure market holidays are accounted for out into the future. You can do that by googling NYSE holidays)…
thanks …n
Click the blue “count only workdays”. This should work for you.
Mr. George , how do you count trading days ?, without going to calendar and doing it by hand . I have a web site for counting calendar days, adding to any date or subtracting from any date. But trading days stump me !!! Help ,please…nick
9 times 289 calender days from the 2009 low date gives 4/19/16. Coincidence?
I think we’re pretty much there. I just got short. We’ll see what happens.
Peter,
Once again you were right , price did exceed ES @ 2087 , but I still feel the TOP price will not exceed 2094
AZ
Yeah, just got back in. I think we’re done. Now we just have to turn down. I think we’re still waiting for currencies, which aren’t quite finished.
I suppose we could drift a little higher but I agree 2094 would be about it.
Peter on hour Chart ……Es looks like in final stages of 3 of 5?
Robert,
On hourly chart, the wave should look like a 3 (although there will be 5 waves, the fourth should be very small, so the entire wave looks like a 3). It’s an ending diagonal, so the final wave should be a “3”. Hope that explains it.
I think we’ve topped out, but we’ll have to wait and see. Futures won’t come down without cash, so I don’t really expect too much to happen tonight.
Saturn in Sag may result in mania in financial assets until 2017, as happened in mid 80s, mid 50s, and mid 20s (29.5 year cycle). If this plays out market will be bullish until 2017 mid to end of year. Of course, earnings were much lower in each of those times.
Futures up big this morning. Would this be wave 5?
I think we’ve gone right to the spot mentioned in the video. That makes it the double second wave I was expecting. Expect a turn today.
You can also count the waves. We’re likely going to see this final small fifth wave up and a turn down. Let’s see how cash opens. But I would be on guard for an opening gap reversal (a reversal on the open).
I think the level (from memory) for the SP500 is 2116. That would be the second wave top. The DOW I had pegged at about 18134.
I posted some thoughts at the top of the post.
Briljant Peter,
I keep amazed how EW works..
Let’s see how it will play out and I m very curious what the downside will be of this wave down and when we will reach it?.
Mercury retograde has to be in… Like Sept 2015 and Januari 2016.
NQ (emini futures) got hit rather hard. Still 3 waves down, but if it only retraces 38%, we might get the rest of the wave down. EURUSD has retraced 62% from the previous high and it sitting waiting. I think we’re very close.
I’ll be watching to see if we get a double top here in ES.
Just when I felt it might be the last supper for the bears!
SPX 5, 10, 15, & 30 minute charts have signaled a sell…
SPX daily (early warning) indicator suggests that a daily sell signal is imminent…
SPX 5, 10, 15, & 30 minute charts were slightly positive at the close…
ES is down in 3 waves so far and will likely turn up at 2086. A fourth wave.
NQ is questionable. It retraced the 38% I was looking for, and may be completing a first wave. We’ll have to see where the retrace leads to. Cash indices all appear down in 3 so far. However cash Nasdaq, etc. looks like 3’s.
I think NQ is also in 3 waves. The fourth wave is too large and makes the entire wave a 3.
So it looks to me like we have a little bit more work to do overall.
Nooooooo stop this madness wave up!!! ^^
Peter, are you still thinking the SPX sees 2116 or does it just need to take out this mornings high to be considered complete?
Aaron,
I don’t actually know the answer to that. We need to at least take out the recent high (due to three waves down). EW would strongly suggest we need to get to 2116 to correct what otherwise is a truncation at the previous wave 2 top (and a large wave in 3 that needs to be corrected fully). So the 2116 level would be my preference.
peter,
the spx has been trading and closing at or above its upper band 2 standard deviation trading range for 4 trading days now, including today. the top of the bollinger band on the daily time frame is 2098. to reach the 2116 level will mean prices need to trade well above this band today/or tomorrow – the market looks exhausted here……
My guess is price may be strong or even until Friday (Obama in Middle East on Friday).
Bought 15.5 Vix call 4/29 exp. at .95. Total cost $100. Guessing next week will touch 2% or lower than todays close, or about 2050.
We end today with the direction still up. Because of the nature of ending diagonals, it’s virtually impossible to measure an ending point. However, I still think the larger scenario is a double second wave, with the target for SP500 at 2116. That doesn’t mean we can’t turn over sooner.
The Nasdaq is working on closing a gap, the lower end of which is 5007, I think.
US dollar currency pairs are hanging around their targets.
OK panic over, I have found the discussion.
Hello everyone 🙂
Kerry
welcome Kerry…as you review the website you will discover that Peter’s market forecast is a bit different from your expectations…
Welcome, Kerry.
Hi Kerry, nice to see you again!
This is looking quite toppy this morning. Let’s see if we turn down with a double top in ES at or shortly after the open.
I posted a chart of SPX during the night showing the target if the fifth wave extends to its full length, but that doesn’t mean it will.
My bottom line on this market is the immediate low 2085 in ES and 2091 in SPX. If we break those, we may be looking at ‘done.’ However, the current count says we need to beat the recent high or at least test it first.
I’ve been watching a rather motive wave down in the euro and we’re retracing a second wave at the moment, at the same time other assets are moving towards a double top.
Looking ominous. We’ll see.
In the indices, we have 5 waves up now, so this could be it.
Looks more like a 3rd wave now of an extended wave.
Good to have you in the room Kerry. with john hampson in hiatus, a few of us have found our way to Peter’s great site and analysis. regarding $spy this could be the item to take us to 2116 and beyond or as bloomberg puts it…last buyer left to take us “a few percent higher” http://www.bloomberg.com/news/articles/2016-04-20/quant-buying-may-add-a-few-percent-to-stocks-kolanovic-says @scott_minnesota
Looking less and less motive by the minute. However, I have to leave shortly for the rest of the session.
Currencies are possibly turning and if they do, the market does.
Peter, could you explain what you mean by when currencies turn, so does the market? Thanks.
Valley,
Over the past year, US currency pairs and major US indices have been moving in lock-step, closer and closer over time. This is due to the deleveraging of debt that’s starting to take place. I typically use one to time a trade with the other. I’ve mentioned this extensively and posted a few charts to show the similarities. Everything is at an extreme at the moment and I’m expecting them all to turn together. Euro looks like it may have done so today, although still early.
I got in quite late in the session, and I’ll have to look around a bit tonight. But I don’t see the top being in. My targets still remain. One more very small subwave up should do it, I think.
peter,
it looks like the reversal happened at 2011.05 [spx]. so a move below 2095?? should be the line in the sand to confirm the reversal?
All the waves are down in 3, so we need to get to a new high, but it should be the final new high.
ok – fair enough, although to me it seems that on the daily timeframe, the spx has a classic reversal doji candle today [usually marking a top]
rich,
There is indeed a chance we could have topped. In fact, I think NQ topped yesterday. But so far we’re down in three waves. If ES can get to 2090 tonight, there’s a good chance we’ve topped. The structure tonight looks good for that, actually.
Well that idea didn’t last long. We are indeed heading up tonight.
From astro point of view I don’t see enough compelling confluence until Ap 29 with Merc station and Sun 150 degrees to Mars retrograde. Think we to and fro towards a high for SPX till then….
I updated the SP500 chart at the top of the post and added some notes on sentiment, etc.
My lunar cycle work suggest Thursday will open off .5 percent or greater. Full moon minus 1 day often opens lower and then rebounds to close higher. Tomorrow is apogee or greatest distance which is one of the weakest days of the month.
FWIW, Apogee (Thursday) and three trading days after have yielded a negative 7.5% per year over the last 17 years (1998 to 2015). Greater lunar distance results in less energy (hence, best day of month for planting new seeds as ground is calmest).
Thanks, Valley,
While it looks like we’re going to top in the next day or so (NQ may have already topped—it hasn’t been able to vault above a 62% retrace level in a couple of days), I also don’t have a cycle turn date until the 29th and I know once we turn, we’re not going to hang around.
Looking at the euro tonight, I don’t see a clean 5 waves, so I think it still has to top properly, but I don’t think it will rise above the previous high from yesterday, which is at exactly a 62% retrace level.
Tomorrow could be it from what I’m seeing all across the market. DAX has also retraced 62% in a second wave and should turn now.
Lunar aspects: phase, distance, and declination all flip to positive towards end of next week. So, I will take what market gives on short side next few days and then readjust after next Wednesday’s Fed meeting.
For those who care, we have a Bradley turn date
this Friday…n
High (geo + helio)
2016-04-22 (Fri)
High (geo + helio)
2016-04-22 (Fri)
I added a chart of ES to the top of the post. It’s interesting as it’s traced out an ending diagonal within an ending diagonal … a much smaller one … as we getting smaller and smaller waves leading to a turnover.
Peter with the way things are lining up, with the assumption that the trend changes to down in the next day or two once the SPX target of ~2016 is hit, would the April 29th major turn date line up with a smaller degree wave 2 top on the first wave down?
It seems that during fed weeks the Market rallies From the Tuesday Morning until Thursday Afternoon/Friday Morning before turning. Certainly with the major turn date right after the Fed Meeting it seems likely to do that again.
scenario could be down a bit today through Monday and then the blowoff through and post Fed….
Hi Ted,
Could, but at this point, it’s pure speculation. So I don’t know.
peter,
great ES chart – thank you. it looks like we may be potentially reversing. an ending diagonal within an ending diagonal means what – a “really”? fast retrace back to the base of the ending diagonal pattern at 2030ish on that ES chart??
Well, the larger diagonal will eventually get back to the base once it tops (which would be yes, about 2030 or so). It may now just be a running triangle. The trendlines are no longer converging (as of this morning). There’s no difference to the outcome on the upside. Either way, we need a final new high.
Currencies are wild this morning. The market is so evenly balanced (bulls and bears), that’s it’s likely to be quite choppy as we try to get there. Currencies are set for one final wave up, imho.
yeah, i spoke to soon about reversing. and of course we could “truncate” in that final effort….we shall see…
Because we seem to be wiping out the truncation from December, I have never seen one. There are two possible ones listed in the Principle book (from decades ago)—that’s how rare they are. So don’t get your hopes up. Elliott waves always complete their pattern.
peter, quick question – so an extended wave as we have it [ending diagonal within an ending diagonal] is it fair to say that the wave “extends” because it needs more “time”? so it is primarily about “time” rather than “price”?
Likely both. Ending diagonals indicate a complete exhaustion of the larger wave movement. After all, they’re all overlapping waves in 3’s—nothing motive there at all. So are fourth wave triangles, for that matter. Price I think is the magnet here. I believe we’ll see 2116 in SPX before collapsing. Timing is another issue, but also plays a part.
We could still take days to finish this final wave up. It will no doubt drop back a bit a couple of times near the top. The 29th is a week away, so I wouldn’t put it past this market to jerk us all around until then.
We now have 5 waves up in SPX and ES and are almost at the bottom of a second (or B wave, don’t know which at the moment). Next is the third (or C wave up).
Based on the length of the first wave, the 3rd wave should go to the previous high (about 2111)—1.618 X the first.
Make the top of 3 at a little under 2010 SPX. You can see how these waves are sliding to the downside—weak market. Wave 3 might not make it that high before a correction.
ES is even weaker.
OK … so we start over. Forget I said anything …. lol.
🙂 lol. Patiently waiting. I hope there’s some 2 pm or close ramp magic.
This website is for educational purposes relating to Elliott Wave, natural cycles, and the Quantum Revolution (Great Awakening). I welcome questions or comments about any of these subjects. Due to a heavy schedule, I may not have the time to answer questions that relate to my area of expertise.
I reserve the right to remove any comment that is deemed negative, is unhelpful, or off-topic. Such comments may be removed.
Want to comment? You need to be logged in to comment. You can register here.