
 What “Second Wave?”
Western governments (and the main-stream media) keep promoting a potential second wave in the COVID-19 epidemic.
It’s extremely unlikely that will happen. In fact, this virus bug is all but done — the numbers are increasingly pointing in that direction.
The truth is that trends happen in five waves IN the stock market and OUTSIDE the stock market (in the real world — which, in actuality, we seem to have left, because there’s very little truth out there anymore).
If there is indeed a small “bump,” as happened during the 1918 Spanish Flu epidemic (which everyone likes to mention as a scare tactic, but not back up with facts), it will be small. It will have been almost entirely caused by the draconian and illogical approach to the current COVID panic — locking everyone up, so contraction is simply delayed.
Here’s the 1918 chart:
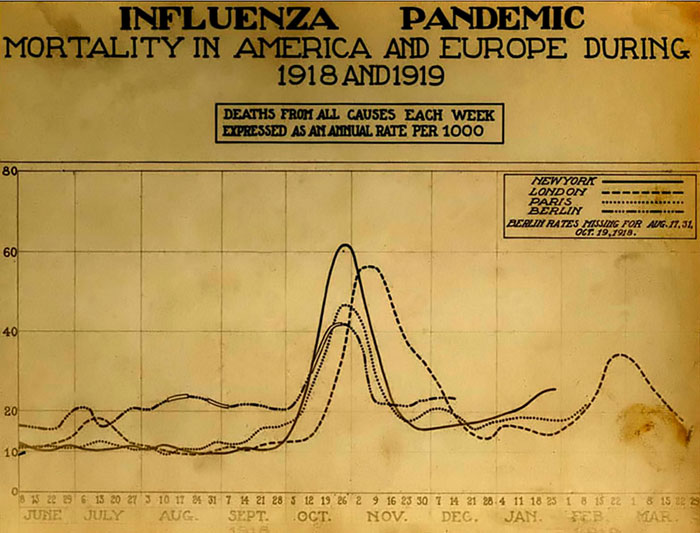
You can see by the above chart that there was one large wave up the fall of 1918 and then a very small B wave in late winter, 1919 that was tiny in comparison to the first set of waves. I suspect that’s what they’re talking about. In other words, for the most part, if we follow the same pattern, this flu virus is “done.”
We’re used to five waves in the stock market, as a result of the Elliott Wave Principle.
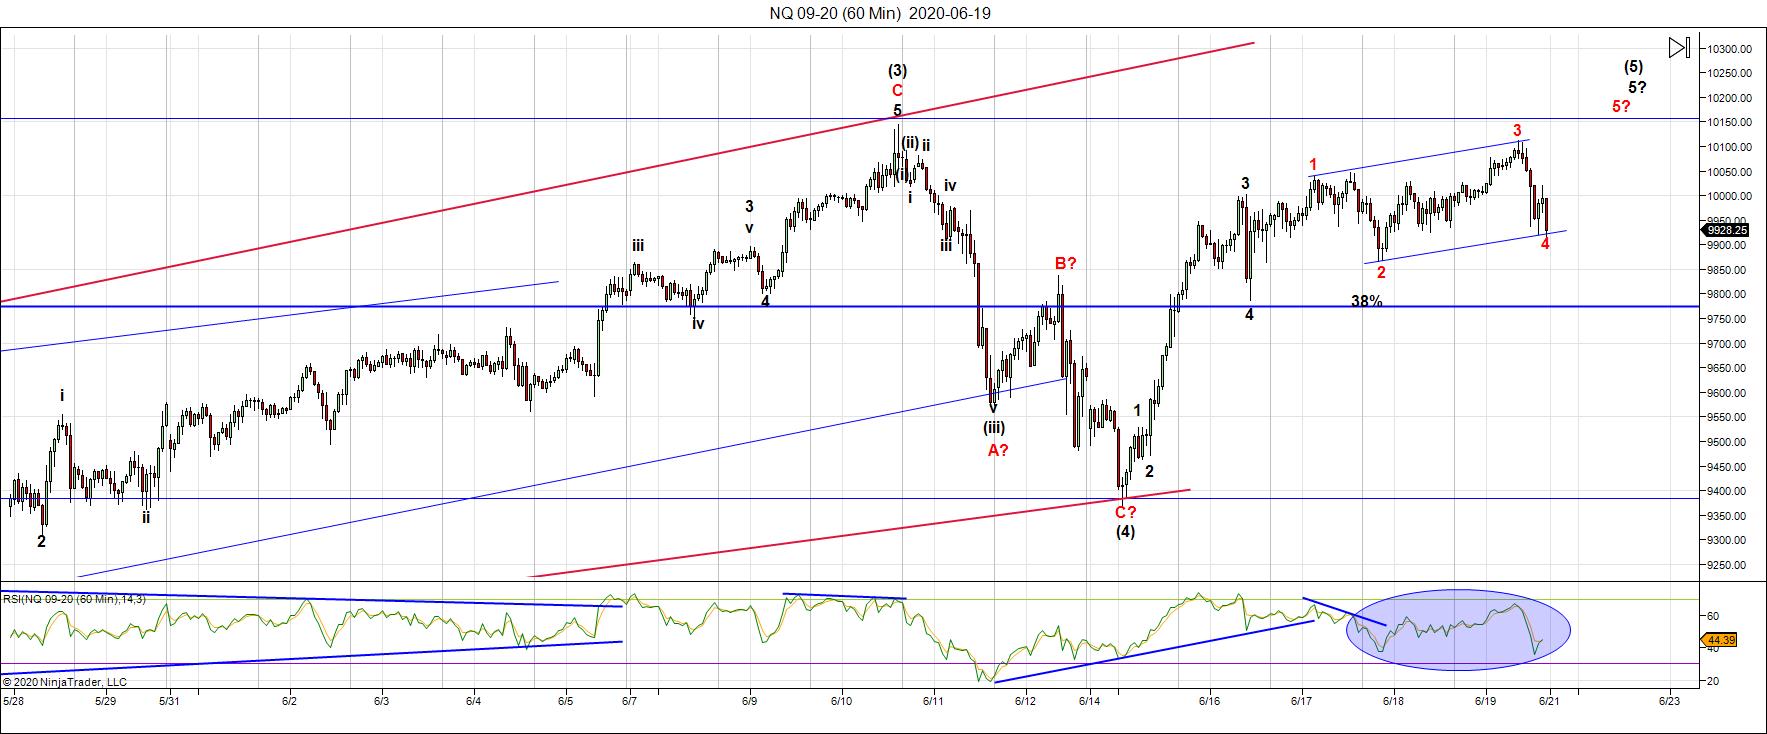
Above is the current hourly chart of NQ (Nasdaq futures). (click to expand) You can see (red 4) that we’ve had a fourth wave down in three waves from the week before this. Now we’re finishing of the fifth sub-wave (these waves are fractal). This is actually the fourth and fifth of a large fifth wave. We’ve completed three waves up of the final fifth sub-wave and are now in an ending diagonal, with one more small 5th of 5th of 5th up to a slight new high. Once it’s over, we’re going to see a very large drop.
This doesn’t just happen in the stock market.
Let’s look at the end to smoking, a trend that ended in the 1960s after 5 waves up.
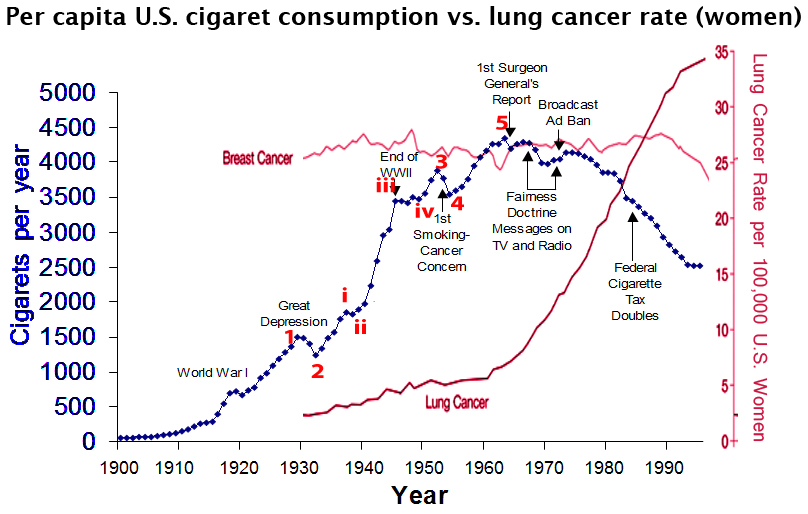
As per the diagram above, the Elliott wave structure of five waves up (or down, for that matter), with waning volume in the fifth wave, is not exclusive to the stock market. You’ll find it as the foundation for any major trend throughout society, worldwide. There is higher definition and accuracy in the graph structure based on how much of the population is involved (ie.-the size of the sample).
The red numbers in the chart above are mine, The data comes from the United States Department of Agriculture: The 1986 Surgeon General’s Report. Note that the third wave even has 5 motive sub waves within it (an Elliott wave “hard” rule)!
Also take note of the fact that the government gets involved once the trend has changed. But nevertheless, they’ll take the credit for the success of the change. This is just a fact of life, and happens over and over again throughout history.
Where I live in Calgary, Alberta, the mayor is just now introducing face masks in the public transit system. This is in mid June, 2020, after the virus has pretty much “left the building.” The same thing is happening in London, England this week — but they’re making the wearing of masks mandatory (which have no actual affect — that’s the science!). And there is absolutely NO science in social distancing. It’s all a lie.
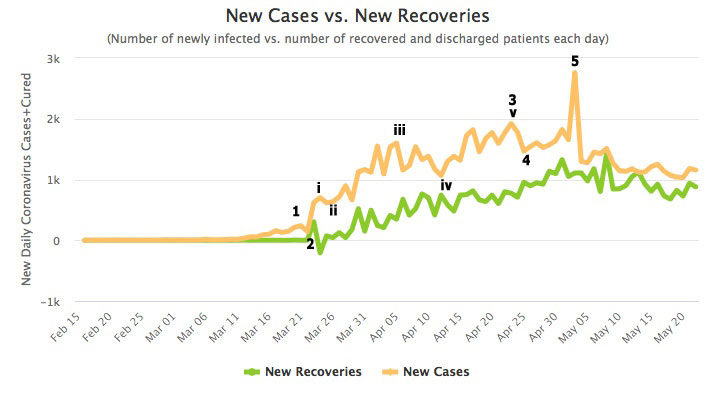
Above is the Canadian experience. Five waves up again and at this point (more than a month later), cases are dwindling fast.
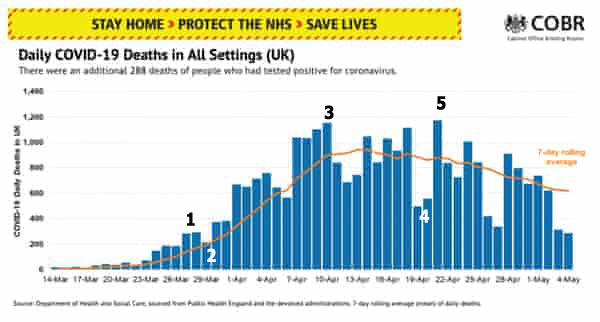
Again, in the UK, five waves up and you can actually count five waves within the third wave up. And then it was over.
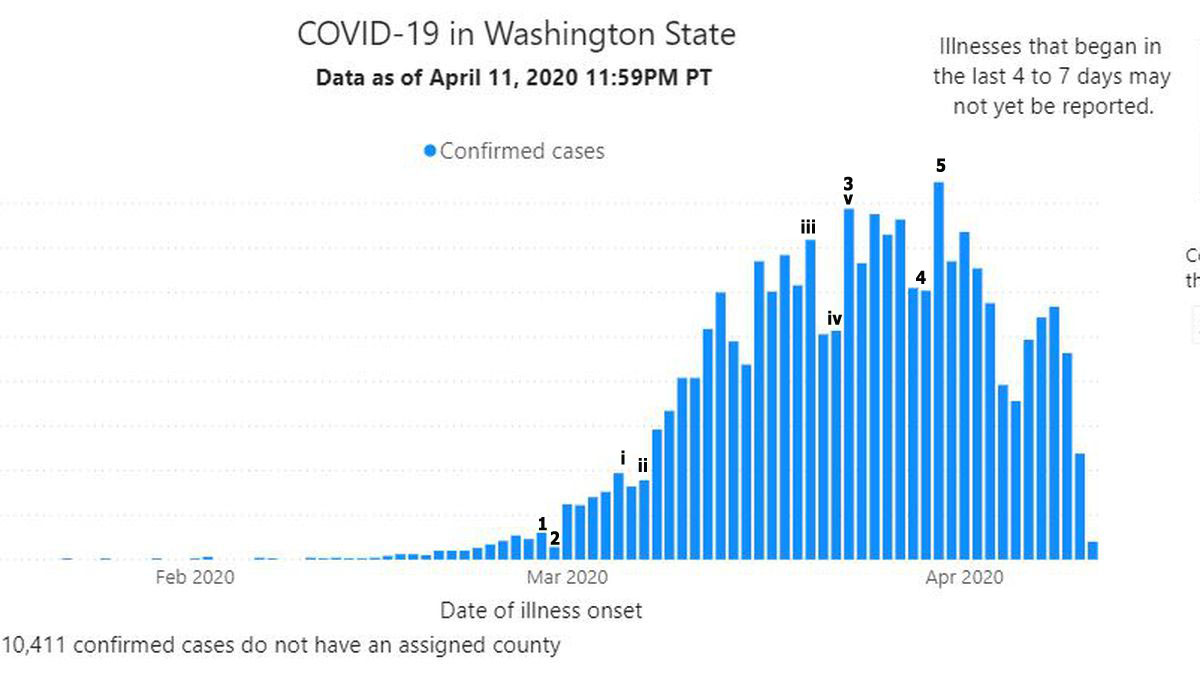
This chart is from Washington state in the US. The deception goes on and on. You should be concerned about this — the deception — and the removal of your right to liberty, which in Canada is guaranteed in the Bill of Rights and in the US, under the Constitution. What governments are doing restricting your freedom is against the law.
Most of what you’re hearing in the main-stream media is a complete fabrication of facts. The truth will come out, though — it always does when social mood turns negative, and particularly at the top of this major 500 year cycles. Governments almost NEVER tell the truth, and they NEVER admit when they’re wrong.
However, Larry Kudlow, Director of the US National Economic Council, last week said this:
‘Look, I’m not the health expert, but on the so-called spike I spoke to our health experts at some length last evening. They’re saying there is no second spike,’ he said.
‘Let me repeat that, there is no second spike.’
Strangely, that article is now difficult to find on the web …
Here are some articles that are much closer to the truth than anything you’re likely hearing elsewhere (although all on Zerohedge, they’re from different sources).
Lies, Damned Lies, & COVID – 19
60% of People Naturallly Resistant to SARS-COV 2
81% of Canadian COVID Deaths are in Nursing Homes
Toto, We Ain’t n ‘Flatten The Curve’ – Land Anymore
YouTube Censors Doctor Knut Wittkowski
What’s really going on here? It certainly isn’t what the public is being told. “Question everything” should be the new method of analyzing what you hear.
If there’s a “second wave,” it will be tiny and will be because we attempted to lock everyone away so they they’re all still susceptible to contracting it. That’s illogical. It’s nonsense.
Know the Past. See the Future
_______________________________
Want more truth?
My new site and discount for monthly articles and video on how to stay healthy and wealthy over the next five years is now live. Getting to the real truth, based on history, is what I do, inside the market and out.
To sign up, visit my new site here.
All the Same Market.
I’ve been mentioning for months now that the entire market is moving as one entity, the “all the same market” scenario, a phrase that Robert Prechter coined many years ago, when he projected the upcoming crash.
We’re in the midst of deleveraging the enormous debt around the world. Central banks are losing the control they had and we’re slowly sinking into deflation world-wide, with Europe in the lead.
The US dollar is fully in charge of both the equities and currencies markets. They’re all moving in tandem, as I’ve been saying since September of 2017. Over the past three years, their movements have been moving closer and closer together and one, and now they’re in lock-step, with the major turns happening at about the same time.
it’s challenging because often times currency pairs are waiting for equities to turn, and other times, it’s the opposite. The other frustrating thing is that in between the major turns, there are no major trades; they’re all, for the most part day-trades. That’s certainly the case in corrections, where you very often have several possible targets for the end of the correction.
We’re now very close to a turn in the US indices, currency pairs, and oil. Gold looks like it’s still on hold a little longer. Elliott wave does not have a reliable timing aspect, but it looks like we should see a top within days.
_________________________________
Elliott Wave Basics
Here is a page dedicated to a relatively basic description of the Elliott Wave Principle. You’ll also find a link to the book by Bob Prechter and A. J. Frost.
______________________________
Get an upper hand … JC 2
Get an upper hand in trading …Seeing all the different currency pairs and the wave structures and hearing you explain why this has to do that on a nightly bases gives one a upper hand when trading. Elliott Wave applies to all stock and indices and can be applied to any candlestick chart. If someone ask what you want for Christmas – Tell them a membership to Peter’s “Traders Gold!”—JC |
The best of them JL 2
The best of them …Last couple of years, I subscribed to several ‘market traders’. You are by far the best of them and the personal contact is awesome. Daily and daily updates are very well written! Besides your expertise in EW, I also like your cycles analysis. Best investment I ever made! —JL |
A true expert in Elliott Wave FL 2
A true expert in Elliott Wave …You are a true expert in EW analysis. What you provide is not available anywhere and is priceless. Subscription on your services is the best thing I have ever done. Many thanks for your effort to make me a better investor. I now have more trust in my investment decisions. I hope you will continue the excellent work! —FL |
Couldn’t be happier … KK 2
Couldn’t be happier …The analysis and insight you provide is simply amazing! I’ve been trading the futures and equity markets for well over thirty years and usually average around 5% monthly. Since joining your Traders Gold Service two months ago, that number has better than doubled. I couldn’t be happier.—KK |
Tops in your field DZ 2
Tops in your field …You are tops in your field. Tried to follow Elliot Wave international for years. They were always behind the market. After discovering you, I perceive that you are an expert in reading the waves, which puts you way ahead of the rest of your peers. And you can read the Waves like you are reading tomorrow’s financial section. I pray you stay healthy. —DZ |
Have not had a losing week RW 2
Have not had a losing week …I have been with Peter almost a year. The only thing that matters is have I made money with his service. I think I have finally turned the corner using Peter’s EW. I have not had a losing week in the last 5 months. Thanks Peter, for your amazing amount of hard work. —RW |
Rise above the rest … SM 2
Rise above the rest …I have only ever met a few people who, in their chosen fields (astrology, medicine, music, martial arts, technical analysis), rise above all the rest and you are one of them…you have ‘the gift’…and that’s why I’m a Trader’s Gold member. —SM |
the real deal SM 2
The real deal …‘Educational, insightful and thorough market analysis for all levels of traders. It’s Elliott Wave at its best….Peter Temple is the real deal’ —SM |
US Market Snapshot (based on end-of-week wave structure)
This chart is posted to provide a prediction of future market direction. DO NOT trade based upon the information presented here (certainly NOT from a daily chart).
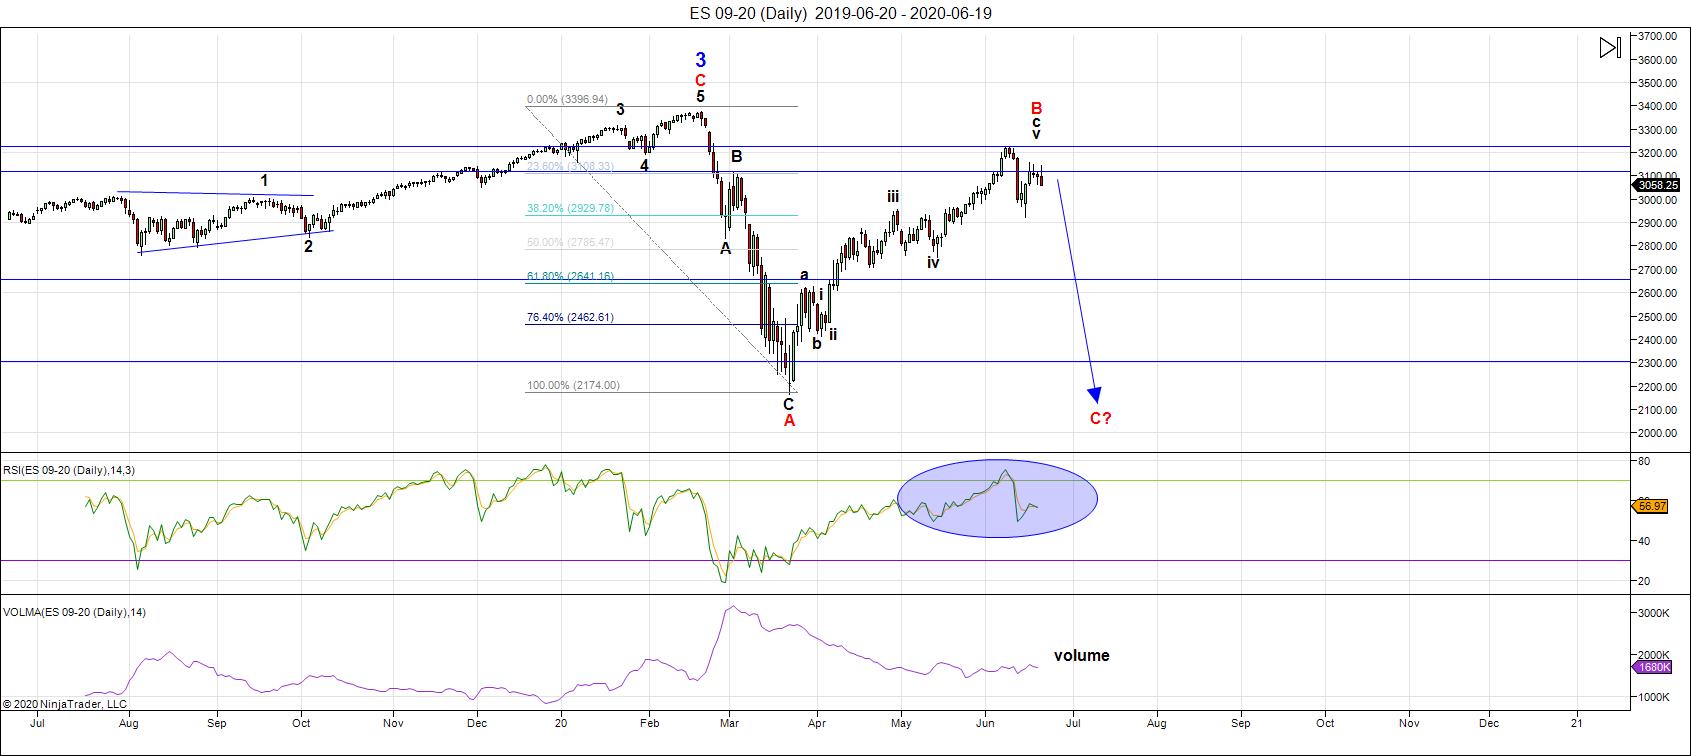
Above is the daily chart of ES (click to enlarge, as with any of my charts).
Two weeks ago, I'd called a top and we got it. We came down in what "counts" as five waves. However, that was where the excitement ended.
By Monday of this past week, it became obvious that the set of waves down was corrective. It could have been the first part of a zigzag, but fibonacci measurements that would allow for a follow-up five waves didn't pan out, as far as I was concerned. It just didn't look or seem right.
But the deciding factor was the pattern in NQ. It was definitely NOT five waves; the fifth wave was many times larger than the first wave, and the overall count was best as a zigzag on its own.
This past Monday morning, as we began a rally that very quickly began to look motive, I called for a new high. The wave down from the high was obviously a fourth wave. That means that in ES, we'll have one more high, which because of larger degree fibonacci measurements, will be minimal. We're "there" — we just need to cross the 't's and dot the 'i's.
In the background this weekend is the "perfect storm" for a trend change. We had a huge option expiry session, particularly in futures, which will remove a lot of the overall bullishness of the past 3 months. That doesn't mean we head down immediately.
On Saturday, we have Solstice, which is known as a trend-changer. When I was at the Foundation for the Study of Cycles, we paid a lot of attention to the ten day period around Solstice.
On Sunday, we have an Annular Solar Eclipse (seen only in Africa and Asia) on top of a New Moon. So, it's quite a weekend shaping up.
Sometime after the "fireworks" of this weekend, I'm be expecting a minimal new high and the long-awaited trend change.
As I've said over and over: There's a lot of manipulation going on (the Federal Reserve is doing whatever it can to prop up the market with more debt) — a very stupid idea, and you and I will pay for it in the end. Inflation through the extraordinary "printing" of debt has had its affect on the market overall. However, the problem is simply too humongous (the dollar is worldwide) and the Fed will fail. We're getting close to seeing the result, which will be spiralling deflation.
The waves play out in 5's, as they always have. We're in the final subwave of a five wave countertrend (part of an ABC correction).
___________________________
Summary: We appear to be in a "combination" fourth wave down from the 3400 area. We have an A wave down in place from 3400, a B wave up almost to that same level, and now we're expecting the long-awaited C wave to unfold.
We're expecting a trend change within the next week.
The pattern down should be a combination pattern and, as such, may contain zigzags, flats, and possibly a triangle or ending diagonal at the bottom.
Look for a new low below 2100: There are several possible measured objectives below that point.
Once we've completed the fourth wave down, we'll have a long climb to a final slight new high in a fifth wave of this 500 year cycle top.
_________________________________
Trader's Gold Subscribers get a comprehensive view of the market, including hourly (and even smaller timeframes, when appropriate) on a daily basis. They also receive updates through the comments area. I provide only the daily timeframe for the free blog, as a "snapshot" of where the market currently trades and the next move on a weekly basis.
I do a nightly video on the US indices, USD Index (and related currency pairs), gold, silver, and oil) right down to hourly charts (and even 5 minutes, when required).
______________________________________


