
Update Friday, June 10, 10:30 AM EST
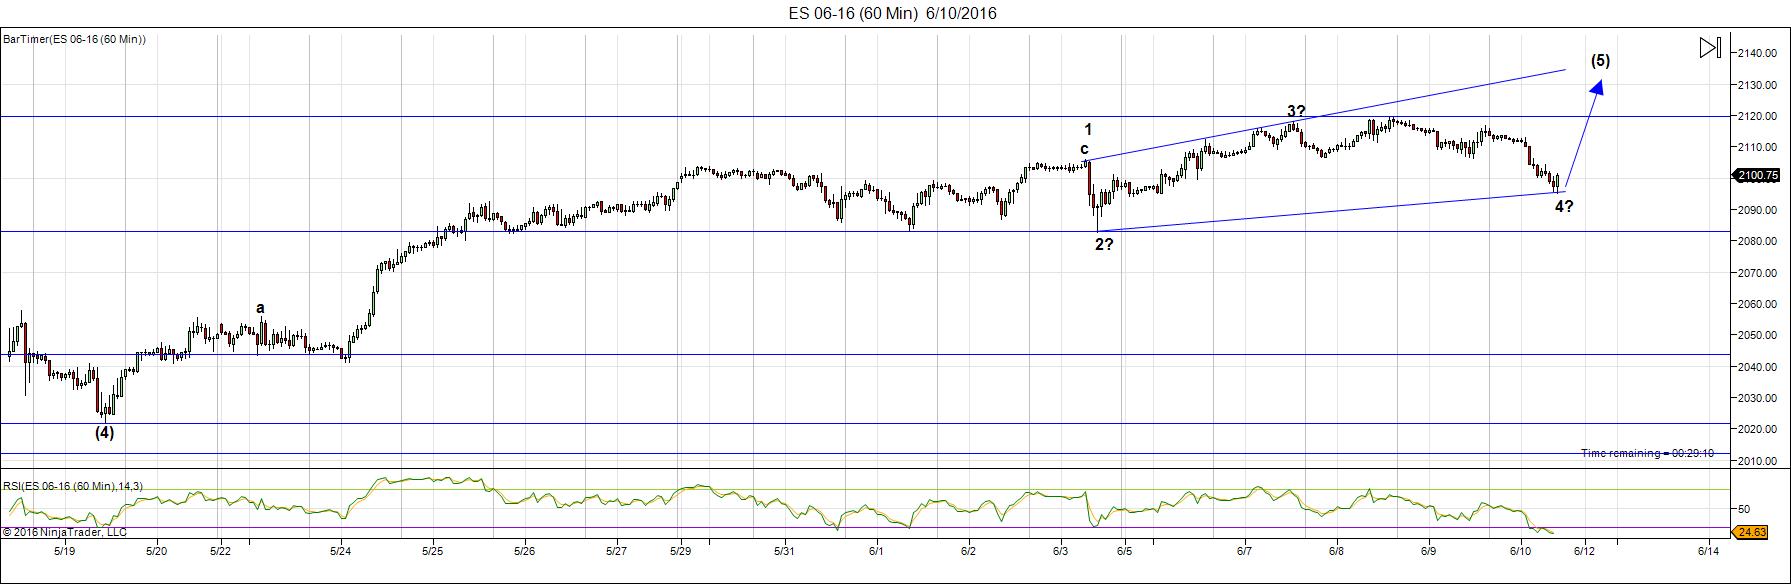
Above is the 60 minute chart of ES (emini SPX futures). I’m showing the possible expanding ending diagonal. The final wave would be go up in three waves past the upper trendline (the throw-over) before turning down for good. I’ll post the alternate converging ending diagonal on the weekend. The result will be the same, either way.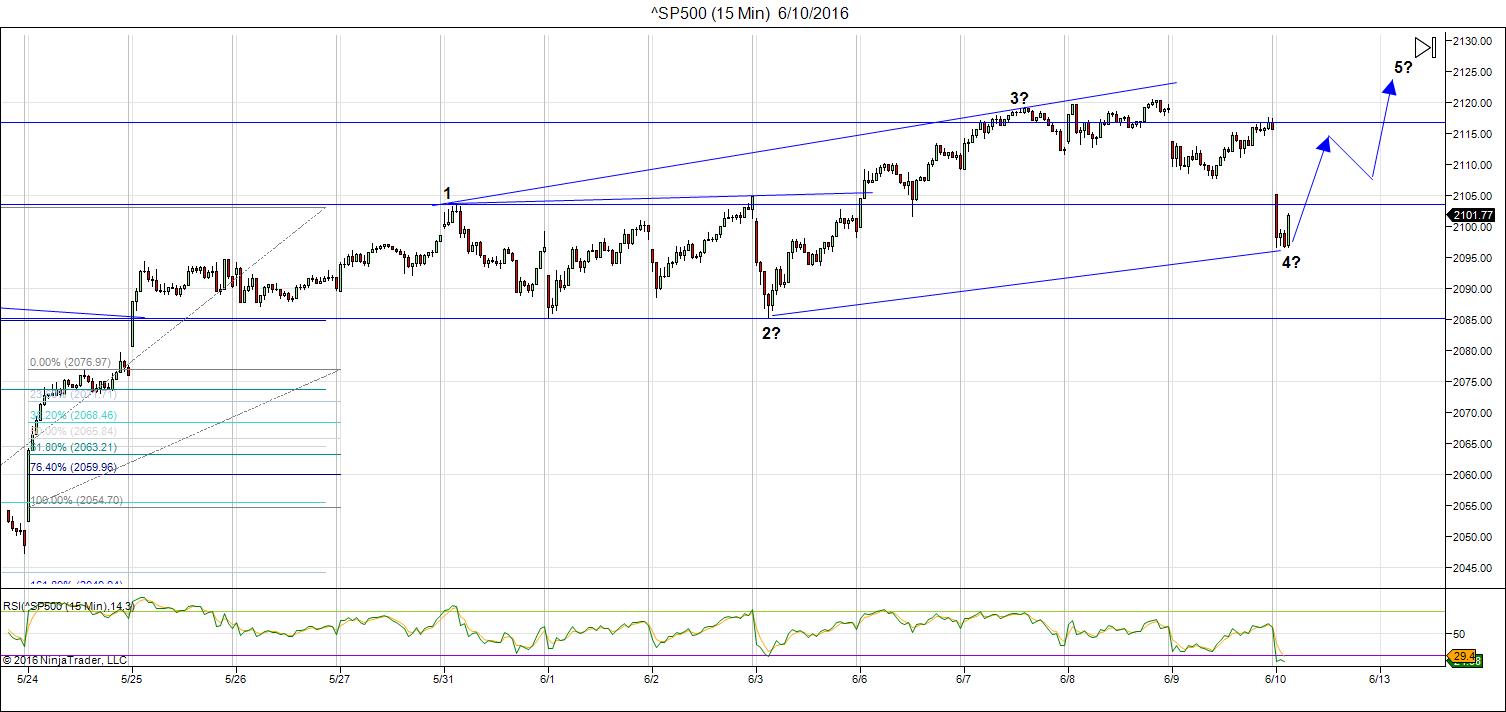
Above is the 15 minute chart of the SP500 showing a similar pattern. The alternate would have us at the the bottom of the second wave now, with 3, 4, 5 still to go.
________________________
Update Thursday, June 9, Before the Open
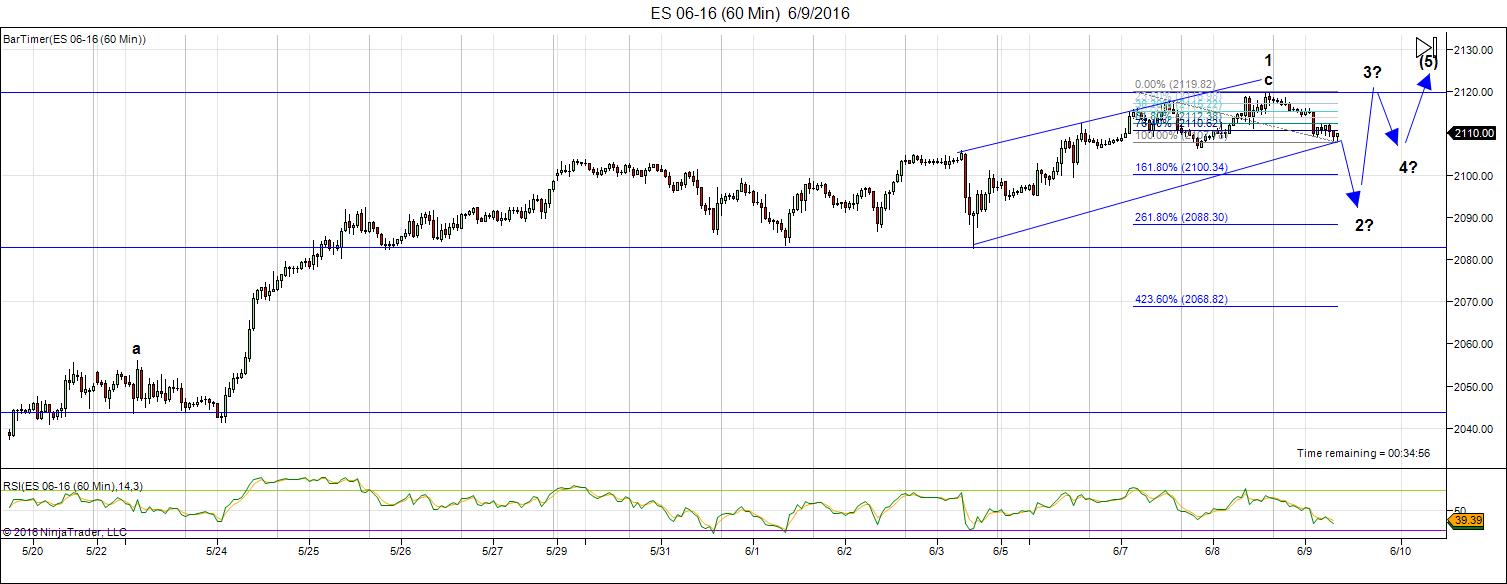
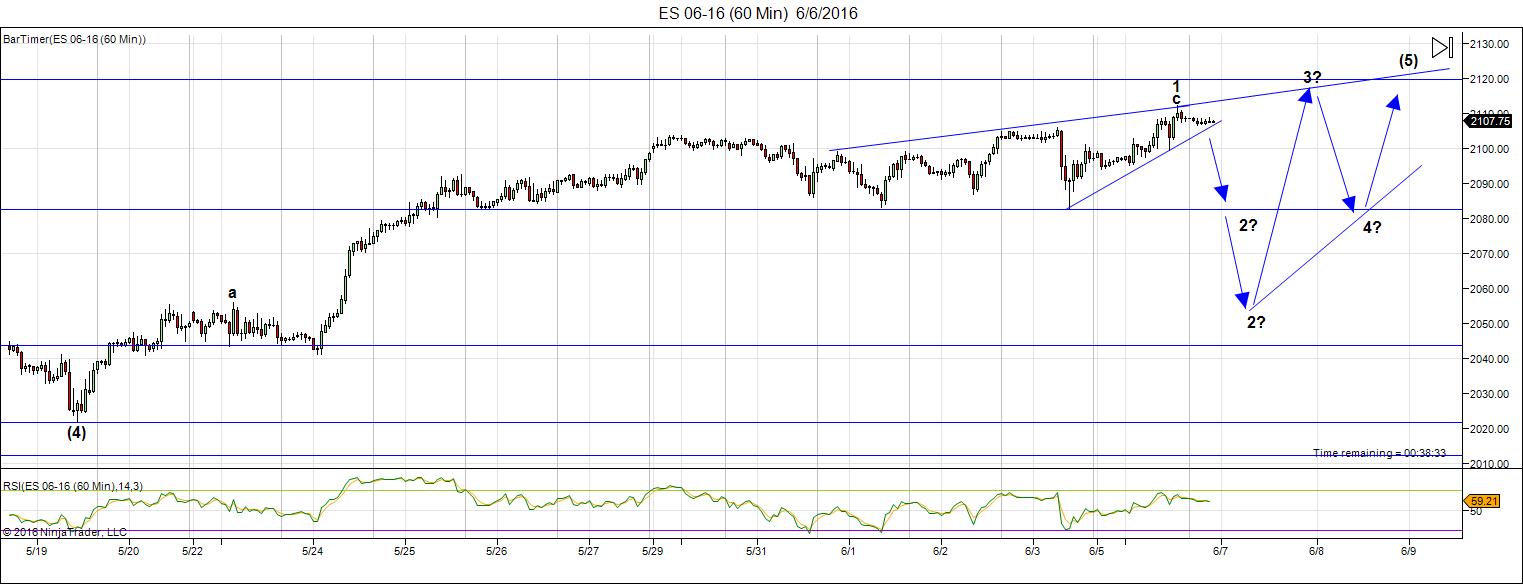
Above is the 60 minute chart of ES (emini SPX futures). We came down in what looks like at A wave overnight. Expect a B wave and then a C wave down. I’m marked some likely targets. EURUSD came down in an A wave, so expect the same thing there. You can let this be your guide. Currencies are tracing out my latest projection.
This is shaping up to give me what I’ve been expecting—a more traditional ending diagonal. I’ve drawn a possible path above. After this wave down (wave 2 of the ending diagonal?), I’d expect one more wave up in three waves.
I’m still focused on Yellen and June 15 for a major turn.
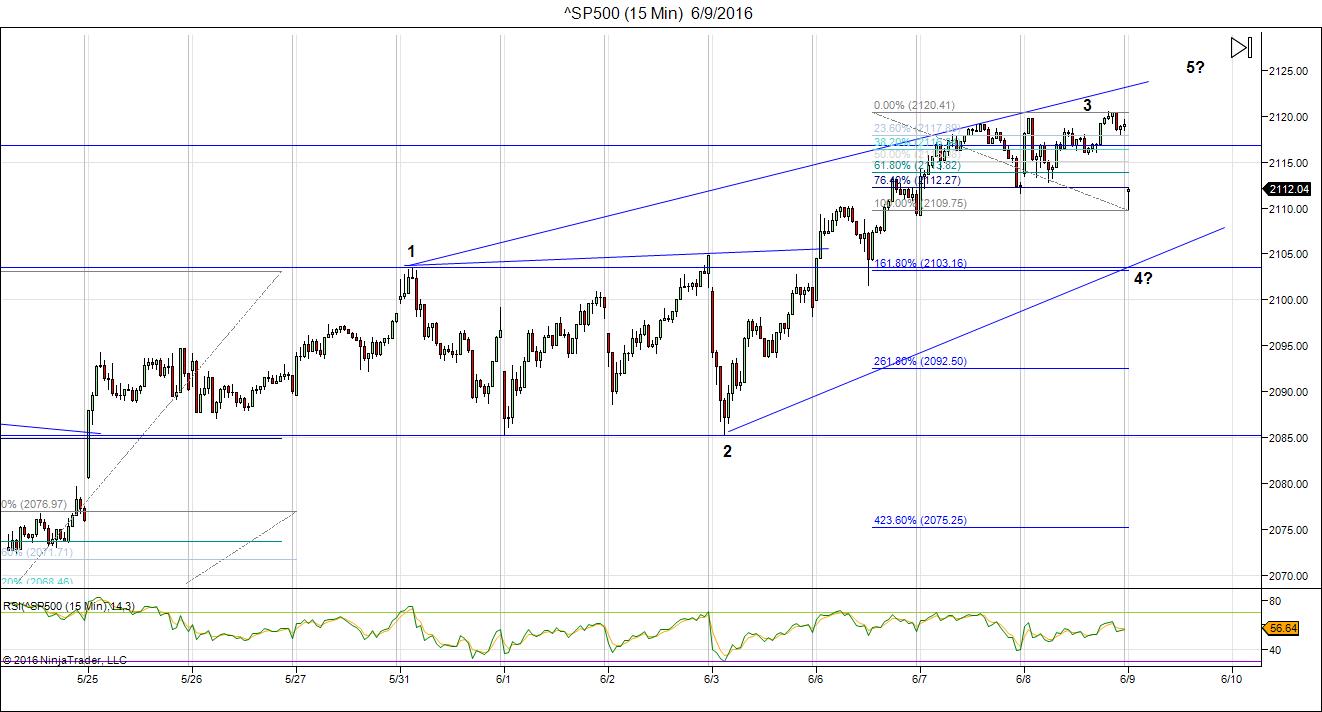
Above is a 15 minute chart of the SP500 showing the same potential ending diagonal tracing out. I would expect a B wave up now, then a C down to complete the 4th wave, leaving one more wave up to a final top.
_______________________
Update Wednesday, June 8, Before the Open
NOTE: I have changed my short-term prediction on US currency pairs. The labor report on Friday seems to have completely changed sentiment and I see all US currency pairs finishing up now.
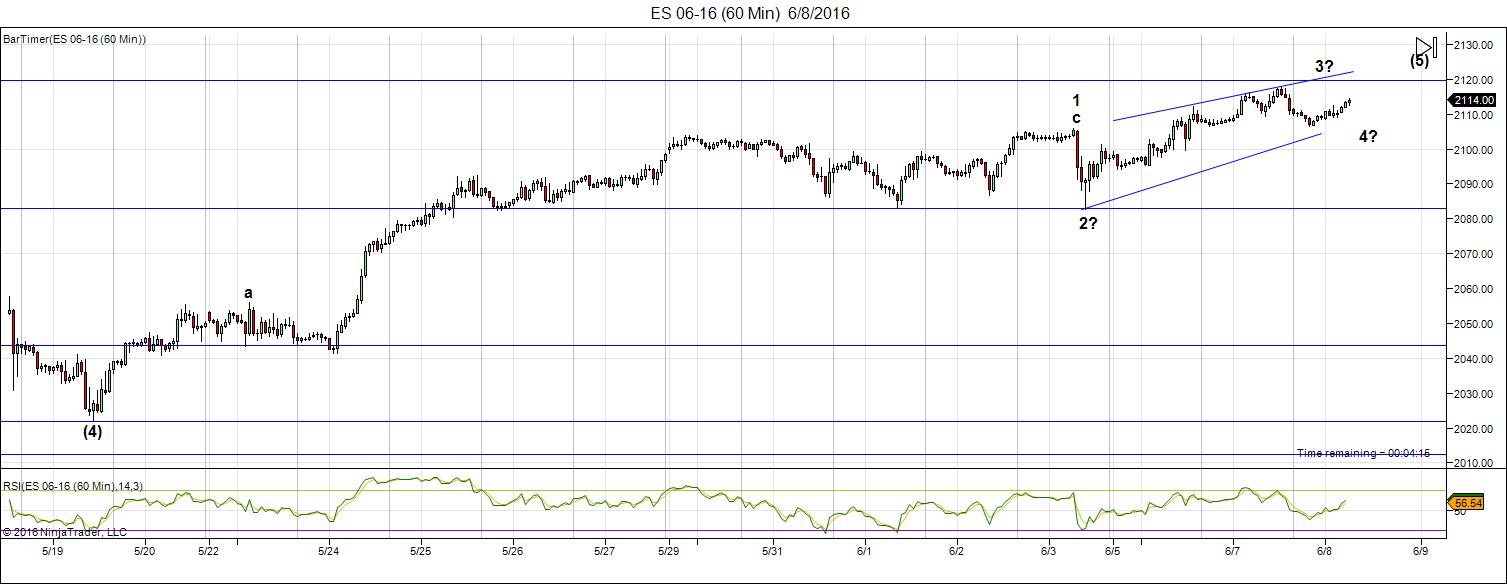
Above is the 60 minute chart of ES (emini SPX futures). Yesterday’s action seems to be confirming that the ending diagonal is going to be very shallow (which is somewhat unexpected, but nothing wrong with it). We may have another short leg down, hard to say. My take on this is that the 5th wave of the ending diagonal is close to beginning (if not already).
However, we could still drop and trace out a larger ending diagonal—we’ll just have to see what happens. I’m somewhat unconvinced by the shape of the current pattern I’ve drawn, although a larger pattern won’t change the eventual outcome.
This final wave should move above the top up-sloping trendline (the throw-over). I have no target for the ending diagonal. These patterns stop when they stop. However, I do not expect a new all time high. I suspect we won’t see a whole lot of movement in the next few days leading up to the June 15 Fed announcement.
The currencies are supporting the fact that an end is near. I will post a couple of charts for currencies shortly.
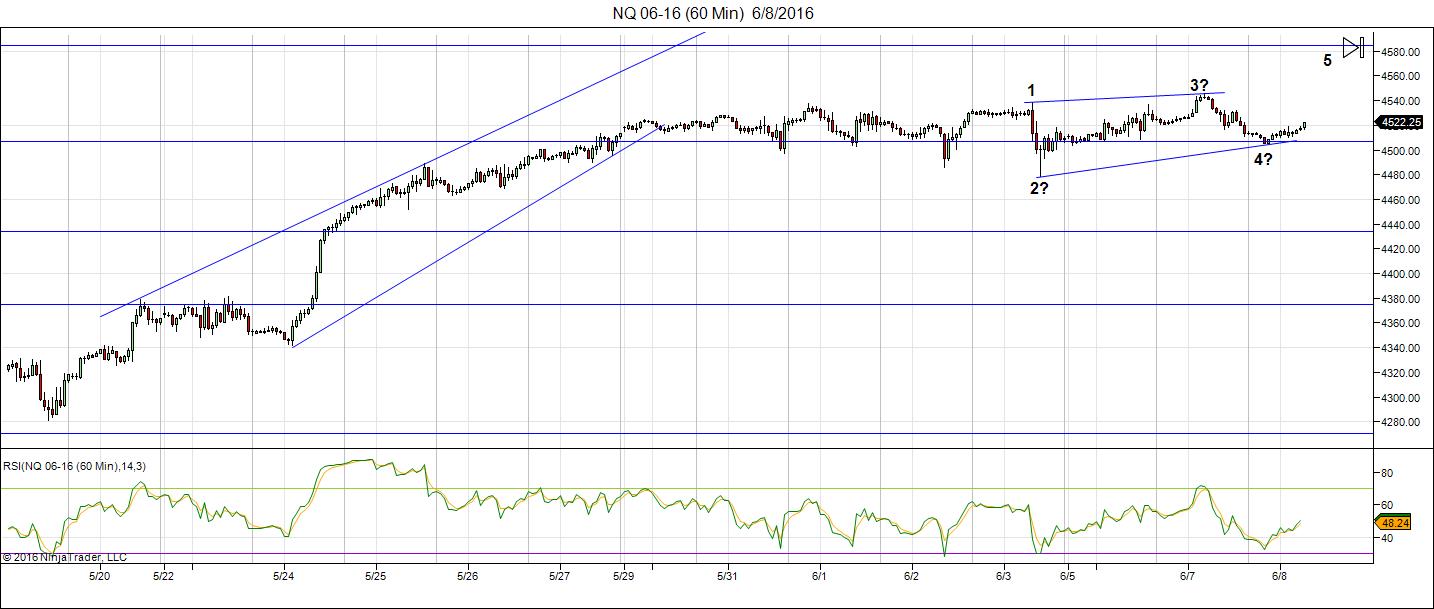
Above is a 60 minute chart of NQ (emini Nasdaq futures). It’s the same story here. A very shallow ending diagonal seems to be taking shape. The prognosis is the same as ES. In the cash indices, I’m seeing much sharper patterns, with the same prognosis.
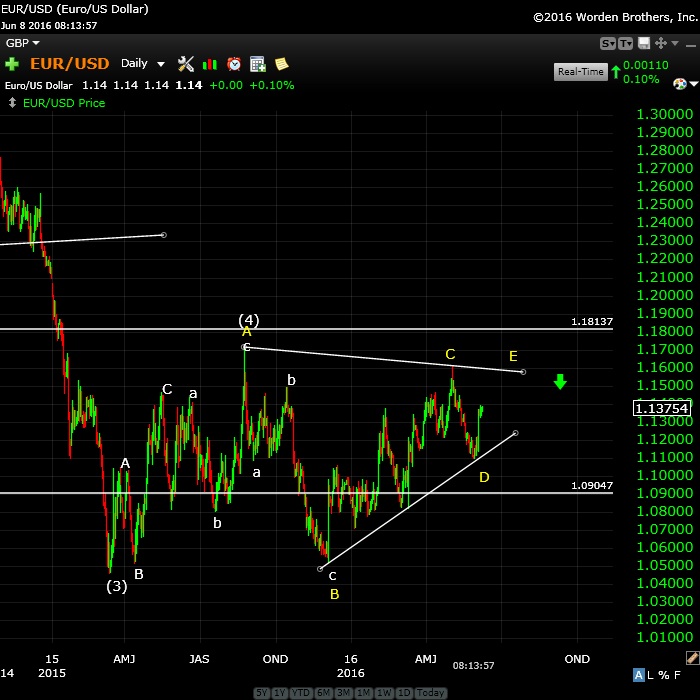
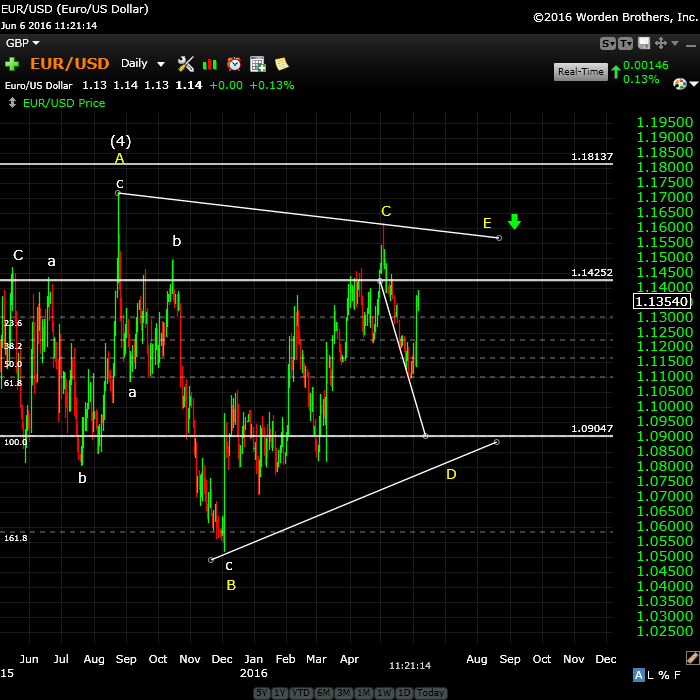
Above is the daily chart of EURUSD. There was no follow-through yet again yesterday, so I think the Friday labor report was a major turning point in the currencies. I’ve now tightened the triangle. I think we may be seeing the E wave taking shape. The ultimate top would be a test of the E point on the chart. If we turn down from here, then something else is happening.
However, if we continue up to the E point, it would support a major market turn for currencies and equities.
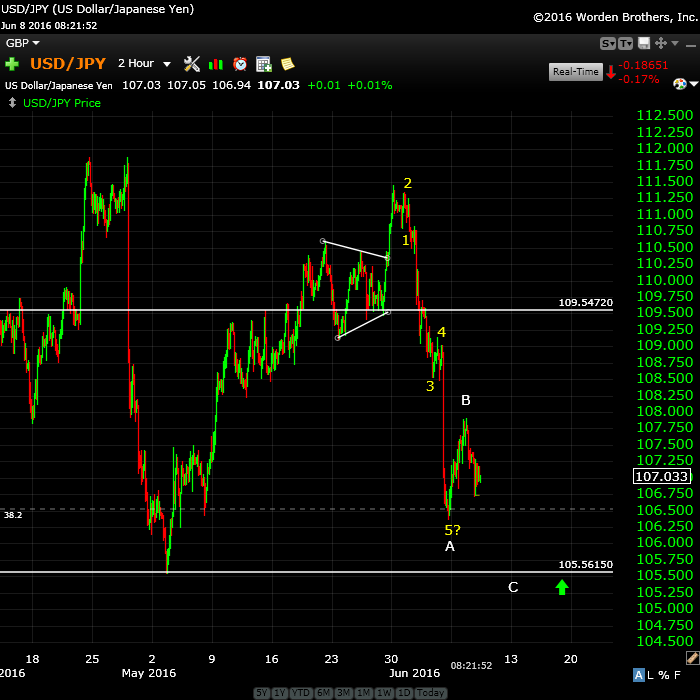
Above is the two hour chart of USDJPY. There has been no follow-though from this pair. I was expecting a move to a second wave (horizontal line at 109.54) which would have been the entry for a large final wave down to new lows. However, the labor report again seems to have changed the projection.
I’m now expecting to see a small drop to somewhere around the 105.56 area before a turn up into a large 5th wave to an all time new high. This should coincide with a top in the US indices.
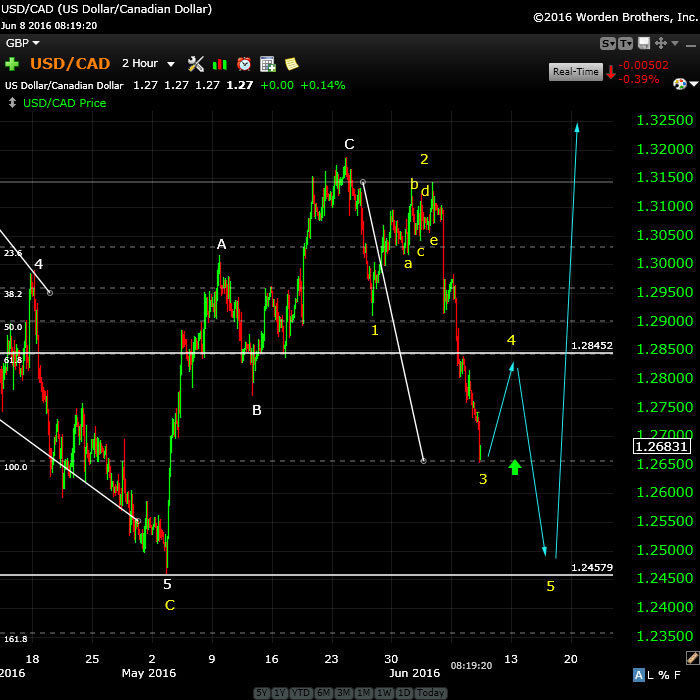
Above is a 2 hour chart of USDCAD, which has pulled the same reversal trick as the other currencies, based on the labour report last Friday. We’d complete a triangle the day before (yellow abcde), but after it completed, it reversed with the labor report. We look now to have done a 3rd wave, which passed the 62% retrace level last night (my line in the sand).
I’m not expecting to see a retrace to the previous 4th wave (1.2845) before a turn down for the final 5th wave. The bottom of of the 5th wave is likely to hit the target at the US indices reverse.
___________________________
Update Monday, June 6: After the Close
We’re close to a top, but until we actually top, there’s not much to trade. The problem is that an ending diagonal is one of those patterns that has no rules, except that the waves have to overlap.
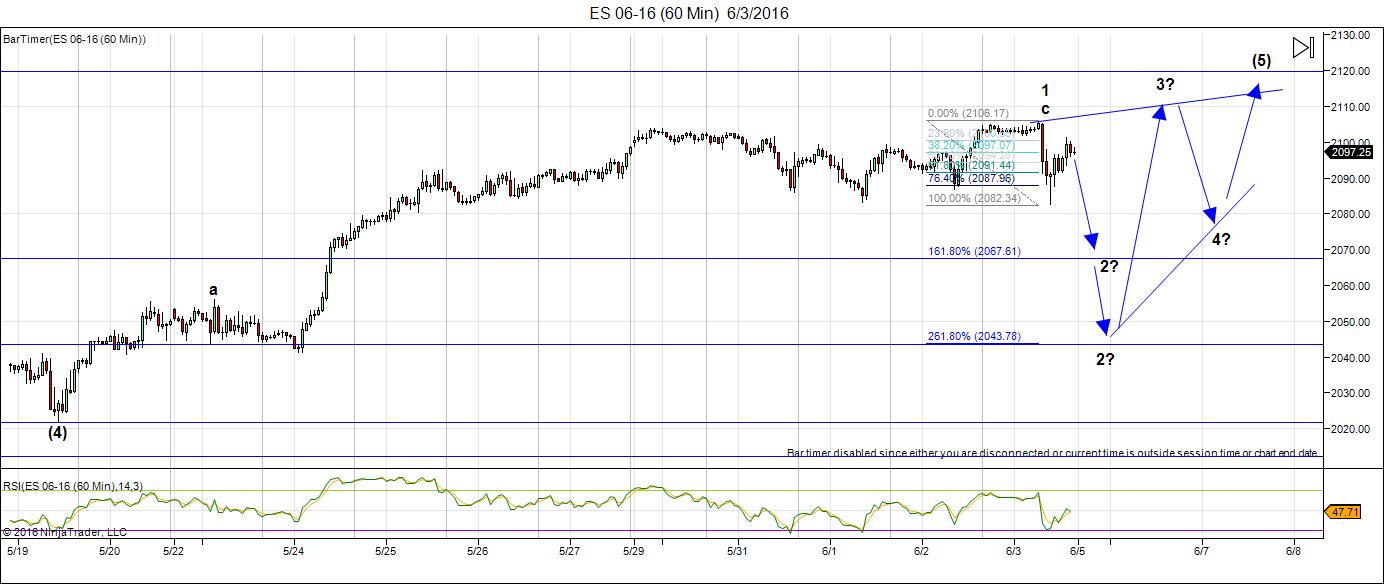
Above is the 60 minute chart of ES (emini SPX futures). The wave up is simply drifting and until the US dollar moves substantially, the indices won’t either. You can keep your eyes peeled on the EURUSD chart (below) for an idea of when we’ll see some action and the direction it will take.
I’ve placed arrows on the above chart to give an idea of what I’m expecting. The question marks are due to the fact that the market just isn’t giving any clues as the level of correction down to expect. It’s even possible to identify a first, second, and third wave of an ending diagonal already, but this market hasn’t corrected down enough for me to feel comfortable with that call.
Other than that, this is exactly what I’d expect close to a top. The market usually almost makes it and then backs off and takes another run at it.
The large first wave up is not impulsive (it’s corrective) so some sort of ending triangle is about the only option (as I keep saying).
Above is the daily chart of EURUSD. In my video on the weekend, I pointed out that this pair needed the B wave of the 3 wave sequence we’re currently tracing out (the yellow D wave) to rise just a little bit further before turning down. It hardly moved today and so the US indices just drifted (when the cat’s away, the mouse do play).
I’ve placed a horizontal line at the 62% retrace level (~1.14252), which I would expect it to tag before turning down.
When the EURUSD turns down, so should the US indices and that may happen tomorrow morning. This won’t denote a top, as we still have the E wave up to do (you can see this pattern playing out in reverse for the dollar).
In terms of USDCAD, the same situation is playing out. I’m expecting it to bottom at a 62% retrace level (~1.274) before turning back up.
This is a frustrating market. We’re moving within a very small range, rather evenly matched, so be very careful if you’re in it.
_______________________
Original Post: Sunday, June 5
The bulls are still in charge, but not for much longer.
We’re in the ending wave of a double-pronged second wave. The wave up from Feb. 11 is clearly corrective and very close to finishing up.
In an ending wave (a 5th wave of a pattern), you only have two options:
- a wave sequence in 5 waves (looking somewhat motive)
- a triangle pattern, which in an ending wave (a C or 5th wave) is an ending diagonal.
The first wave of the ending diagonal has already traced out from the previous 4th wave low. That wave isn’t a 5-waver, so the alternative is in play—an ending diagonal.
In this weekend’s video report, I take another look at the bigger picture with the NYSE, because it’s crazy to look at the sub-indices in isolation (the DOW, SP500, RUT, futures, etc.). They all have to do more or less the same thing and the NYSE is the ultimate determiner of market direction. Actually, it’s the US dollar that’s the real ultimate determinant of market direction, but within the stock market, the NYSE is the largest cap index (in the world, actually) and so it’s the one you have to pay attention to.
As I’ve mentioned here over and over again, the currencies and US market are becoming more and more tightly aligned. They’re all moving together as debt is being deleveraged. If you’re good at seeing patterns and mentally manipulating them, you can easily see them aligning and this helps you forecast the market moves.
It certainly won’t always be this way forever, but they’ve been moving closer and closer into alignment for the past couple of years. Now the moves are almost identical, from a technical analysis perspective.
Bottom line: The final high for the SP500 should be at or slightly above 2116. I’m looking at the June 16 (the next Federal Reserve announcement) as perhaps being the catalyst for a top. In the next week or so, I’ll repost the charts the the larger third wave down we’re expecting.
______________________________
Here’s a video overview of the market for Tuesday, June 5, 2016:
Market Report for June 6, 2016  |
 |
Make sure you zoom the video to full size with frame expander (arrows) in the bottom right hand corner and also set the quality to as high as your web connection allows. This is an HD quality video so the best viewing is at that level. |
_______________________________
The Charts Going into Monday
The US indices appear to be tracing out an ending diagonal. I expect us to head down in the C wave of the second wave on Monday.
Above is the 60 minute chart of ES showing the large wave up from this week and the projection for the balance of the ending diagonal.
I don’t know where the second will end, but it should be either at ~2067 or ~2043. These levels correspond to 1.618 and 12.618 X wave A.
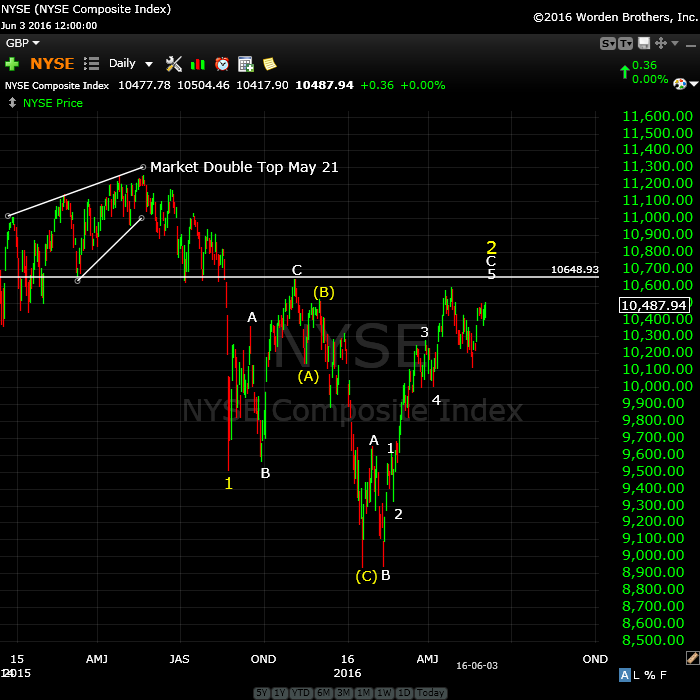
Above is the daily chart of NYSE (the largest cap index in the world) and the one we really need to pay attention to for the US market. It’s showing a very obvious 2nd wave pattern, with the most recent wave up being clearly corrective. We’re in the ending wave of the pattern and should top at the previous high at ~10648.
The next move down is a very large 3rd wave.
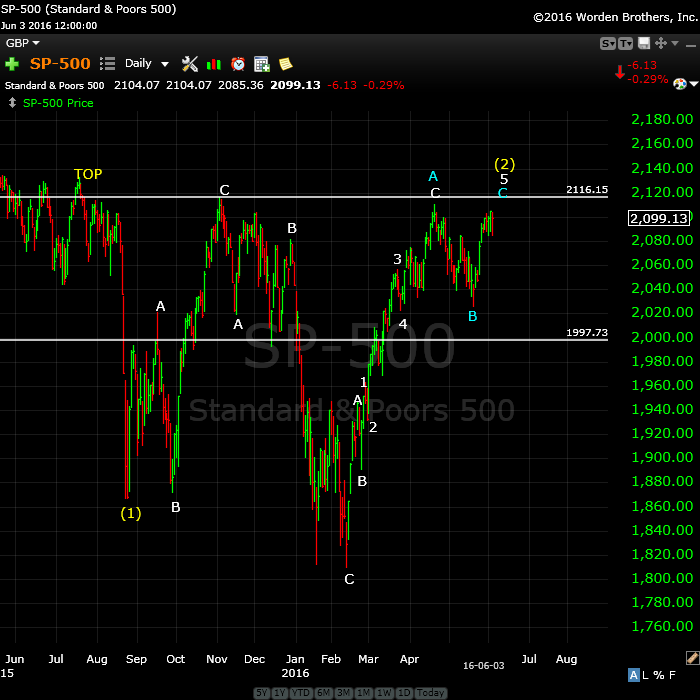
Above is a daily chart of SPX. This has a similar look to the NYSE, although more elevated. I’m expecting to see a top to this second wave at or just above 2116.
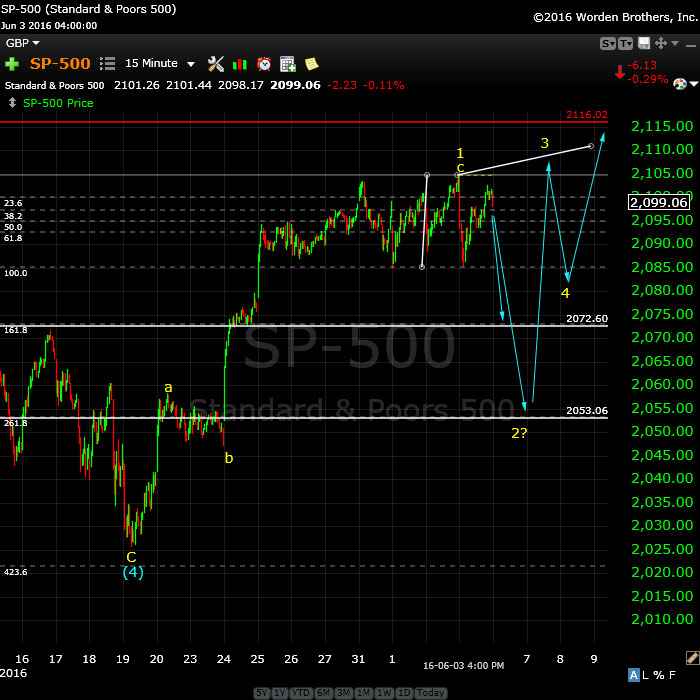
Above is the 15 minute chart of the SP500, showing a projected ending diagonal similar to ES. This isn’t much more to say about this chart, since is should more or less follow the path and timing of ES.
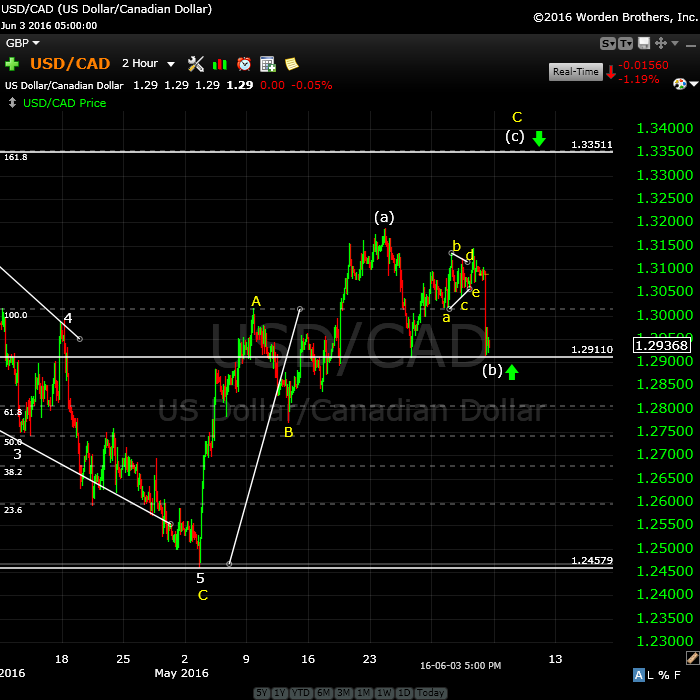
Above is the 2 hour chart of USDCAD. We haven’t really gone anywhere in the past couple of weeks. The target for this © wave is ~1.335, where is should turn and head back down to ~1.24579. We should bottom here (1.1911) as a double bottom before heading back up to the target.
The larger pattern down is an ABC corrective wave. It traced out an ending diagonal, which is complete at ~1.24579.
The euro, Australian dollar, dollar, and Canadian dollar are all tracing out similar patterns, pretty much in lock-step.
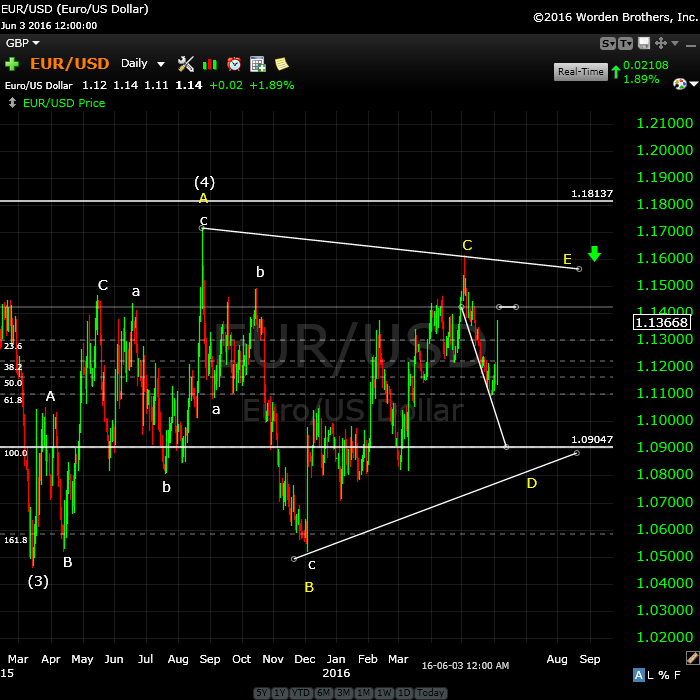
Here’s the daily hour chart of EURUSD showing the “4th wave” of the major corrective pattern we’ve been in since March, 2014. We’re in the final stages of a bearish triangle formation, with one more leg up after we finish this leg down.
On Friday, we traced out wave B in both the dollar and EURUSD. I predict a C wave down now to finish the (yellow) D wave. The target is ~1.09047. There may be just a little more upside in the B wave (short line at ~1.142 denotes the 62% retrace level) before turning either Sunday or Monday.
The chart as shown, with the (yellow) D target of ~1.09047 will produce a C wave of exactly the same length as the A wave. It would also project a total (yellow) D wave length of .618 X the (yellow) B wave length, which is a normal relationship between the B and D waves of a triangle.
EURUSD should turn down after finishing the E wave in tandem with the US equities.
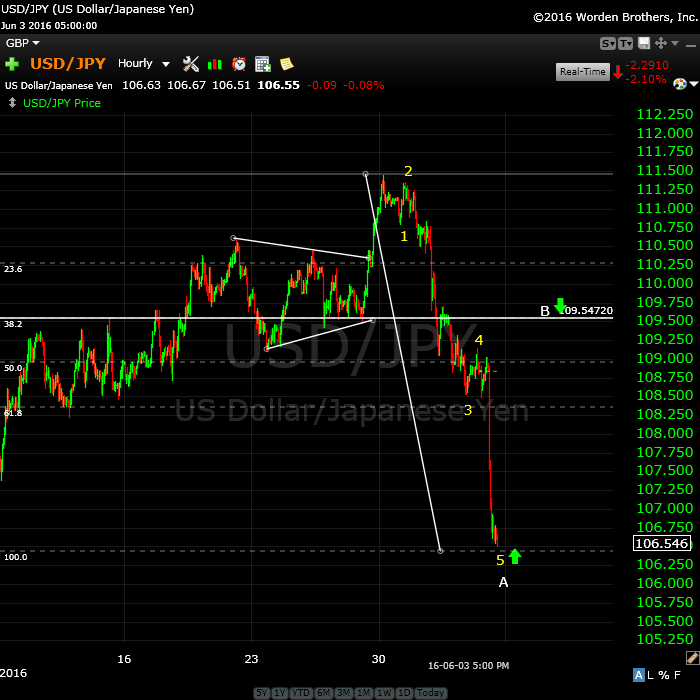
Above is the hourly chart of the USDJPY, which I’ve been stalking for the past week or so. It’s finished one wave down (in five waves) which makes this an A wave.
The preferred entry is at the second wave top (~109.54), shown in the chart as the B target, which is a 62% retrace of the A wave.
The ultimate target for the C wave is either 100.58 or 94.63 (preferred).
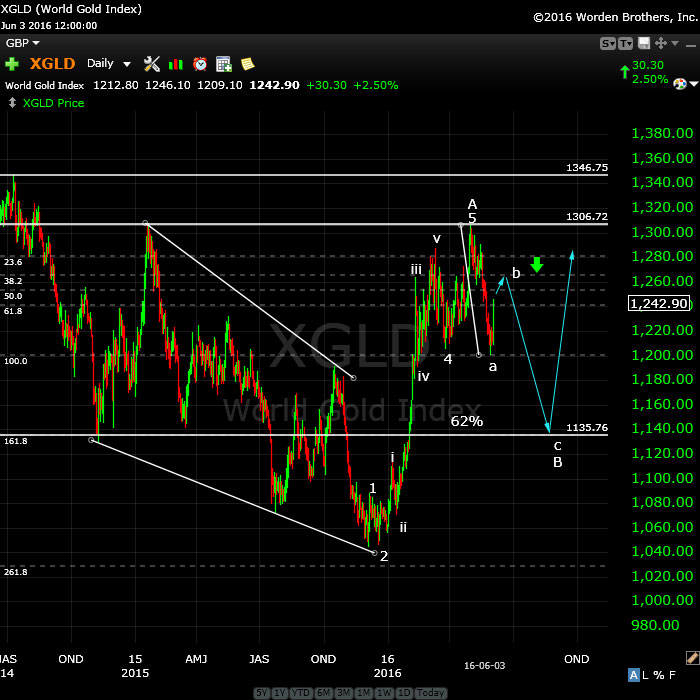
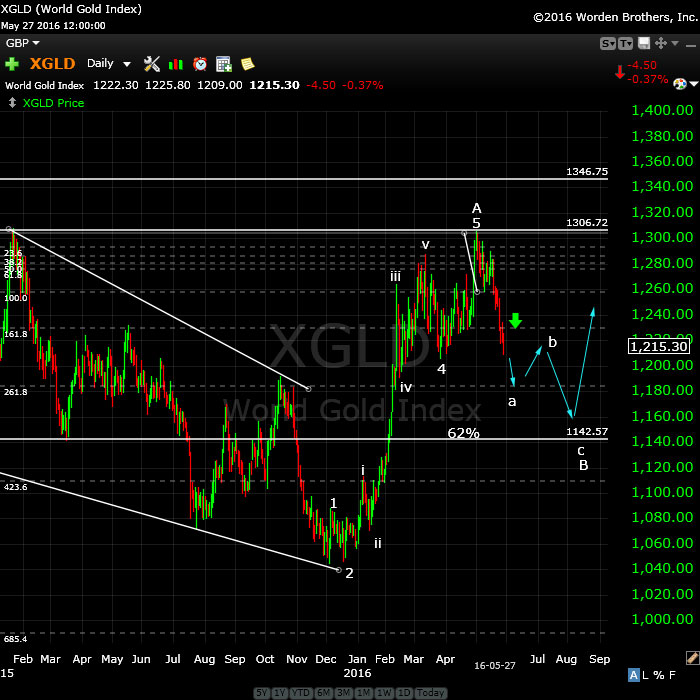
Above is the daily chart of XGLD (gold). It continues to follow the path I laid out at the beginning of 2016. We look like we have a little more upside before turning down in the (small) c wave to ~1135.76.
________________________
First Wave Down – What to Watch For
This weekend we’re dangerously close to a top of a second wave (in the fifth of the fifth, with an ending diagonal pattern).
What we’re looking for to confirm a turn is a motive wave down in 5 waves at small degree. After that, we should get a second wave that will retrace up in 3 waves about 62%. That’s the preferred EW entry point. So don’t feel you have to rush in. There’ll be a much better opportunity at the second wave level than at the top and the risk is substantially reduced.
__________________________
History: The 1929 crash
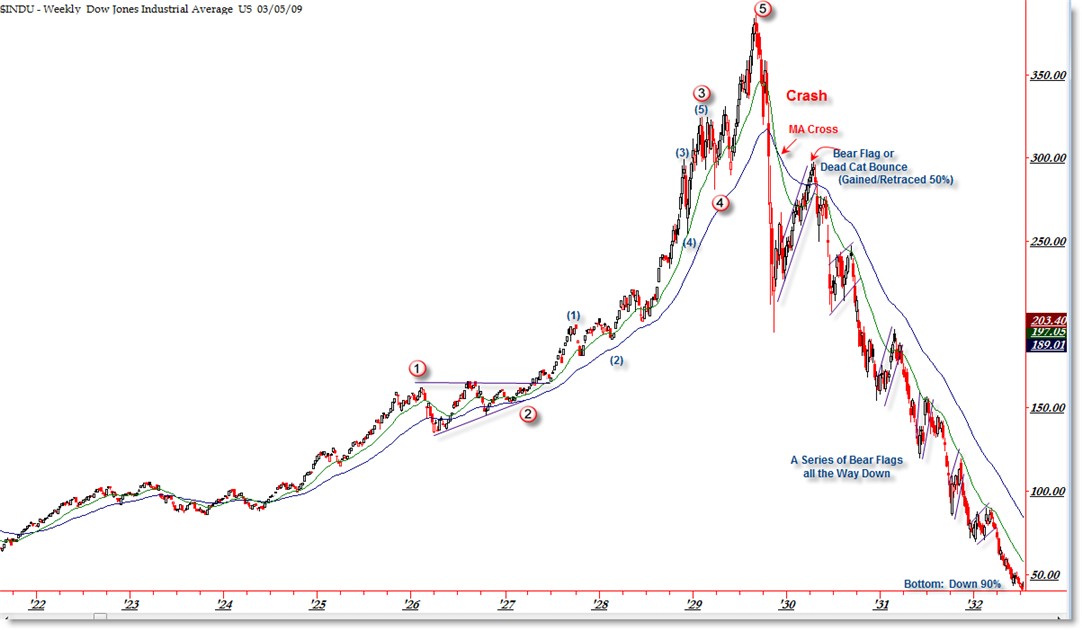
I think it’s important to look at 1929 and the wave structure (above and below), which was the same as 2007—to a point. I will show the 2007 crash below in the “What If” section.
The wave structure of the 1929 crash was in 3 waves overall. There were 5 waves down from the top (the A wave) and then a very large B wave retrace. The final C wave down was a stair-step affair and lasted over 2 years.
Let’s look a little close at the timing of the 1929 crash because the similarities to today are uncanny.
The market peaked on September 3, 1929 and then it took 2 months for the crash to actually happen (to reach the bottom of wave 5 of the A wave). The larger crash which we always hear about began on October 23, 1929. Then there was that large B wave, which lasted 5 and a half months and finally (which I explain a little further in the cycles section below), the C wave which went on for more than 2 years. This might be the scenario we’re looking at going forward.


New post: https://worldcyclesinstitute.com/the-top-of-two/
This website is for educational purposes relating to Elliott Wave, natural cycles, and the Quantum Revolution (Great Awakening). I welcome questions or comments about any of these subjects. Due to a heavy schedule, I may not have the time to answer questions that relate to my area of expertise.
I reserve the right to remove any comment that is deemed negative, is unhelpful, or off-topic. Such comments may be removed.
Want to comment? You need to be logged in to comment. You can register here.