Update Friday, June 10, 10:30 AM EST
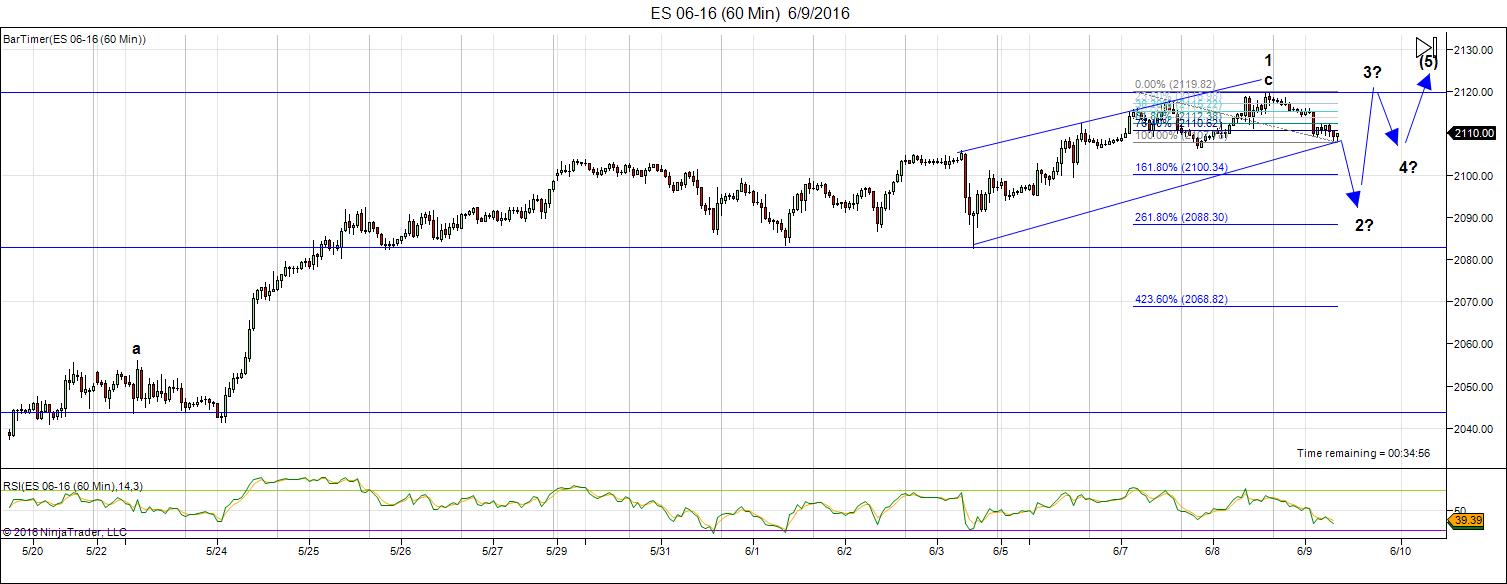
Above is the 60 minute chart of ES (emini SPX futures). I’m showing the possible expanding ending diagonal. The final wave would be go up in three waves past the upper trendline (the throw-over) before turning down for good. I’ll post the alternate converging ending diagonal on the weekend. The result will be the same, either way.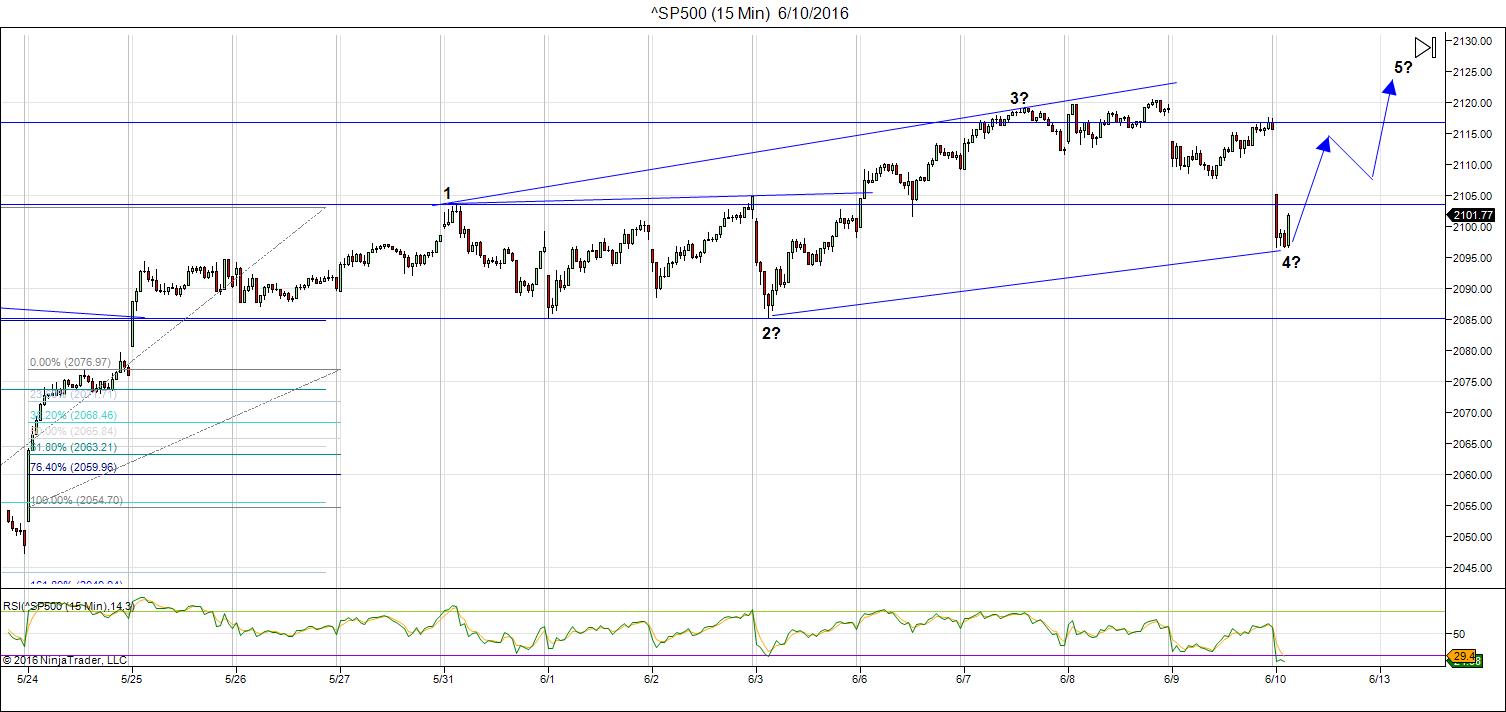
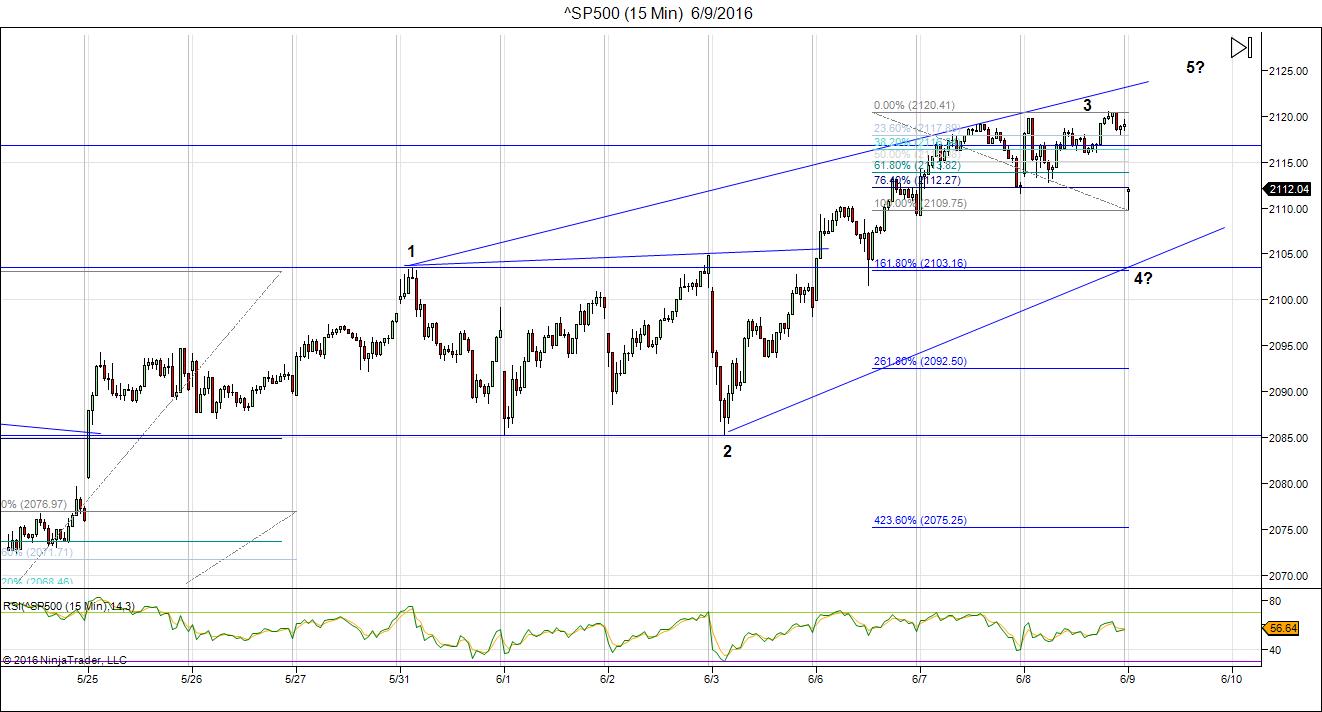
Above is the 15 minute chart of the SP500 showing a similar pattern. The alternate would have us at the the bottom of the second wave now, with 3, 4, 5 still to go.
________________________
Update Thursday, June 9, Before the Open
Above is the 60 minute chart of ES (emini SPX futures). We came down in what looks like at A wave overnight. Expect a B wave and then a C wave down. I’m marked some likely targets. EURUSD came down in an A wave, so expect the same thing there. You can let this be your guide. Currencies are tracing out my latest projection.
This is shaping up to give me what I’ve been expecting—a more traditional ending diagonal. I’ve drawn a possible path above. After this wave down (wave 2 of the ending diagonal?), I’d expect one more wave up in three waves.
I’m still focused on Yellen and June 15 for a major turn.
Above is a 15 minute chart of the SP500 showing the same potential ending diagonal tracing out. I would expect a B wave up now, then a C down to complete the 4th wave, leaving one more wave up to a final top.
_______________________
Update Wednesday, June 8, Before the Open
NOTE: I have changed my short-term prediction on US currency pairs. The labor report on Friday seems to have completely changed sentiment and I see all US currency pairs finishing up now.
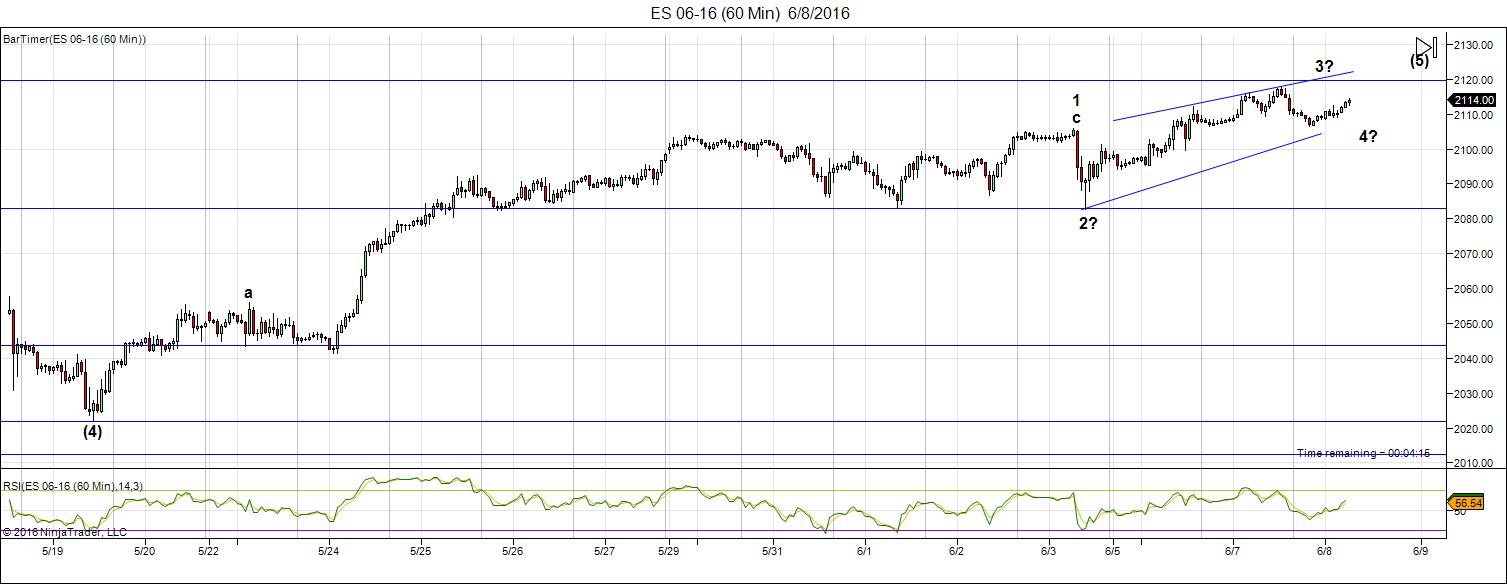
Above is the 60 minute chart of ES (emini SPX futures). Yesterday’s action seems to be confirming that the ending diagonal is going to be very shallow (which is somewhat unexpected, but nothing wrong with it). We may have another short leg down, hard to say. My take on this is that the 5th wave of the ending diagonal is close to beginning (if not already).
However, we could still drop and trace out a larger ending diagonal—we’ll just have to see what happens. I’m somewhat unconvinced by the shape of the current pattern I’ve drawn, although a larger pattern won’t change the eventual outcome.
This final wave should move above the top up-sloping trendline (the throw-over). I have no target for the ending diagonal. These patterns stop when they stop. However, I do not expect a new all time high. I suspect we won’t see a whole lot of movement in the next few days leading up to the June 15 Fed announcement.
The currencies are supporting the fact that an end is near. I will post a couple of charts for currencies shortly.
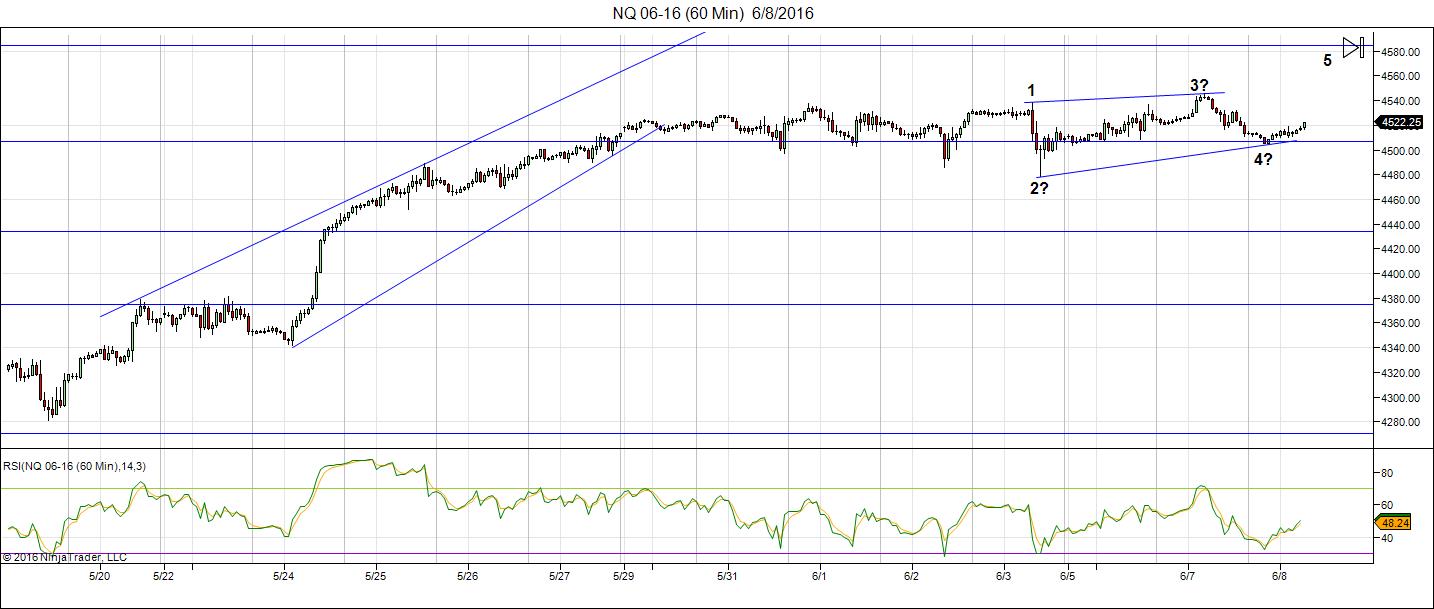
Above is a 60 minute chart of NQ (emini Nasdaq futures). It’s the same story here. A very shallow ending diagonal seems to be taking shape. The prognosis is the same as ES. In the cash indices, I’m seeing much sharper patterns, with the same prognosis.
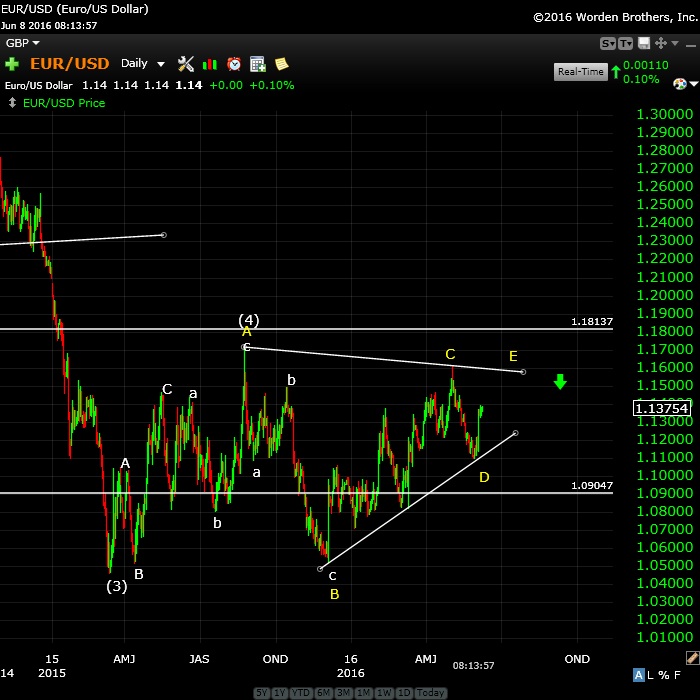
Above is the daily chart of EURUSD. There was no follow-through yet again yesterday, so I think the Friday labor report was a major turning point in the currencies. I’ve now tightened the triangle. I think we may be seeing the E wave taking shape. The ultimate top would be a test of the E point on the chart. If we turn down from here, then something else is happening.
However, if we continue up to the E point, it would support a major market turn for currencies and equities.
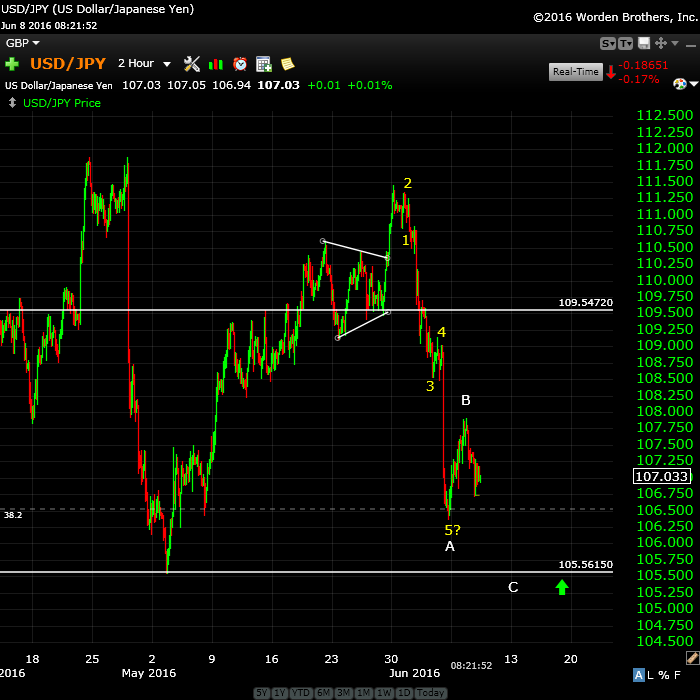
Above is the two hour chart of USDJPY. There has been no follow-though from this pair. I was expecting a move to a second wave (horizontal line at 109.54) which would have been the entry for a large final wave down to new lows. However, the labor report again seems to have changed the projection.
I’m now expecting to see a small drop to somewhere around the 105.56 area before a turn up into a large 5th wave to an all time new high. This should coincide with a top in the US indices.
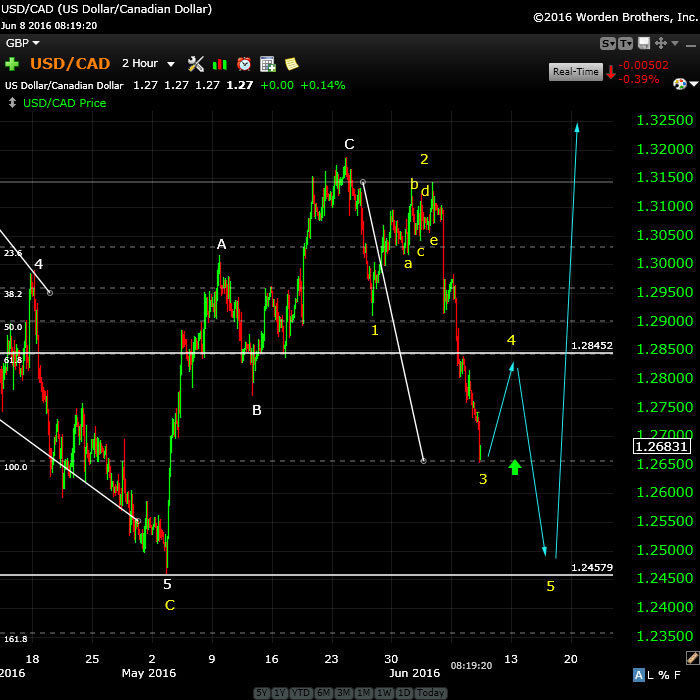
Above is a 2 hour chart of USDCAD, which has pulled the same reversal trick as the other currencies, based on the labour report last Friday. We’d complete a triangle the day before (yellow abcde), but after it completed, it reversed with the labor report. We look now to have done a 3rd wave, which passed the 62% retrace level last night (my line in the sand).
I’m not expecting to see a retrace to the previous 4th wave (1.2845) before a turn down for the final 5th wave. The bottom of of the 5th wave is likely to hit the target at the US indices reverse.
___________________________
Update Monday, June 6: After the Close
We’re close to a top, but until we actually top, there’s not much to trade. The problem is that an ending diagonal is one of those patterns that has no rules, except that the waves have to overlap.
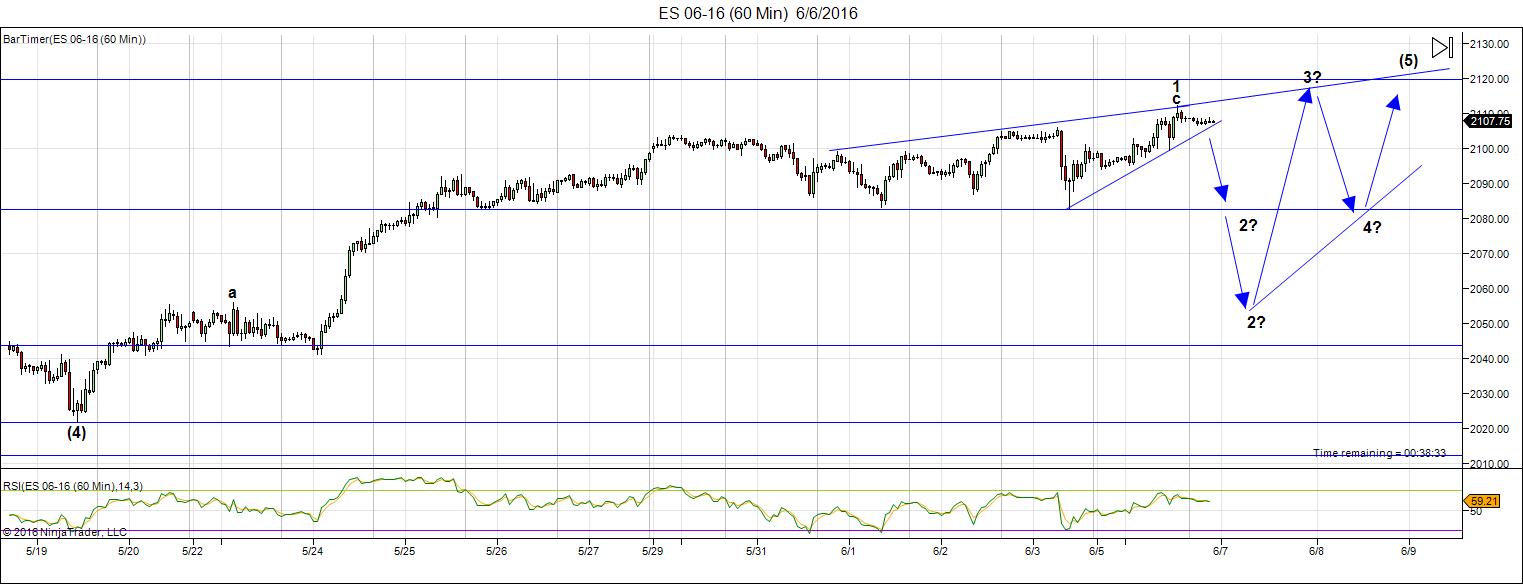
Above is the 60 minute chart of ES (emini SPX futures). The wave up is simply drifting and until the US dollar moves substantially, the indices won’t either. You can keep your eyes peeled on the EURUSD chart (below) for an idea of when we’ll see some action and the direction it will take.
I’ve placed arrows on the above chart to give an idea of what I’m expecting. The question marks are due to the fact that the market just isn’t giving any clues as the level of correction down to expect. It’s even possible to identify a first, second, and third wave of an ending diagonal already, but this market hasn’t corrected down enough for me to feel comfortable with that call.
Other than that, this is exactly what I’d expect close to a top. The market usually almost makes it and then backs off and takes another run at it.
The large first wave up is not impulsive (it’s corrective) so some sort of ending triangle is about the only option (as I keep saying).
Above is the daily chart of EURUSD. In my video on the weekend, I pointed out that this pair needed the B wave of the 3 wave sequence we’re currently tracing out (the yellow D wave) to rise just a little bit further before turning down. It hardly moved today and so the US indices just drifted (when the cat’s away, the mouse do play).
I’ve placed a horizontal line at the 62% retrace level (~1.14252), which I would expect it to tag before turning down.
When the EURUSD turns down, so should the US indices and that may happen tomorrow morning. This won’t denote a top, as we still have the E wave up to do (you can see this pattern playing out in reverse for the dollar).
In terms of USDCAD, the same situation is playing out. I’m expecting it to bottom at a 62% retrace level (~1.274) before turning back up.
This is a frustrating market. We’re moving within a very small range, rather evenly matched, so be very careful if you’re in it.
_______________________
Original Post: Sunday, June 5
The bulls are still in charge, but not for much longer.
We’re in the ending wave of a double-pronged second wave. The wave up from Feb. 11 is clearly corrective and very close to finishing up.
In an ending wave (a 5th wave of a pattern), you only have two options:
- a wave sequence in 5 waves (looking somewhat motive)
- a triangle pattern, which in an ending wave (a C or 5th wave) is an ending diagonal.
The first wave of the ending diagonal has already traced out from the previous 4th wave low. That wave isn’t a 5-waver, so the alternative is in play—an ending diagonal.
In this weekend’s video report, I take another look at the bigger picture with the NYSE, because it’s crazy to look at the sub-indices in isolation (the DOW, SP500, RUT, futures, etc.). They all have to do more or less the same thing and the NYSE is the ultimate determiner of market direction. Actually, it’s the US dollar that’s the real ultimate determinant of market direction, but within the stock market, the NYSE is the largest cap index (in the world, actually) and so it’s the one you have to pay attention to.
As I’ve mentioned here over and over again, the currencies and US market are becoming more and more tightly aligned. They’re all moving together as debt is being deleveraged. If you’re good at seeing patterns and mentally manipulating them, you can easily see them aligning and this helps you forecast the market moves.
It certainly won’t always be this way forever, but they’ve been moving closer and closer into alignment for the past couple of years. Now the moves are almost identical, from a technical analysis perspective.
Bottom line: The final high for the SP500 should be at or slightly above 2116. I’m looking at the June 16 (the next Federal Reserve announcement) as perhaps being the catalyst for a top. In the next week or so, I’ll repost the charts the the larger third wave down we’re expecting.
______________________________
Here’s a video overview of the market for Tuesday, June 5, 2016:
Market Report for June 6, 2016 |
_______________________________
The Charts Going into Monday
The US indices appear to be tracing out an ending diagonal. I expect us to head down in the C wave of the second wave on Monday.
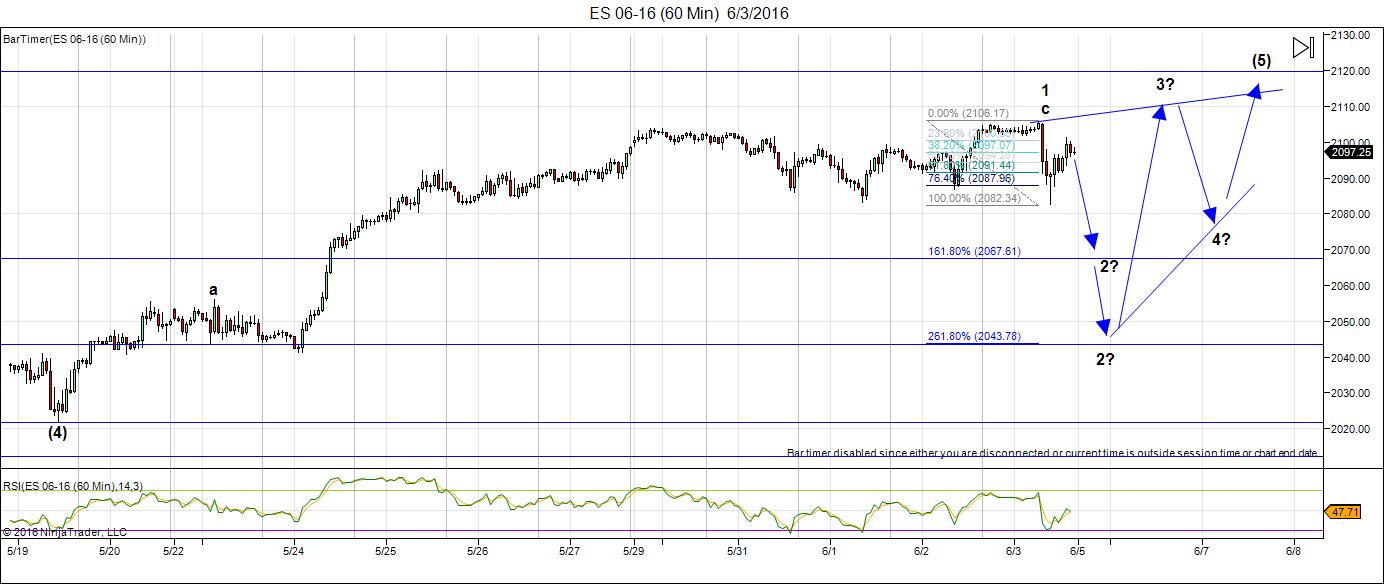
Above is the 60 minute chart of ES showing the large wave up from this week and the projection for the balance of the ending diagonal.
I don’t know where the second will end, but it should be either at ~2067 or ~2043. These levels correspond to 1.618 and 12.618 X wave A.
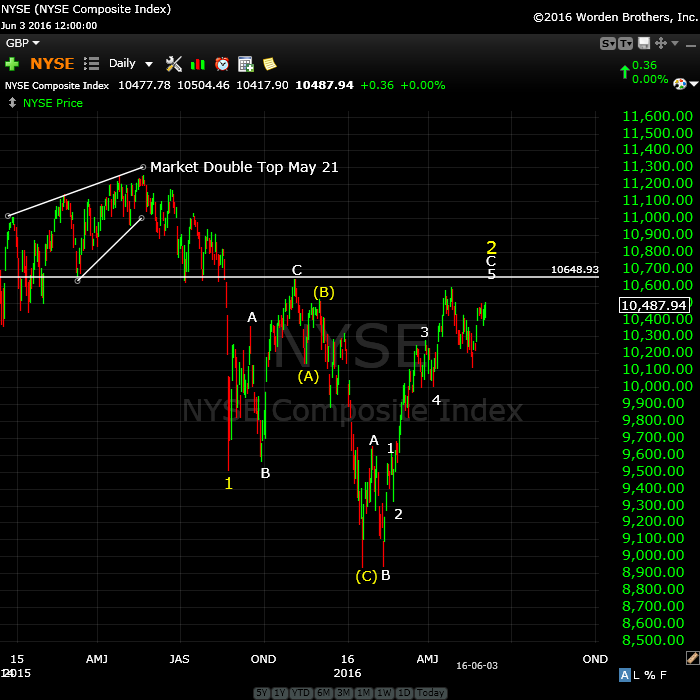
Above is the daily chart of NYSE (the largest cap index in the world) and the one we really need to pay attention to for the US market. It’s showing a very obvious 2nd wave pattern, with the most recent wave up being clearly corrective. We’re in the ending wave of the pattern and should top at the previous high at ~10648.
The next move down is a very large 3rd wave.
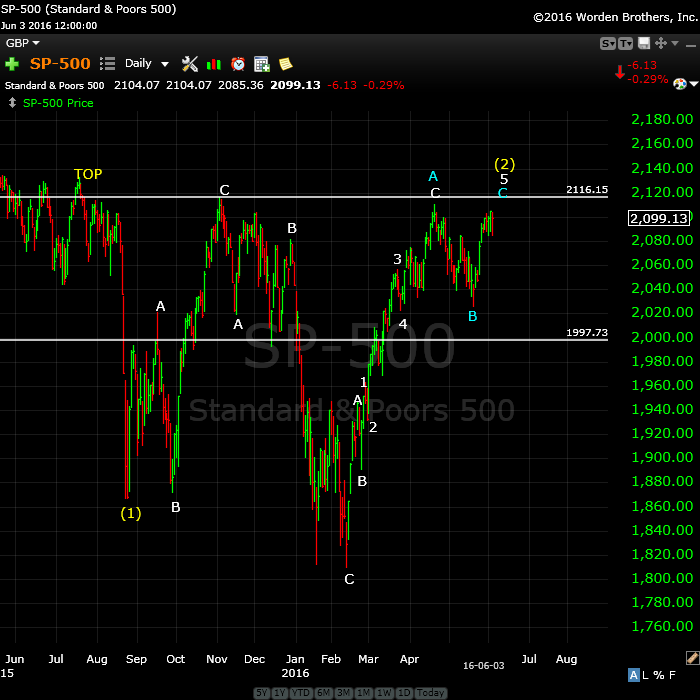
Above is a daily chart of SPX. This has a similar look to the NYSE, although more elevated. I’m expecting to see a top to this second wave at or just above 2116.
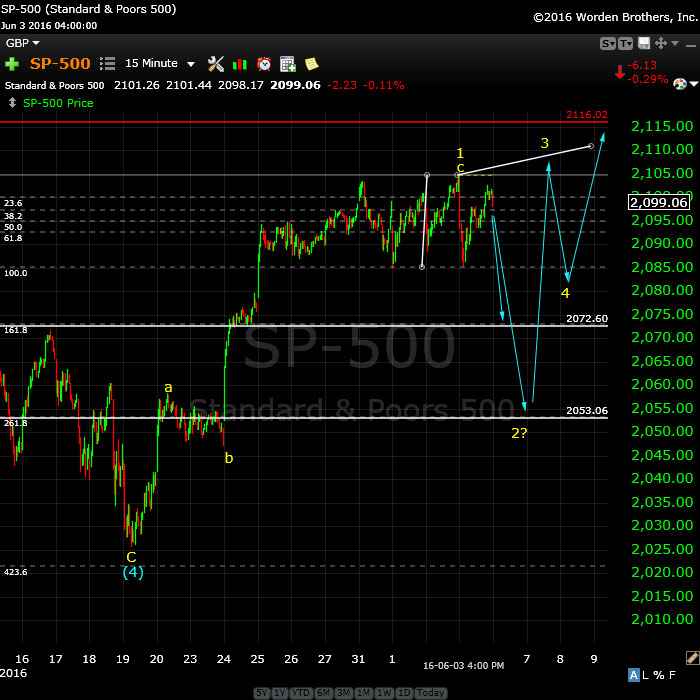
Above is the 15 minute chart of the SP500, showing a projected ending diagonal similar to ES. This isn’t much more to say about this chart, since is should more or less follow the path and timing of ES.
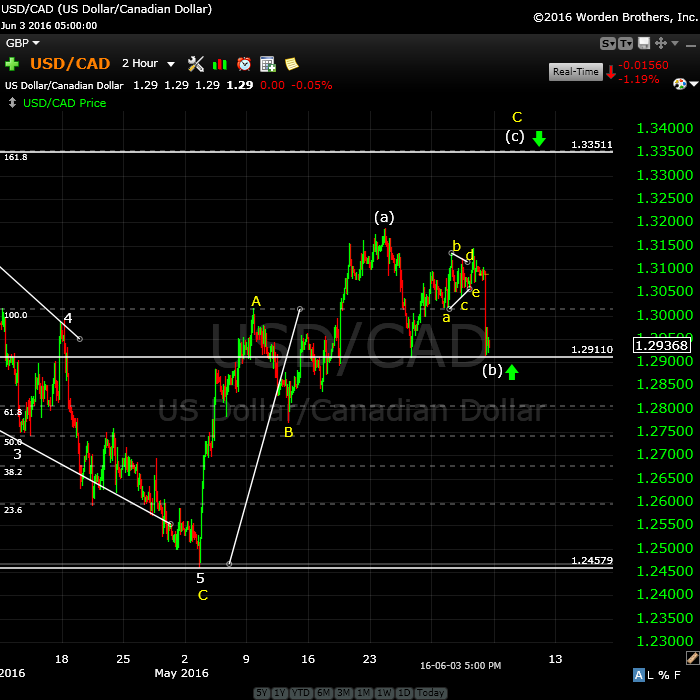
Above is the 2 hour chart of USDCAD. We haven’t really gone anywhere in the past couple of weeks. The target for this © wave is ~1.335, where is should turn and head back down to ~1.24579. We should bottom here (1.1911) as a double bottom before heading back up to the target.
The larger pattern down is an ABC corrective wave. It traced out an ending diagonal, which is complete at ~1.24579.
The euro, Australian dollar, dollar, and Canadian dollar are all tracing out similar patterns, pretty much in lock-step.
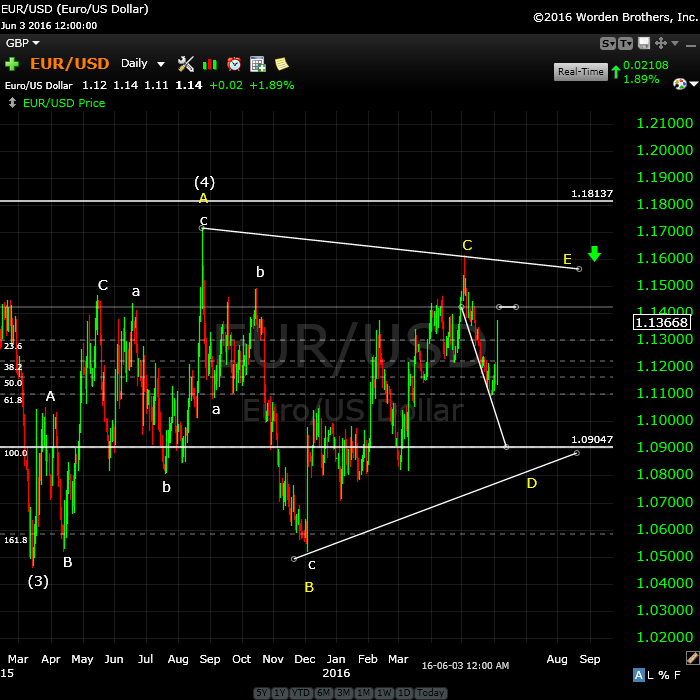
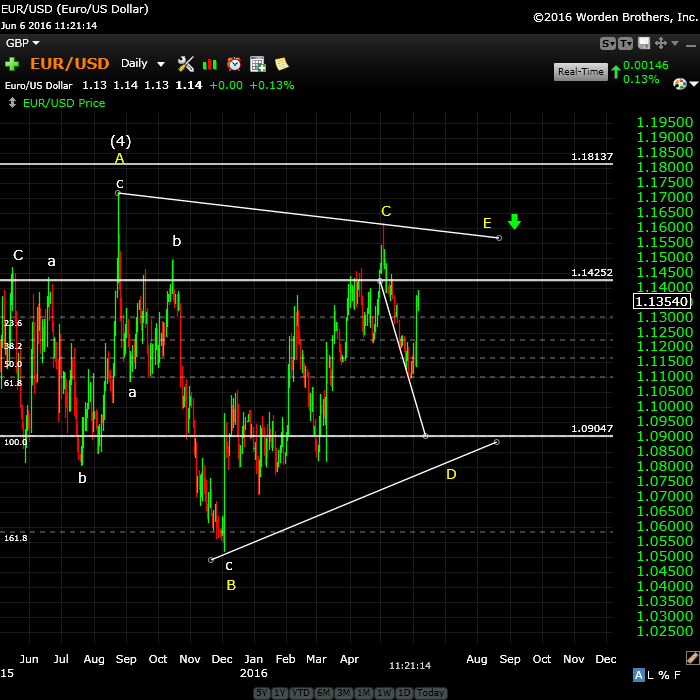
Here’s the daily hour chart of EURUSD showing the “4th wave” of the major corrective pattern we’ve been in since March, 2014. We’re in the final stages of a bearish triangle formation, with one more leg up after we finish this leg down.
On Friday, we traced out wave B in both the dollar and EURUSD. I predict a C wave down now to finish the (yellow) D wave. The target is ~1.09047. There may be just a little more upside in the B wave (short line at ~1.142 denotes the 62% retrace level) before turning either Sunday or Monday.
The chart as shown, with the (yellow) D target of ~1.09047 will produce a C wave of exactly the same length as the A wave. It would also project a total (yellow) D wave length of .618 X the (yellow) B wave length, which is a normal relationship between the B and D waves of a triangle.
EURUSD should turn down after finishing the E wave in tandem with the US equities.
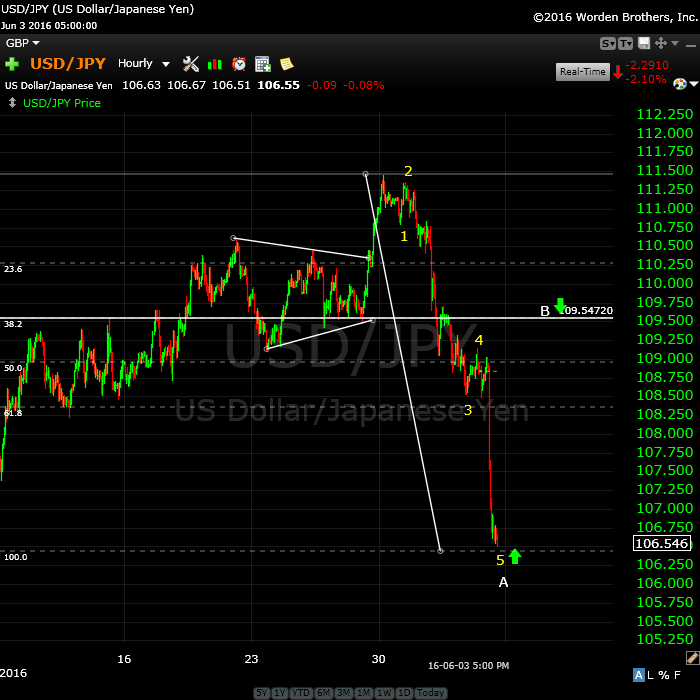
Above is the hourly chart of the USDJPY, which I’ve been stalking for the past week or so. It’s finished one wave down (in five waves) which makes this an A wave.
The preferred entry is at the second wave top (~109.54), shown in the chart as the B target, which is a 62% retrace of the A wave.
The ultimate target for the C wave is either 100.58 or 94.63 (preferred).
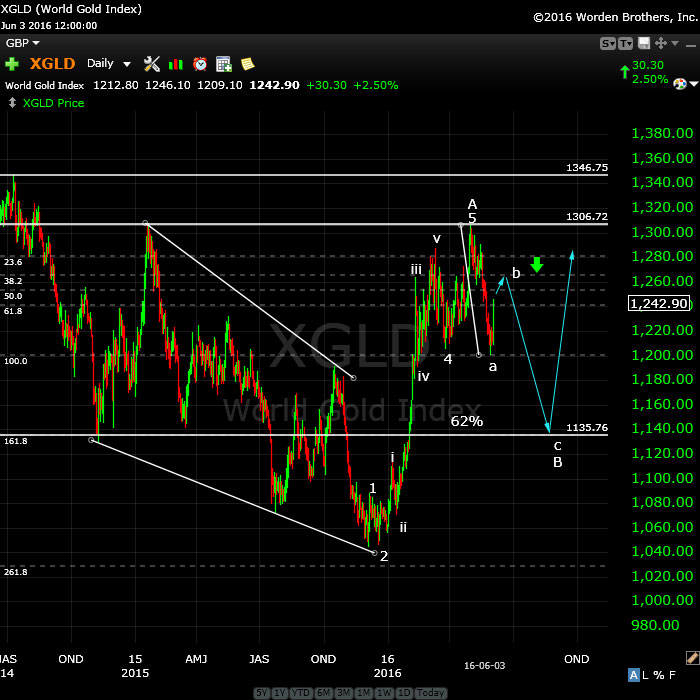
Above is the daily chart of XGLD (gold). It continues to follow the path I laid out at the beginning of 2016. We look like we have a little more upside before turning down in the (small) c wave to ~1135.76.
________________________
First Wave Down – What to Watch For
This weekend we’re dangerously close to a top of a second wave (in the fifth of the fifth, with an ending diagonal pattern).
What we’re looking for to confirm a turn is a motive wave down in 5 waves at small degree. After that, we should get a second wave that will retrace up in 3 waves about 62%. That’s the preferred EW entry point. So don’t feel you have to rush in. There’ll be a much better opportunity at the second wave level than at the top and the risk is substantially reduced.
__________________________
History: The 1929 crash
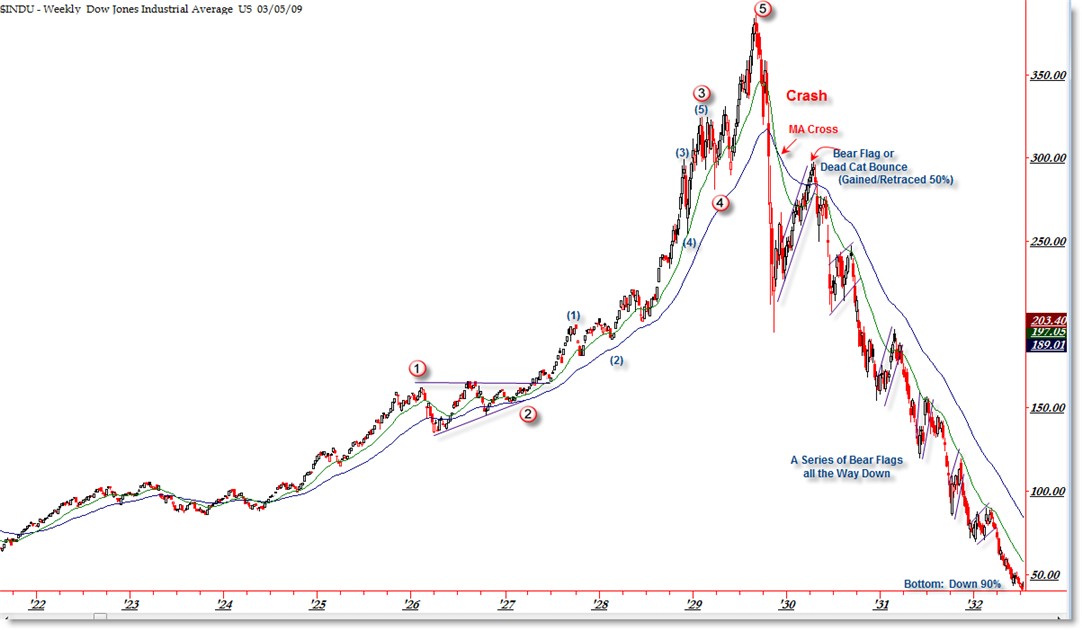
I think it’s important to look at 1929 and the wave structure (above and below), which was the same as 2007—to a point. I will show the 2007 crash below in the “What If” section.
The wave structure of the 1929 crash was in 3 waves overall. There were 5 waves down from the top (the A wave) and then a very large B wave retrace. The final C wave down was a stair-step affair and lasted over 2 years.
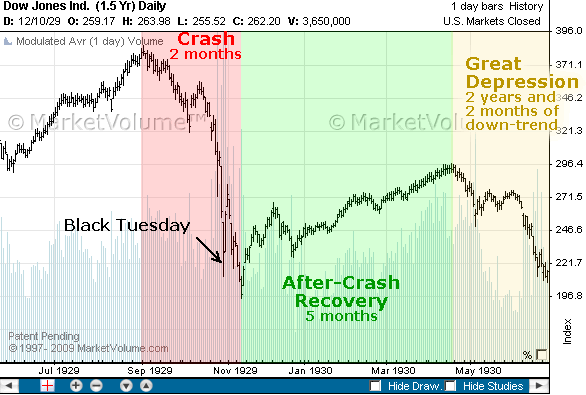
Let’s look a little close at the timing of the 1929 crash because the similarities to today are uncanny.
The market peaked on September 3, 1929 and then it took 2 months for the crash to actually happen (to reach the bottom of wave 5 of the A wave). The larger crash which we always hear about began on October 23, 1929. Then there was that large B wave, which lasted 5 and a half months and finally (which I explain a little further in the cycles section below), the C wave which went on for more than 2 years. This might be the scenario we’re looking at going forward.




First post! Thanks Peter Temple for Worldcyclesinstitute.com. Really enjoy reading your posts and learning Elliot Wave.
Haha … don’t know if that’s a good thing or not! Thks.
Peter thanks for insightful post. Have reading craziness. Of 2250. 2500. Etc other places and decided to ignore for now onwards
Terrific insight Peter..loving your insight on the currencies and the markets..I’m wondering where the bonds
10 year 30 year fit into your puzzle?
They should continue up. We’re going to see a lot of defaults going forward and they’ll become much riskier assets.
Any thoughts on how quickly the 3rd wave will bottom out or is it near impossible to know? For example it has taken us about 4 months from Feb low to hopefully June high. Could we expect wave 3 to end in months as well?
Don’t know at the moment. I’d say at least twice that time.
Thank you. That was what I was expecting. We start heading down later this month/possibly next month and then it’s a downturn into US elections and into 2017…. Does the continued up pattern today affect the ending diagonal? It seems to be off now.
Peter, i was a bit surprised to hear an estimate, albeit off the cuff, that wave 3 down would be double wave 2 which in this case would be 8 months – per se. This would seem to argue against a 1929 styled move and would be a much slower mover. I’d appreciate any additional thoughts. as always, thanks for your work.
I’m considering waves 3/4/5 together as wave 5 will likely end up only slightly below 3.
In 1929, the first leg down was 146 points in the DOW, which took about 4 months. This time, the same leg down has to go 10,000 points, top to bottom. That’s 69 times the distance in 1929, so I don’t know why you think that’s slow. It still has to do quite a few second and fourth waves on the way, so that will almost double the distance.
In 2007 – 09, it took almost 11 months to come down 7,000 points in waves 3,4.5 and most people thought that was fairly fast.
Wave 3 will likely be 2.618 X wave 1, not 2. Then wave 4 retraces 38% and we have another leg down of 1.618 X wave 1.
It looks like bottom are faster. Jan low and retest in feb. But this taken almost 5 months
Hi Peter. I submitted an email the email you have listed in the “Contact Us” tab @ inquiries@worldcyclesinsitute.com and email failure delivery message. Do you have a more updated email?
Jamba,
It should work. You spelled it incorrectly, so I’d try that first: institute.
I fact, jemba, I spelled it incorrectly on the contact us page, so my apologies. It’s fixed now.
Hi Peter, With futures continuing to go quite higher this morning, do you see a change in your forecast of a downturn?
It’s just melting up on low vols.
May hit the target today
ending expanding diagonal?
spy makes a new all time high….
Advance Get has us in a wave 5 rally. Either way next big move is down.
I have 2130 Spx Target
4.94% model has us topping.
Jerry
I wish you had a grey back ground,I can’t see the charts well.
Jerry, do u think 1820 or 1750 by mid june-mid july
NOT a chance !!
We seem to have skipped waves 2,3,4 and gone straight for 5. We are either close to a top or a big breakout I feel.
It looks like the Bulls are still in control. The markets continue to melt up with nothing to bring them back down. We are probably going to at least 2200-2400.
Would that be a truncation? Or is there another pattern for this to get to 2,400?
Bill we just need everyone to think that too and that should mark the top.
George Lindsay looked for important tops to fall into a B-B-T pattern, especially when there was more than one forming simultaneously. That’s exactly what happened today.First pattern: Bottoms of 2-2-15 to 10-2-15 were 169 trading days apart. Add 169 to 10-2-15 and it takes you to today, June 6. Even longer pattern: Bottoms of 10-4-11 and 2-5-14 were 587 trading days apart. Add 587 to 2-5-14 and it also takes you to today, June 6. Good reason to look at today as a potentially important top, but no money back guarantees, of course… 🙂
Thanks for sharing this interesting info 🙂 !
SPX may have topped -jobjas.wordpress.com
My prognosis hasn’t changed at all. I mentioned in my video that EURUSD has a little bit more to go (same as US dollar) and it still hasn’t reached that target. Once it does (likely tonight), it will reverse and that should give us a leg down.
We certainly haven’t topped.
“Trade what you see, not what you think.”
Always great to hear your thoughts… I appreciate them over and over again. Thanks! 🙂
“Trade what you see, not what you think”.
That’s indeed great advice (I learned it from the best) 😀
Peter, are you still thinking the top in 2115-2020 area
Nothing’s changed.
I am talking about spx
I know what you are thinking and saying to yourself right now Peet… Hang in there my friend! 😉
Cheers,
W
I added a couple of charts at the top of the post.
Target is hit
They will do their best to go to a new high in order to trigger all the stops above SPX 2116 and to suck in a lot of people above 2135
I hope me to be wrong and Peter to be right
Dimitri,
The other issue is that I don’t have a cycle turn date nearby, so due to the patterns and that fact, I don’t see a top here. Yet.
peter,
if you look at the ES since 5/26 – i am seeing some kind of “megaphone” pattern on the 30 min time frame. it actually looks like a ‘baby’ fractal of the 2000/2007/current megaphone monthly pattern in the spx? ending diagonal of the “expanding” type – ie, expanding ending diagonal?
This is a single wave up so far, so no diagonal so far. I’ve gone over and over all the cash and futures indices …
USDCAD did as expected overnight, but EURUSD hasn’t moved all that much. I think it has a bit more upside as per my notes last night) I would expect it to start heading down today sometime, which should send the indices lower a bit. The dollar should do the same (in the other direction … up).
Futures are down a bit this morning. Expect a small 62% retrace before they head down (or I’m wrong). I won’t be around today except for the open.
Before we all get too excited about a top, remember that all the futures and indices have to get there … to the previous high. So the SP might tag the previous high, but if the NYSE isn’t there (as we’ve learned in the past), we don’t have a top yet.
Futures are still down on the day so far.
And that’s my last thought before I head out the door.
NYSE has missed only 25 points today at Europe close.
So, it has all the chances to hit its previous top at 10.648 tonight or tomorrow.
Well, NYSE has missed only 20 points yesterday.
So, maybe another attack today or it will draw the ending diagonal with the high before FED meeting.
Once we take out 2135 we should see a blow off top. +3% from there gets us to 2,200. With no rate hike in June nothing stands in way of market. Bulls are still in control until maybe July/Aug.
Its nice to see, some one who has not got their head in the sand.
Below is what I said few weeks ago … price today passed April high … and I think next stop will be May 2015 ATH if it does not stop there , then 2160 Final Stop .
=============================================================
AZ May 17, 2016, 12:37 am
SPX can rally up to 2094 without any damage to the monthly fork ( 2007 H , 2009 L , 2015 H ) .
If price exceed April high of this year , then SPX will not stop at 2116 but will test or even can exceed the ATH of May 2015 to reach the final high @ 2160.
Yes, I know that does not work with Peter’s count … but this is what I see … so for now let us hope price will not go higher than 2094.
===============================================================
AZ
You are doing a good job so far AZ. 😉
I am open to everything at this point AZ, just like you. 😉 Well, not everything, not the crazy numbers like 2400. 🙂
Cheers,
W
Whazzup
I agree with you I do not see number like 2400 … but as you know market is full of surprises .
I feel we might just take the May 2015 ATH by few points , and then we start a big correction . Could be the same what happened in Oct 2007 .
Regards
AZ
Hey AZ,
I think we won’t make a new ATH since this wave is corrective and should not surpass the top of tops. 😉 We are very near the top right now, I would say this Friday or Monday we get there.
Cheers,
W
That’s what I’m thinking too.
But this is the problem that everybody is convinced now that the market goes to the new highs.
Only few people like Peter suppose rally to stop somewhere here.
The “Greed” indicators are at there extremes.
Peter,
If you get time this evening can you provide an update on USD.JPY
Thanks
Sold my SPY position. Not expecting anything good on upside next two weeks. Next week Fed meeting and June 23 Brexit should restrain prices. Seasonally mid to late June to July 15 is exception to “sell in May” New Moon, Perigee, and North Declination have all recently passed, so next two weeks should have a bearish bent. So will buy if we get into 1950 level, otherwise will wait until June 23 Brexit vote for possible SPY purchase.
Hey Valley,
I agree with you that some bearish stuff should be coming in the weeks ahead until the beginning of July (bottom there).
Cheers,
W
Looking at currencies tonight, I’m going to neutral, with a bias towards all the US pairs finishing up. I think the labor report last Friday changed everything in currencies. I’ll attempt to post some charts this morning.
The currency pair that’s flashing red for me is USD/CAD, along with USDJPY. The latter, if it traces out a double bottom, will signal the next large move is up. USDCAD has not so far put in a double bottom at the 72% retrace level. That’s the last line in the sand for me, so it looks like it will do a fourth wave and move to a double bottom. This also means that EURUSD may be about to trace out the remainder of the E leg of the triangle.
I’m starting to see the long-awaited ending diagonal shaping up in US indices, although we may not get much of a drop, if true. Everything is signalling to me that we’re finishing up and a top for the whole bunch is at hand.
I’ve added a number of charts at the top of the post. I’m seeing a reversal in currencies (triggered by last Friday’s labor report) and this would support the US indices at a high.
Peter,
what can you say about the NYSE?
Is it almost done?
Yes. I’m also seeing an ending diagonal possibly taking shape there, too. We may still see a larger ending diagonal showing up in the other indices. Hard to say at the moment. Everything is very close to topping. Should all happen together.
I can’t wait to get back into a trending market. This countertrend stuff is “for the birds.” So hard to predict.
Normally I would say +1, but I seriously want to say ‘+1000’. This crappy market, I HAVE HAD ENOUGH OF IT! 🙂
Cheers,
W
I added a line to the post about this ending diagonal pattern possibly not being the final one. We could still drop and trace out a larger pattern. I’m somewhat unconvinced, based on the remaining time I think we have.
Peter,
NYSE has hit your target at 10.648 and immediately reversed
It looks to be in an ending diagonal, too. I think it finished wave three and we’re in four. I also think we’ll get double tops on most indices.
transports still rising
Rose,
I would expect transports to do a double top at ~8195, which is the 62% retrace level and will lead to a third wave down.
I will share an email I just got from David Dubyne at Adapt 2030. Found it interesting:
If you hadn’t seen the news, the Sun is in it’s 5th day of zero sunspots,
“spotless days” with this not expected for two more years in early 2018.
The spotless run continues for now with F10.7 flux staying the same, which
means the drop-off in solar activity is occurring faster than expected.
There is an incoming group that made a full rotation on the surface across
the backside of the Sun, this may break the spotless streak, but if these
spots dwindle before entering the Earth facing side of the Sun, we will be
at weeks of spotless activity.
Forecast: Australia will see an increase in low pressure systems and low
pressure troughs that can create low pressure systems. The predicted La
Nina and Antarctic jet streams should produce a very cold 2016 winter in
the southern hemisphere.
The record snow recently in Argentina, hail in Zimbabwe, record cold along
the east coast of Australia in parts of Queensland, all indicate cooler
conditions across the SH, not exclusively Australia.
Peter, what do you think about rut , how high will it go, it has been going up non stop
I’m honestly surprised at the level it’s attained. It’s a corrective wave, so I don’t have a whole bunch to go on. There’s a fib level (76%) at ~1215 and the C wave of the C wave will be 1.618X the A wave at ~1191. We appear to be in the final wave of the C wave but that’s about all the direction I can give.
thanks
With positive lunars past (phase, distance, and declination all negative beginning Friday) and falling tides next 10 days have taken a VXX call that expires 6/17. Total cost $100. Strike price $12. Usually VXX rises into Monday before Fed meeting.
Sold VXX call June 10, Friday, for $200 will rebuy near close if VXX falls later in the day. Today is Friday before opex week which is one the weakest days of the month. However, lunar tuner (phase, distance, declination) remain weak next week so if we do get a opex/post Fed rebound won’t be buying especially with June 23 Brexit vote uncertainty.
Valley- well done! double your $ in 48 hours…. nice!
Thanks, Amb!
Hi Stuart,
You still see 1980 for ES? Or was that a different Stuart?
“A single index making a new all-time high could prove to be a false sign of continued strength.”
Jeff Hirsch (Stock Traders Almanac), June 8, 2016
http://jeffhirsch.tumblr.com/post/145627661738/market-knocking-on-door-to-new-all-time-highs
Hi Peter
Thanks for the note on sunspots
I’ll need to update my graphs once I’m home ( this weekend 🙂 )
I have a few sunspot data sheets
One of the sheets is strictly days with spots ( even 1 )
And days with no sunspots . I charts them to count the days
If we are seeing 0 spit days then the argument is the sunspot peak
Is now past us and the decline in sunspots should bring cooler weather ?
Might be a cold winter id suspect .
My data is a few months behind so looks like a bit of work for me .
I dug into a few things , June 13 th should be a high of sorts
Also early August to sept 1 would be inline with the Mars Uranus crash cycle
Which ends Jan 20th . Nothing is guaranteed yet June 13 th is now my focus point
My dates though we’re June 6 – 13th .
Beautiful weather along the Oregon coast heading north bound 25 miles offshore to
An awesome sunset 🙂 can’t beat this weather .
Joe
Enjoy Joe and thanks for the info. 😉
Cheers,
W
Aug 1 would be a high sept 1 a low
And the Mars Uranus cycle shows it as a somewhat
Steep decline from August 1 to sept 1 just the clarify
Thanks Joe, I always appreciate your insights. As well as Valley.
All the best.
Joe, between end of June and august 1, will market chop around or make lower highs, thanks for your insight as always
Oct 3rd 2016 is the end of the 7 year Shemitah. The previous 2 cycles in 2001 and 2008 saw huge corrections. I am in the process of mapping out my scenario of the market going into Dec As of now, I see lot of side ways action into the later part of July. Will be sliding in the shorts than. Using longer term put options into Dec 2016 Spreading them out into Dec. Downside, worse case scenario Dow 14,430 – 14,340 If we some hoe manage to get down to that area into Sept, I will sell all my puts and wait for the bounce. Than re short again into the Gann cycle date for Dec Best of luck every one. One other note. Still to many bears for Mr Market liking. Lots of side ways action, chop, chop wearing out the bears before the fire works.
8:15 AM – 9 Jun 2016
I just added a chart of ES. It looks like we’re finally correcting. All down in 3 waves. I would expect a B and then a C wave. This is very easy to see in EURUSD. After that, one final wave up.
I also just added a chart of the SP500, showing the potential ending diagonal taking shape.
Good job Peet! 🙂 I say we take a turn around 13 June. 😉
Cheers,
W
This morning we have the drop I’ve been waiting for. We either have an expanding ending diagonal, or wave 2 of an ending diagonal. One is expanding (of course) and the other converging.
Either way, we’re now looking for a final wave up in three waves. That should be the end of it. It will likely “throw-over” the upper trendline before it’s done.
Currencies as well appear set up for a final wave.
The above refers to all the major US indices.
I think so too Peter thanks .
Europe will have to make a rebound to a lower high.
I posted two new charts at the top of the post. More to come on the weekend. I’ll also post my projected path for wave 3 down.
thanx peter
Peter, reminding you, if you can please do the wave 1, 2, 3 etc for WAVE 3, in the weekend update
SPX tops
I do not think so … I think we still need to reach 2134 ( ATH 2015 ) or 2160
any technical reasons ?
What are you thinking 2150-2160 on the throw over top on SPX?
Yes, 2134 or 2160 on SPX
If thats the case, we might have a couple more months of this back and forth. Maybe another August/September decline?
I do not know about time , however I have 28 – 30 June a very strong pivot ,
not interested in trying to convince anyone of anything…the facts are the facts…SPX, INDU, NYA, COMPQ, NDX, RUT, SVXY have all signaled downtrends…UVXY has signaled uptrend…the highs on the indices are in…check the daily and weekly SVXY charts for confirmation…
The only problem with yourmfacts is I totally agree.
The only problem with your facts, is I totally DISAGREE. Yes it is going to be choppy, side ways action for a while.
The highs are not in.
I appreciate your insights. It is a matter of how one interprets the charts. You can have 5 economist in a room, asking them which way the stock market is going go. You will end up getting 10 different answers. LOL
The above comment was for rotrot.
The definition of choppiness for my self, is wide swings form the recent highs down to the 2,000 sp
SVXY weekly trend…
https://twitter.com/allerotrot/status/741593519299629056
there is something about june 30, eric hadick is saying a low, norm wininski is saying a big lown, only 5 week cycle was up till june 13, now all 5, 10, 20,40 week are all going down to june 30, just like august 2015, but some are still saying high on that day. But market coming down on heavy volume, all the gaps might be filled on light volume as Peter is saying
Sell off around the world today. Brexit on June 23. Possibly next two weeks will take us below 1900 on spx. Using 12 year cycle as guide (Macrotrends.com historical data), this year may resemble 2004, 1992, 1980, 1968, 1956, 1944, 1932…. Each of these years offered no net gains for year.
Nice play on your short Valley !
Thanks, Dave.
It’s gonne be a special week with Wednesday the FOMC and Friday quarterly expiration.
Last weekend I said 6/13 would be a high, so no surprised Wallstreet reversed Friday.
6/13 is a very strong date, as is 6/17. So the most likely scenario is another consolidating week, with Monday high, wedensday low and pull back into Friday.
The langer term cycles are all down so a new ATH is not what I expect. But after next week we should see some serious decline. Guess that is what Peter sees aswell.
Have a nice weekend,
André
Another strong date would be 6/21. This would give an alternative scenario where we willsee another low Friday 17 and a retrace into 6/21.
Peter – I just want to say thank you. We are truly blessed to be able to learn from you and benefit from the analysis you provide. Your website is one of the first I look at each day.
Thank you my friend!
Joe K,
Thanks for the kind words. Very much appreciated.
This website is for educational purposes relating to Elliott Wave, natural cycles, and the Quantum Revolution (Great Awakening). I welcome questions or comments about any of these subjects. Due to a heavy schedule, I may not have the time to answer questions that relate to my area of expertise.
I reserve the right to remove any comment that is deemed negative, is unhelpful, or off-topic. Such comments may be removed.
Want to comment? You need to be logged in to comment. You can register here.